
Key Insights
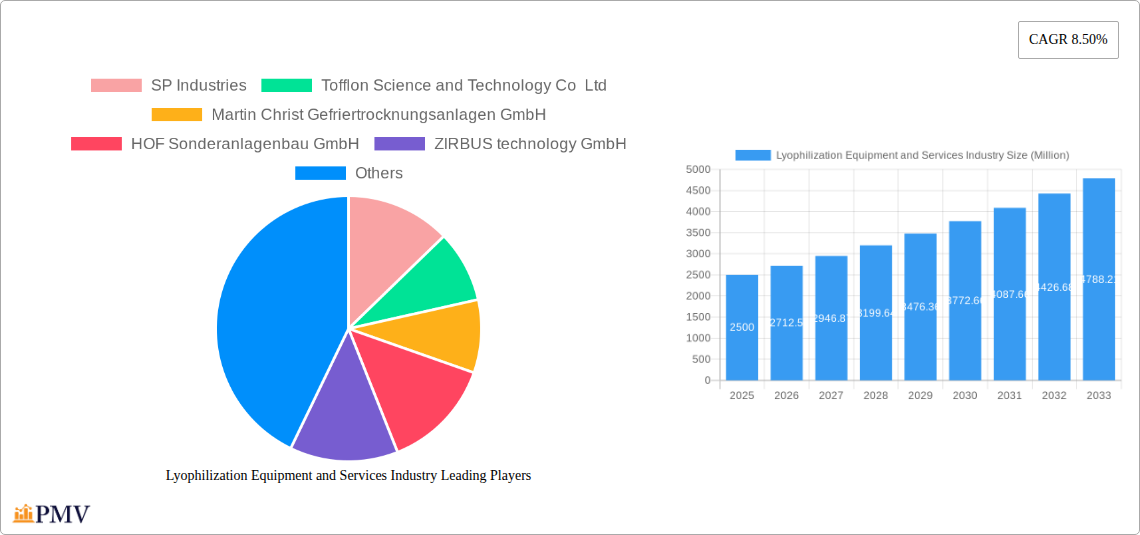
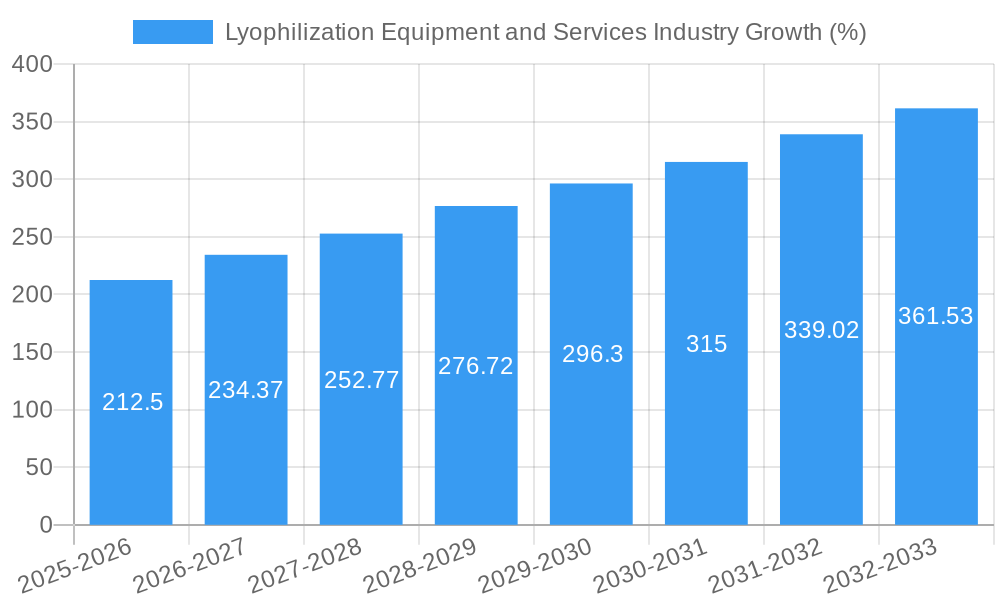
The global lyophilization equipment and services market is experiencing robust growth, driven by increasing demand from the pharmaceutical and biotechnology sectors for stable and shelf-stable drug formulations. The market's compound annual growth rate (CAGR) of 8.50% from 2019 to 2024 suggests a significant expansion, projected to continue through 2033. Key drivers include the rising prevalence of biologics and pharmaceuticals requiring lyophilization, advancements in freeze-drying technology leading to improved efficiency and reduced processing times, and a growing focus on optimizing drug delivery systems. The market is segmented by modality (dryer type, encompassing various configurations and scales), product offerings (equipment, accessories, and services), and application areas. The pharmaceutical and biotech manufacturing segment is the largest contributor, reflecting the critical role of lyophilization in preserving drug efficacy and extending shelf life. Other significant application areas include food processing and packaging. Competition among leading players such as SP Industries, Tofflon Science and Technology Co Ltd, and GEA Group is intense, with companies focusing on innovation, strategic partnerships, and expanding their global footprint to maintain market share.
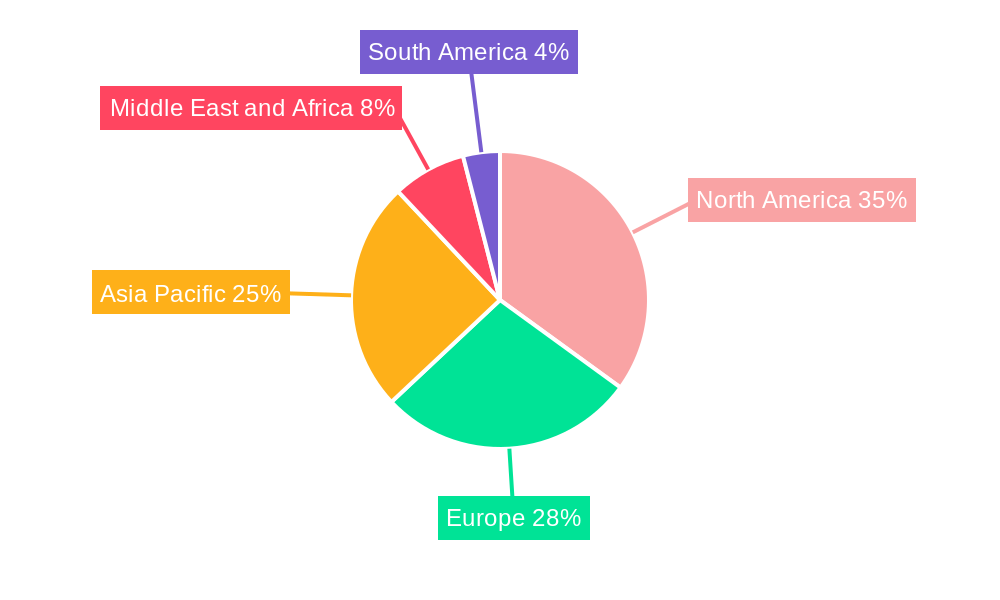
The North American region currently holds a significant share of the global market due to the presence of major pharmaceutical and biotechnology companies and advanced research infrastructure. However, the Asia Pacific region is expected to exhibit the fastest growth, driven by increasing healthcare expenditure and burgeoning pharmaceutical industries in countries like China and India. Restrictive regulations, high initial investment costs for lyophilization equipment, and the need for skilled technicians to operate and maintain these systems present challenges for market expansion. However, continuous technological advancements, along with the rising adoption of outsourcing and contract manufacturing services, are likely to mitigate these restraints in the coming years. The forecast period of 2025-2033 will likely witness a continued expansion in the market size, propelled by the aforementioned growth drivers and a greater adoption of lyophilization in emerging markets. The market is anticipated to reach a substantial size by 2033, exceeding the current estimates significantly due to the robust growth rate.
Lyophilization Equipment and Services Industry Market Report: 2019-2033
This comprehensive report provides an in-depth analysis of the global Lyophilization Equipment and Services industry, offering valuable insights for stakeholders, investors, and industry professionals. The report covers the period 2019-2033, with a focus on the forecast period 2025-2033 and a base year of 2025. The market is segmented by modality (dryer type), products (accessories and services), applications (pharmaceutical & biotech manufacturing, food processing & packaging, and others), and key geographic regions. The total market size in 2025 is estimated at xx Million, projected to reach xx Million by 2033, exhibiting a CAGR of xx% during the forecast period.
Lyophilization Equipment and Services Industry Market Structure & Competitive Dynamics
The global lyophilization equipment and services market is moderately concentrated, with several key players holding significant market share. Competition is driven by innovation in dryer technology, service offerings, and expansion into niche applications. The market exhibits a dynamic innovation ecosystem, with continuous advancements in freeze-drying technology, automation, and process optimization. Stringent regulatory frameworks, particularly in the pharmaceutical and biotech sectors, significantly influence market dynamics. Product substitutes, such as spray drying, exist but are often unsuitable for heat-sensitive products, maintaining the demand for lyophilization. End-user trends, including the increasing demand for biologics and personalized medicine, are boosting market growth. Mergers and acquisitions (M&A) activity has been moderate, with deal values averaging xx Million in recent years. Key players are actively pursuing strategic partnerships and collaborations to expand their market reach and product portfolios. For instance, the market share of SP Industries is estimated at xx%, while GEA Group holds approximately xx%.
Lyophilization Equipment and Services Industry Industry Trends & Insights
The lyophilization equipment and services market is experiencing robust growth driven by several factors. The increasing demand for lyophilized pharmaceuticals, particularly biologics, is a primary driver, owing to their improved stability and extended shelf life. Technological advancements, such as the development of automated systems and advanced process control, are enhancing efficiency and reducing operational costs. Consumer preferences for convenient and stable products are also fueling demand. The market is witnessing increased adoption of innovative dryer types, such as manifold and shelf dryers, driven by their superior performance and versatility. However, competitive intensity remains high, with companies focusing on product differentiation, technological innovation, and service enhancements to gain a competitive edge. The market penetration of automated lyophilization systems is increasing steadily, reaching approximately xx% in 2025.
Dominant Markets & Segments in Lyophilization Equipment and Services Industry
The pharmaceutical and biotech manufacturing segment dominates the lyophilization equipment and services market, accounting for approximately xx% of the total market value in 2025. This dominance is driven by the high demand for lyophilized pharmaceuticals and the stringent quality requirements of the industry.
- Key Drivers for Pharmaceutical & Biotech Manufacturing:
- Stringent regulatory requirements necessitating advanced freeze-drying technologies.
- Rising demand for biologics and personalized medicines.
- Increased investment in R&D and manufacturing capacity expansion.
The North American region holds the largest market share, followed by Europe and Asia-Pacific.
- Key Drivers for North American Dominance:
- High concentration of pharmaceutical and biotech companies.
- Strong regulatory framework supporting innovation.
- Significant investment in advanced manufacturing technologies.
Within dryer types, manifold dryers hold a significant market share due to their high processing capacity and efficiency. In the services segment, process validation and optimization services are in high demand, given their critical role in ensuring product quality and regulatory compliance.
Lyophilization Equipment and Services Industry Product Innovations
Recent product innovations focus on improving energy efficiency, reducing processing time, and enhancing process control. Manufacturers are introducing automated systems with advanced features such as real-time monitoring and data analytics. The development of compact and modular lyophilizers is addressing the needs of smaller-scale manufacturers and research laboratories. These advancements are improving the market fit by catering to diverse needs and enhancing the overall value proposition for end-users.
Report Segmentation & Scope
This report segments the lyophilization equipment and services market by:
- Modality (Dryer Type): Shelf dryers, manifold dryers, and other specialized dryers. Shelf dryers are projected to hold the largest market share due to their versatility.
- Other Products (Accessories): This includes vials, stoppers, and other consumables crucial for the lyophilization process. The market for accessories is expected to grow in line with the overall market growth.
- Other Accessories (Services): This segment encompasses process validation, equipment maintenance, and training services. Service offerings are projected to witness robust growth, driven by the increasing demand for specialized expertise.
- Application: Pharmaceutical and biotech manufacturing, food processing and packaging, and other applications (e.g., cosmetics, diagnostics). The pharmaceutical and biotech segment holds the dominant market share.
Each segment's growth projection, market size, and competitive dynamics are analyzed in detail within the report.
Key Drivers of Lyophilization Equipment and Services Industry Growth
The growth of the lyophilization equipment and services market is propelled by technological advancements, including automation and improved process control; rising demand for lyophilized products in the pharmaceutical, biotechnology, and food industries; and supportive regulatory frameworks promoting innovation and adoption of advanced technologies. Furthermore, increasing investments in R&D and the growing prevalence of biologics are key drivers.
Challenges in the Lyophilization Equipment and Services Industry Sector
The industry faces challenges including stringent regulatory compliance requirements, which can increase costs and development timelines. Supply chain disruptions and fluctuations in raw material prices can also impact profitability. Furthermore, intense competition among established players and new entrants poses a challenge. The overall impact of these challenges on the industry is estimated to be a xx% reduction in projected growth in the next five years.
Leading Players in the Lyophilization Equipment and Services Industry Market
- SP Industries
- Tofflon Science and Technology Co Ltd
- Martin Christ Gefriertrocknungsanlagen GmbH
- HOF Sonderanlagenbau GmbH
- ZIRBUS technology GmbH
- GEA Group
- Azbil Corporation (Telstar)
- Millrock Technology Inc
- Labconco
- Scala Scientific
- Optima Packaging Group GmbH
Key Developments in Lyophilization Equipment and Services Industry Sector
- November 2022: Telstar expanded its process laboratory service for freeze-drying and sterilization, incorporating cold sterilization methods.
- July 2022: Leybold launched the NDi vacuum system for food packaging applications.
These developments highlight the industry's focus on expanding service offerings and addressing specific application needs.
Strategic Lyophilization Equipment and Services Industry Market Outlook
The future of the lyophilization equipment and services market is promising, with continued growth driven by technological innovation and increasing demand across various sectors. Strategic opportunities exist in developing energy-efficient systems, expanding into emerging markets, and providing comprehensive service packages. Focusing on customized solutions and strategic partnerships will be crucial for sustained success in this competitive landscape.
Lyophilization Equipment and Services Industry Segmentation
-
1. Modality
-
1.1. Dryer Type
- 1.1.1. Tray-style Freeze Dryers
- 1.1.2. Manifold Freeze Dryers
- 1.1.3. Rotary Freeze Dryers
- 1.1.4. Other Products
-
1.2. Accessories
- 1.2.1. Vacuum Systems
- 1.2.2. CIP (Clean-in-place) Systems
- 1.2.3. Drying Chamber
- 1.2.4. Other Accessories
- 1.3. Services
-
1.1. Dryer Type
-
2. Application
- 2.1. Food Processing and Packaging
- 2.2. Pharmaceutical and Biotech Manufacturing
- 2.3. Other Applications
Lyophilization Equipment and Services Industry Segmentation By Geography
-
1. North America
- 1.1. United States
- 1.2. Canada
- 1.3. Mexico
-
2. Europe
- 2.1. Germany
- 2.2. United Kingdom
- 2.3. France
- 2.4. Italy
- 2.5. Spain
- 2.6. Rest of Europe
-
3. Asia Pacific
- 3.1. China
- 3.2. Japan
- 3.3. India
- 3.4. Australia
- 3.5. South Korea
- 3.6. Rest of Asia Pacific
-
4. Middle East and Africa
- 4.1. GCC
- 4.2. South Africa
- 4.3. Rest of Middle East and Africa
-
5. South America
- 5.1. Brazil
- 5.2. Argentina
- 5.3. Rest of South America
Lyophilization Equipment and Services Industry REPORT HIGHLIGHTS
| Aspects | Details |
|---|---|
| Study Period | 2019-2033 |
| Base Year | 2024 |
| Estimated Year | 2025 |
| Forecast Period | 2025-2033 |
| Historical Period | 2019-2024 |
| Growth Rate | CAGR of 8.50% from 2019-2033 |
| Segmentation |
|
Table of Contents
- 1. Introduction
- 1.1. Research Scope
- 1.2. Market Segmentation
- 1.3. Research Methodology
- 1.4. Definitions and Assumptions
- 2. Executive Summary
- 2.1. Introduction
- 3. Market Dynamics
- 3.1. Introduction
- 3.2. Market Drivers
- 3.2.1. Rising Demand for Lyophilized Products; Technological Advancements in Lyophilization Methods
- 3.3. Market Restrains
- 3.3.1. Increasing Utilization of Alternative Drying Techniques in the Pharmaceutical and Biotechnology Industries; High Setup and Maintenance Cost of Freeze-Drying Equipment
- 3.4. Market Trends
- 3.4.1. Pharmaceutical and Biotech Manufacturing Segment is Expected to Witness Growth Over the Forecast Period
- 4. Market Factor Analysis
- 4.1. Porters Five Forces
- 4.2. Supply/Value Chain
- 4.3. PESTEL analysis
- 4.4. Market Entropy
- 4.5. Patent/Trademark Analysis
- 5. Global Lyophilization Equipment and Services Industry Analysis, Insights and Forecast, 2019-2031
- 5.1. Market Analysis, Insights and Forecast - by Modality
- 5.1.1. Dryer Type
- 5.1.1.1. Tray-style Freeze Dryers
- 5.1.1.2. Manifold Freeze Dryers
- 5.1.1.3. Rotary Freeze Dryers
- 5.1.1.4. Other Products
- 5.1.2. Accessories
- 5.1.2.1. Vacuum Systems
- 5.1.2.2. CIP (Clean-in-place) Systems
- 5.1.2.3. Drying Chamber
- 5.1.2.4. Other Accessories
- 5.1.3. Services
- 5.1.1. Dryer Type
- 5.2. Market Analysis, Insights and Forecast - by Application
- 5.2.1. Food Processing and Packaging
- 5.2.2. Pharmaceutical and Biotech Manufacturing
- 5.2.3. Other Applications
- 5.3. Market Analysis, Insights and Forecast - by Region
- 5.3.1. North America
- 5.3.2. Europe
- 5.3.3. Asia Pacific
- 5.3.4. Middle East and Africa
- 5.3.5. South America
- 5.1. Market Analysis, Insights and Forecast - by Modality
- 6. North America Lyophilization Equipment and Services Industry Analysis, Insights and Forecast, 2019-2031
- 6.1. Market Analysis, Insights and Forecast - by Modality
- 6.1.1. Dryer Type
- 6.1.1.1. Tray-style Freeze Dryers
- 6.1.1.2. Manifold Freeze Dryers
- 6.1.1.3. Rotary Freeze Dryers
- 6.1.1.4. Other Products
- 6.1.2. Accessories
- 6.1.2.1. Vacuum Systems
- 6.1.2.2. CIP (Clean-in-place) Systems
- 6.1.2.3. Drying Chamber
- 6.1.2.4. Other Accessories
- 6.1.3. Services
- 6.1.1. Dryer Type
- 6.2. Market Analysis, Insights and Forecast - by Application
- 6.2.1. Food Processing and Packaging
- 6.2.2. Pharmaceutical and Biotech Manufacturing
- 6.2.3. Other Applications
- 6.1. Market Analysis, Insights and Forecast - by Modality
- 7. Europe Lyophilization Equipment and Services Industry Analysis, Insights and Forecast, 2019-2031
- 7.1. Market Analysis, Insights and Forecast - by Modality
- 7.1.1. Dryer Type
- 7.1.1.1. Tray-style Freeze Dryers
- 7.1.1.2. Manifold Freeze Dryers
- 7.1.1.3. Rotary Freeze Dryers
- 7.1.1.4. Other Products
- 7.1.2. Accessories
- 7.1.2.1. Vacuum Systems
- 7.1.2.2. CIP (Clean-in-place) Systems
- 7.1.2.3. Drying Chamber
- 7.1.2.4. Other Accessories
- 7.1.3. Services
- 7.1.1. Dryer Type
- 7.2. Market Analysis, Insights and Forecast - by Application
- 7.2.1. Food Processing and Packaging
- 7.2.2. Pharmaceutical and Biotech Manufacturing
- 7.2.3. Other Applications
- 7.1. Market Analysis, Insights and Forecast - by Modality
- 8. Asia Pacific Lyophilization Equipment and Services Industry Analysis, Insights and Forecast, 2019-2031
- 8.1. Market Analysis, Insights and Forecast - by Modality
- 8.1.1. Dryer Type
- 8.1.1.1. Tray-style Freeze Dryers
- 8.1.1.2. Manifold Freeze Dryers
- 8.1.1.3. Rotary Freeze Dryers
- 8.1.1.4. Other Products
- 8.1.2. Accessories
- 8.1.2.1. Vacuum Systems
- 8.1.2.2. CIP (Clean-in-place) Systems
- 8.1.2.3. Drying Chamber
- 8.1.2.4. Other Accessories
- 8.1.3. Services
- 8.1.1. Dryer Type
- 8.2. Market Analysis, Insights and Forecast - by Application
- 8.2.1. Food Processing and Packaging
- 8.2.2. Pharmaceutical and Biotech Manufacturing
- 8.2.3. Other Applications
- 8.1. Market Analysis, Insights and Forecast - by Modality
- 9. Middle East and Africa Lyophilization Equipment and Services Industry Analysis, Insights and Forecast, 2019-2031
- 9.1. Market Analysis, Insights and Forecast - by Modality
- 9.1.1. Dryer Type
- 9.1.1.1. Tray-style Freeze Dryers
- 9.1.1.2. Manifold Freeze Dryers
- 9.1.1.3. Rotary Freeze Dryers
- 9.1.1.4. Other Products
- 9.1.2. Accessories
- 9.1.2.1. Vacuum Systems
- 9.1.2.2. CIP (Clean-in-place) Systems
- 9.1.2.3. Drying Chamber
- 9.1.2.4. Other Accessories
- 9.1.3. Services
- 9.1.1. Dryer Type
- 9.2. Market Analysis, Insights and Forecast - by Application
- 9.2.1. Food Processing and Packaging
- 9.2.2. Pharmaceutical and Biotech Manufacturing
- 9.2.3. Other Applications
- 9.1. Market Analysis, Insights and Forecast - by Modality
- 10. South America Lyophilization Equipment and Services Industry Analysis, Insights and Forecast, 2019-2031
- 10.1. Market Analysis, Insights and Forecast - by Modality
- 10.1.1. Dryer Type
- 10.1.1.1. Tray-style Freeze Dryers
- 10.1.1.2. Manifold Freeze Dryers
- 10.1.1.3. Rotary Freeze Dryers
- 10.1.1.4. Other Products
- 10.1.2. Accessories
- 10.1.2.1. Vacuum Systems
- 10.1.2.2. CIP (Clean-in-place) Systems
- 10.1.2.3. Drying Chamber
- 10.1.2.4. Other Accessories
- 10.1.3. Services
- 10.1.1. Dryer Type
- 10.2. Market Analysis, Insights and Forecast - by Application
- 10.2.1. Food Processing and Packaging
- 10.2.2. Pharmaceutical and Biotech Manufacturing
- 10.2.3. Other Applications
- 10.1. Market Analysis, Insights and Forecast - by Modality
- 11. North America Lyophilization Equipment and Services Industry Analysis, Insights and Forecast, 2019-2031
- 11.1. Market Analysis, Insights and Forecast - By Country/Sub-region
- 11.1.1. undefined
- 12. Europe Lyophilization Equipment and Services Industry Analysis, Insights and Forecast, 2019-2031
- 12.1. Market Analysis, Insights and Forecast - By Country/Sub-region
- 12.1.1. undefined
- 13. Asia Pacific Lyophilization Equipment and Services Industry Analysis, Insights and Forecast, 2019-2031
- 13.1. Market Analysis, Insights and Forecast - By Country/Sub-region
- 13.1.1. undefined
- 14. Middle East and Africa Lyophilization Equipment and Services Industry Analysis, Insights and Forecast, 2019-2031
- 14.1. Market Analysis, Insights and Forecast - By Country/Sub-region
- 14.1.1. undefined
- 15. South America Lyophilization Equipment and Services Industry Analysis, Insights and Forecast, 2019-2031
- 15.1. Market Analysis, Insights and Forecast - By Country/Sub-region
- 15.1.1. undefined
- 16. Competitive Analysis
- 16.1. Global Market Share Analysis 2024
- 16.2. Company Profiles
- 16.2.1 SP Industries
- 16.2.1.1. Overview
- 16.2.1.2. Products
- 16.2.1.3. SWOT Analysis
- 16.2.1.4. Recent Developments
- 16.2.1.5. Financials (Based on Availability)
- 16.2.2 Tofflon Science and Technology Co Ltd
- 16.2.2.1. Overview
- 16.2.2.2. Products
- 16.2.2.3. SWOT Analysis
- 16.2.2.4. Recent Developments
- 16.2.2.5. Financials (Based on Availability)
- 16.2.3 Martin Christ Gefriertrocknungsanlagen GmbH
- 16.2.3.1. Overview
- 16.2.3.2. Products
- 16.2.3.3. SWOT Analysis
- 16.2.3.4. Recent Developments
- 16.2.3.5. Financials (Based on Availability)
- 16.2.4 HOF Sonderanlagenbau GmbH
- 16.2.4.1. Overview
- 16.2.4.2. Products
- 16.2.4.3. SWOT Analysis
- 16.2.4.4. Recent Developments
- 16.2.4.5. Financials (Based on Availability)
- 16.2.5 ZIRBUS technology GmbH
- 16.2.5.1. Overview
- 16.2.5.2. Products
- 16.2.5.3. SWOT Analysis
- 16.2.5.4. Recent Developments
- 16.2.5.5. Financials (Based on Availability)
- 16.2.6 GEA Group
- 16.2.6.1. Overview
- 16.2.6.2. Products
- 16.2.6.3. SWOT Analysis
- 16.2.6.4. Recent Developments
- 16.2.6.5. Financials (Based on Availability)
- 16.2.7 Azbil Corporation (Telstar)
- 16.2.7.1. Overview
- 16.2.7.2. Products
- 16.2.7.3. SWOT Analysis
- 16.2.7.4. Recent Developments
- 16.2.7.5. Financials (Based on Availability)
- 16.2.8 Millrock Technology Inc
- 16.2.8.1. Overview
- 16.2.8.2. Products
- 16.2.8.3. SWOT Analysis
- 16.2.8.4. Recent Developments
- 16.2.8.5. Financials (Based on Availability)
- 16.2.9 Labconco
- 16.2.9.1. Overview
- 16.2.9.2. Products
- 16.2.9.3. SWOT Analysis
- 16.2.9.4. Recent Developments
- 16.2.9.5. Financials (Based on Availability)
- 16.2.10 Scala Scientific
- 16.2.10.1. Overview
- 16.2.10.2. Products
- 16.2.10.3. SWOT Analysis
- 16.2.10.4. Recent Developments
- 16.2.10.5. Financials (Based on Availability)
- 16.2.11 Optima Packaging Group GmbH
- 16.2.11.1. Overview
- 16.2.11.2. Products
- 16.2.11.3. SWOT Analysis
- 16.2.11.4. Recent Developments
- 16.2.11.5. Financials (Based on Availability)
- 16.2.1 SP Industries
List of Figures
- Figure 1: Global Lyophilization Equipment and Services Industry Revenue Breakdown (Million, %) by Region 2024 & 2032
- Figure 2: Global Lyophilization Equipment and Services Industry Volume Breakdown (K Unit, %) by Region 2024 & 2032
- Figure 3: North America Lyophilization Equipment and Services Industry Revenue (Million), by Country 2024 & 2032
- Figure 4: North America Lyophilization Equipment and Services Industry Volume (K Unit), by Country 2024 & 2032
- Figure 5: North America Lyophilization Equipment and Services Industry Revenue Share (%), by Country 2024 & 2032
- Figure 6: North America Lyophilization Equipment and Services Industry Volume Share (%), by Country 2024 & 2032
- Figure 7: Europe Lyophilization Equipment and Services Industry Revenue (Million), by Country 2024 & 2032
- Figure 8: Europe Lyophilization Equipment and Services Industry Volume (K Unit), by Country 2024 & 2032
- Figure 9: Europe Lyophilization Equipment and Services Industry Revenue Share (%), by Country 2024 & 2032
- Figure 10: Europe Lyophilization Equipment and Services Industry Volume Share (%), by Country 2024 & 2032
- Figure 11: Asia Pacific Lyophilization Equipment and Services Industry Revenue (Million), by Country 2024 & 2032
- Figure 12: Asia Pacific Lyophilization Equipment and Services Industry Volume (K Unit), by Country 2024 & 2032
- Figure 13: Asia Pacific Lyophilization Equipment and Services Industry Revenue Share (%), by Country 2024 & 2032
- Figure 14: Asia Pacific Lyophilization Equipment and Services Industry Volume Share (%), by Country 2024 & 2032
- Figure 15: Middle East and Africa Lyophilization Equipment and Services Industry Revenue (Million), by Country 2024 & 2032
- Figure 16: Middle East and Africa Lyophilization Equipment and Services Industry Volume (K Unit), by Country 2024 & 2032
- Figure 17: Middle East and Africa Lyophilization Equipment and Services Industry Revenue Share (%), by Country 2024 & 2032
- Figure 18: Middle East and Africa Lyophilization Equipment and Services Industry Volume Share (%), by Country 2024 & 2032
- Figure 19: South America Lyophilization Equipment and Services Industry Revenue (Million), by Country 2024 & 2032
- Figure 20: South America Lyophilization Equipment and Services Industry Volume (K Unit), by Country 2024 & 2032
- Figure 21: South America Lyophilization Equipment and Services Industry Revenue Share (%), by Country 2024 & 2032
- Figure 22: South America Lyophilization Equipment and Services Industry Volume Share (%), by Country 2024 & 2032
- Figure 23: North America Lyophilization Equipment and Services Industry Revenue (Million), by Modality 2024 & 2032
- Figure 24: North America Lyophilization Equipment and Services Industry Volume (K Unit), by Modality 2024 & 2032
- Figure 25: North America Lyophilization Equipment and Services Industry Revenue Share (%), by Modality 2024 & 2032
- Figure 26: North America Lyophilization Equipment and Services Industry Volume Share (%), by Modality 2024 & 2032
- Figure 27: North America Lyophilization Equipment and Services Industry Revenue (Million), by Application 2024 & 2032
- Figure 28: North America Lyophilization Equipment and Services Industry Volume (K Unit), by Application 2024 & 2032
- Figure 29: North America Lyophilization Equipment and Services Industry Revenue Share (%), by Application 2024 & 2032
- Figure 30: North America Lyophilization Equipment and Services Industry Volume Share (%), by Application 2024 & 2032
- Figure 31: North America Lyophilization Equipment and Services Industry Revenue (Million), by Country 2024 & 2032
- Figure 32: North America Lyophilization Equipment and Services Industry Volume (K Unit), by Country 2024 & 2032
- Figure 33: North America Lyophilization Equipment and Services Industry Revenue Share (%), by Country 2024 & 2032
- Figure 34: North America Lyophilization Equipment and Services Industry Volume Share (%), by Country 2024 & 2032
- Figure 35: Europe Lyophilization Equipment and Services Industry Revenue (Million), by Modality 2024 & 2032
- Figure 36: Europe Lyophilization Equipment and Services Industry Volume (K Unit), by Modality 2024 & 2032
- Figure 37: Europe Lyophilization Equipment and Services Industry Revenue Share (%), by Modality 2024 & 2032
- Figure 38: Europe Lyophilization Equipment and Services Industry Volume Share (%), by Modality 2024 & 2032
- Figure 39: Europe Lyophilization Equipment and Services Industry Revenue (Million), by Application 2024 & 2032
- Figure 40: Europe Lyophilization Equipment and Services Industry Volume (K Unit), by Application 2024 & 2032
- Figure 41: Europe Lyophilization Equipment and Services Industry Revenue Share (%), by Application 2024 & 2032
- Figure 42: Europe Lyophilization Equipment and Services Industry Volume Share (%), by Application 2024 & 2032
- Figure 43: Europe Lyophilization Equipment and Services Industry Revenue (Million), by Country 2024 & 2032
- Figure 44: Europe Lyophilization Equipment and Services Industry Volume (K Unit), by Country 2024 & 2032
- Figure 45: Europe Lyophilization Equipment and Services Industry Revenue Share (%), by Country 2024 & 2032
- Figure 46: Europe Lyophilization Equipment and Services Industry Volume Share (%), by Country 2024 & 2032
- Figure 47: Asia Pacific Lyophilization Equipment and Services Industry Revenue (Million), by Modality 2024 & 2032
- Figure 48: Asia Pacific Lyophilization Equipment and Services Industry Volume (K Unit), by Modality 2024 & 2032
- Figure 49: Asia Pacific Lyophilization Equipment and Services Industry Revenue Share (%), by Modality 2024 & 2032
- Figure 50: Asia Pacific Lyophilization Equipment and Services Industry Volume Share (%), by Modality 2024 & 2032
- Figure 51: Asia Pacific Lyophilization Equipment and Services Industry Revenue (Million), by Application 2024 & 2032
- Figure 52: Asia Pacific Lyophilization Equipment and Services Industry Volume (K Unit), by Application 2024 & 2032
- Figure 53: Asia Pacific Lyophilization Equipment and Services Industry Revenue Share (%), by Application 2024 & 2032
- Figure 54: Asia Pacific Lyophilization Equipment and Services Industry Volume Share (%), by Application 2024 & 2032
- Figure 55: Asia Pacific Lyophilization Equipment and Services Industry Revenue (Million), by Country 2024 & 2032
- Figure 56: Asia Pacific Lyophilization Equipment and Services Industry Volume (K Unit), by Country 2024 & 2032
- Figure 57: Asia Pacific Lyophilization Equipment and Services Industry Revenue Share (%), by Country 2024 & 2032
- Figure 58: Asia Pacific Lyophilization Equipment and Services Industry Volume Share (%), by Country 2024 & 2032
- Figure 59: Middle East and Africa Lyophilization Equipment and Services Industry Revenue (Million), by Modality 2024 & 2032
- Figure 60: Middle East and Africa Lyophilization Equipment and Services Industry Volume (K Unit), by Modality 2024 & 2032
- Figure 61: Middle East and Africa Lyophilization Equipment and Services Industry Revenue Share (%), by Modality 2024 & 2032
- Figure 62: Middle East and Africa Lyophilization Equipment and Services Industry Volume Share (%), by Modality 2024 & 2032
- Figure 63: Middle East and Africa Lyophilization Equipment and Services Industry Revenue (Million), by Application 2024 & 2032
- Figure 64: Middle East and Africa Lyophilization Equipment and Services Industry Volume (K Unit), by Application 2024 & 2032
- Figure 65: Middle East and Africa Lyophilization Equipment and Services Industry Revenue Share (%), by Application 2024 & 2032
- Figure 66: Middle East and Africa Lyophilization Equipment and Services Industry Volume Share (%), by Application 2024 & 2032
- Figure 67: Middle East and Africa Lyophilization Equipment and Services Industry Revenue (Million), by Country 2024 & 2032
- Figure 68: Middle East and Africa Lyophilization Equipment and Services Industry Volume (K Unit), by Country 2024 & 2032
- Figure 69: Middle East and Africa Lyophilization Equipment and Services Industry Revenue Share (%), by Country 2024 & 2032
- Figure 70: Middle East and Africa Lyophilization Equipment and Services Industry Volume Share (%), by Country 2024 & 2032
- Figure 71: South America Lyophilization Equipment and Services Industry Revenue (Million), by Modality 2024 & 2032
- Figure 72: South America Lyophilization Equipment and Services Industry Volume (K Unit), by Modality 2024 & 2032
- Figure 73: South America Lyophilization Equipment and Services Industry Revenue Share (%), by Modality 2024 & 2032
- Figure 74: South America Lyophilization Equipment and Services Industry Volume Share (%), by Modality 2024 & 2032
- Figure 75: South America Lyophilization Equipment and Services Industry Revenue (Million), by Application 2024 & 2032
- Figure 76: South America Lyophilization Equipment and Services Industry Volume (K Unit), by Application 2024 & 2032
- Figure 77: South America Lyophilization Equipment and Services Industry Revenue Share (%), by Application 2024 & 2032
- Figure 78: South America Lyophilization Equipment and Services Industry Volume Share (%), by Application 2024 & 2032
- Figure 79: South America Lyophilization Equipment and Services Industry Revenue (Million), by Country 2024 & 2032
- Figure 80: South America Lyophilization Equipment and Services Industry Volume (K Unit), by Country 2024 & 2032
- Figure 81: South America Lyophilization Equipment and Services Industry Revenue Share (%), by Country 2024 & 2032
- Figure 82: South America Lyophilization Equipment and Services Industry Volume Share (%), by Country 2024 & 2032
List of Tables
- Table 1: Global Lyophilization Equipment and Services Industry Revenue Million Forecast, by Region 2019 & 2032
- Table 2: Global Lyophilization Equipment and Services Industry Volume K Unit Forecast, by Region 2019 & 2032
- Table 3: Global Lyophilization Equipment and Services Industry Revenue Million Forecast, by Modality 2019 & 2032
- Table 4: Global Lyophilization Equipment and Services Industry Volume K Unit Forecast, by Modality 2019 & 2032
- Table 5: Global Lyophilization Equipment and Services Industry Revenue Million Forecast, by Application 2019 & 2032
- Table 6: Global Lyophilization Equipment and Services Industry Volume K Unit Forecast, by Application 2019 & 2032
- Table 7: Global Lyophilization Equipment and Services Industry Revenue Million Forecast, by Region 2019 & 2032
- Table 8: Global Lyophilization Equipment and Services Industry Volume K Unit Forecast, by Region 2019 & 2032
- Table 9: Global Lyophilization Equipment and Services Industry Revenue Million Forecast, by Country 2019 & 2032
- Table 10: Global Lyophilization Equipment and Services Industry Volume K Unit Forecast, by Country 2019 & 2032
- Table 11: Global Lyophilization Equipment and Services Industry Revenue Million Forecast, by Country 2019 & 2032
- Table 12: Global Lyophilization Equipment and Services Industry Volume K Unit Forecast, by Country 2019 & 2032
- Table 13: Global Lyophilization Equipment and Services Industry Revenue Million Forecast, by Country 2019 & 2032
- Table 14: Global Lyophilization Equipment and Services Industry Volume K Unit Forecast, by Country 2019 & 2032
- Table 15: Global Lyophilization Equipment and Services Industry Revenue Million Forecast, by Country 2019 & 2032
- Table 16: Global Lyophilization Equipment and Services Industry Volume K Unit Forecast, by Country 2019 & 2032
- Table 17: Global Lyophilization Equipment and Services Industry Revenue Million Forecast, by Country 2019 & 2032
- Table 18: Global Lyophilization Equipment and Services Industry Volume K Unit Forecast, by Country 2019 & 2032
- Table 19: Global Lyophilization Equipment and Services Industry Revenue Million Forecast, by Modality 2019 & 2032
- Table 20: Global Lyophilization Equipment and Services Industry Volume K Unit Forecast, by Modality 2019 & 2032
- Table 21: Global Lyophilization Equipment and Services Industry Revenue Million Forecast, by Application 2019 & 2032
- Table 22: Global Lyophilization Equipment and Services Industry Volume K Unit Forecast, by Application 2019 & 2032
- Table 23: Global Lyophilization Equipment and Services Industry Revenue Million Forecast, by Country 2019 & 2032
- Table 24: Global Lyophilization Equipment and Services Industry Volume K Unit Forecast, by Country 2019 & 2032
- Table 25: United States Lyophilization Equipment and Services Industry Revenue (Million) Forecast, by Application 2019 & 2032
- Table 26: United States Lyophilization Equipment and Services Industry Volume (K Unit) Forecast, by Application 2019 & 2032
- Table 27: Canada Lyophilization Equipment and Services Industry Revenue (Million) Forecast, by Application 2019 & 2032
- Table 28: Canada Lyophilization Equipment and Services Industry Volume (K Unit) Forecast, by Application 2019 & 2032
- Table 29: Mexico Lyophilization Equipment and Services Industry Revenue (Million) Forecast, by Application 2019 & 2032
- Table 30: Mexico Lyophilization Equipment and Services Industry Volume (K Unit) Forecast, by Application 2019 & 2032
- Table 31: Global Lyophilization Equipment and Services Industry Revenue Million Forecast, by Modality 2019 & 2032
- Table 32: Global Lyophilization Equipment and Services Industry Volume K Unit Forecast, by Modality 2019 & 2032
- Table 33: Global Lyophilization Equipment and Services Industry Revenue Million Forecast, by Application 2019 & 2032
- Table 34: Global Lyophilization Equipment and Services Industry Volume K Unit Forecast, by Application 2019 & 2032
- Table 35: Global Lyophilization Equipment and Services Industry Revenue Million Forecast, by Country 2019 & 2032
- Table 36: Global Lyophilization Equipment and Services Industry Volume K Unit Forecast, by Country 2019 & 2032
- Table 37: Germany Lyophilization Equipment and Services Industry Revenue (Million) Forecast, by Application 2019 & 2032
- Table 38: Germany Lyophilization Equipment and Services Industry Volume (K Unit) Forecast, by Application 2019 & 2032
- Table 39: United Kingdom Lyophilization Equipment and Services Industry Revenue (Million) Forecast, by Application 2019 & 2032
- Table 40: United Kingdom Lyophilization Equipment and Services Industry Volume (K Unit) Forecast, by Application 2019 & 2032
- Table 41: France Lyophilization Equipment and Services Industry Revenue (Million) Forecast, by Application 2019 & 2032
- Table 42: France Lyophilization Equipment and Services Industry Volume (K Unit) Forecast, by Application 2019 & 2032
- Table 43: Italy Lyophilization Equipment and Services Industry Revenue (Million) Forecast, by Application 2019 & 2032
- Table 44: Italy Lyophilization Equipment and Services Industry Volume (K Unit) Forecast, by Application 2019 & 2032
- Table 45: Spain Lyophilization Equipment and Services Industry Revenue (Million) Forecast, by Application 2019 & 2032
- Table 46: Spain Lyophilization Equipment and Services Industry Volume (K Unit) Forecast, by Application 2019 & 2032
- Table 47: Rest of Europe Lyophilization Equipment and Services Industry Revenue (Million) Forecast, by Application 2019 & 2032
- Table 48: Rest of Europe Lyophilization Equipment and Services Industry Volume (K Unit) Forecast, by Application 2019 & 2032
- Table 49: Global Lyophilization Equipment and Services Industry Revenue Million Forecast, by Modality 2019 & 2032
- Table 50: Global Lyophilization Equipment and Services Industry Volume K Unit Forecast, by Modality 2019 & 2032
- Table 51: Global Lyophilization Equipment and Services Industry Revenue Million Forecast, by Application 2019 & 2032
- Table 52: Global Lyophilization Equipment and Services Industry Volume K Unit Forecast, by Application 2019 & 2032
- Table 53: Global Lyophilization Equipment and Services Industry Revenue Million Forecast, by Country 2019 & 2032
- Table 54: Global Lyophilization Equipment and Services Industry Volume K Unit Forecast, by Country 2019 & 2032
- Table 55: China Lyophilization Equipment and Services Industry Revenue (Million) Forecast, by Application 2019 & 2032
- Table 56: China Lyophilization Equipment and Services Industry Volume (K Unit) Forecast, by Application 2019 & 2032
- Table 57: Japan Lyophilization Equipment and Services Industry Revenue (Million) Forecast, by Application 2019 & 2032
- Table 58: Japan Lyophilization Equipment and Services Industry Volume (K Unit) Forecast, by Application 2019 & 2032
- Table 59: India Lyophilization Equipment and Services Industry Revenue (Million) Forecast, by Application 2019 & 2032
- Table 60: India Lyophilization Equipment and Services Industry Volume (K Unit) Forecast, by Application 2019 & 2032
- Table 61: Australia Lyophilization Equipment and Services Industry Revenue (Million) Forecast, by Application 2019 & 2032
- Table 62: Australia Lyophilization Equipment and Services Industry Volume (K Unit) Forecast, by Application 2019 & 2032
- Table 63: South Korea Lyophilization Equipment and Services Industry Revenue (Million) Forecast, by Application 2019 & 2032
- Table 64: South Korea Lyophilization Equipment and Services Industry Volume (K Unit) Forecast, by Application 2019 & 2032
- Table 65: Rest of Asia Pacific Lyophilization Equipment and Services Industry Revenue (Million) Forecast, by Application 2019 & 2032
- Table 66: Rest of Asia Pacific Lyophilization Equipment and Services Industry Volume (K Unit) Forecast, by Application 2019 & 2032
- Table 67: Global Lyophilization Equipment and Services Industry Revenue Million Forecast, by Modality 2019 & 2032
- Table 68: Global Lyophilization Equipment and Services Industry Volume K Unit Forecast, by Modality 2019 & 2032
- Table 69: Global Lyophilization Equipment and Services Industry Revenue Million Forecast, by Application 2019 & 2032
- Table 70: Global Lyophilization Equipment and Services Industry Volume K Unit Forecast, by Application 2019 & 2032
- Table 71: Global Lyophilization Equipment and Services Industry Revenue Million Forecast, by Country 2019 & 2032
- Table 72: Global Lyophilization Equipment and Services Industry Volume K Unit Forecast, by Country 2019 & 2032
- Table 73: GCC Lyophilization Equipment and Services Industry Revenue (Million) Forecast, by Application 2019 & 2032
- Table 74: GCC Lyophilization Equipment and Services Industry Volume (K Unit) Forecast, by Application 2019 & 2032
- Table 75: South Africa Lyophilization Equipment and Services Industry Revenue (Million) Forecast, by Application 2019 & 2032
- Table 76: South Africa Lyophilization Equipment and Services Industry Volume (K Unit) Forecast, by Application 2019 & 2032
- Table 77: Rest of Middle East and Africa Lyophilization Equipment and Services Industry Revenue (Million) Forecast, by Application 2019 & 2032
- Table 78: Rest of Middle East and Africa Lyophilization Equipment and Services Industry Volume (K Unit) Forecast, by Application 2019 & 2032
- Table 79: Global Lyophilization Equipment and Services Industry Revenue Million Forecast, by Modality 2019 & 2032
- Table 80: Global Lyophilization Equipment and Services Industry Volume K Unit Forecast, by Modality 2019 & 2032
- Table 81: Global Lyophilization Equipment and Services Industry Revenue Million Forecast, by Application 2019 & 2032
- Table 82: Global Lyophilization Equipment and Services Industry Volume K Unit Forecast, by Application 2019 & 2032
- Table 83: Global Lyophilization Equipment and Services Industry Revenue Million Forecast, by Country 2019 & 2032
- Table 84: Global Lyophilization Equipment and Services Industry Volume K Unit Forecast, by Country 2019 & 2032
- Table 85: Brazil Lyophilization Equipment and Services Industry Revenue (Million) Forecast, by Application 2019 & 2032
- Table 86: Brazil Lyophilization Equipment and Services Industry Volume (K Unit) Forecast, by Application 2019 & 2032
- Table 87: Argentina Lyophilization Equipment and Services Industry Revenue (Million) Forecast, by Application 2019 & 2032
- Table 88: Argentina Lyophilization Equipment and Services Industry Volume (K Unit) Forecast, by Application 2019 & 2032
- Table 89: Rest of South America Lyophilization Equipment and Services Industry Revenue (Million) Forecast, by Application 2019 & 2032
- Table 90: Rest of South America Lyophilization Equipment and Services Industry Volume (K Unit) Forecast, by Application 2019 & 2032
Frequently Asked Questions
1. What is the projected Compound Annual Growth Rate (CAGR) of the Lyophilization Equipment and Services Industry?
The projected CAGR is approximately 8.50%.
2. Which companies are prominent players in the Lyophilization Equipment and Services Industry?
Key companies in the market include SP Industries, Tofflon Science and Technology Co Ltd, Martin Christ Gefriertrocknungsanlagen GmbH, HOF Sonderanlagenbau GmbH, ZIRBUS technology GmbH, GEA Group, Azbil Corporation (Telstar), Millrock Technology Inc, Labconco, Scala Scientific, Optima Packaging Group GmbH.
3. What are the main segments of the Lyophilization Equipment and Services Industry?
The market segments include Modality, Application.
4. Can you provide details about the market size?
The market size is estimated to be USD XX Million as of 2022.
5. What are some drivers contributing to market growth?
Rising Demand for Lyophilized Products; Technological Advancements in Lyophilization Methods.
6. What are the notable trends driving market growth?
Pharmaceutical and Biotech Manufacturing Segment is Expected to Witness Growth Over the Forecast Period.
7. Are there any restraints impacting market growth?
Increasing Utilization of Alternative Drying Techniques in the Pharmaceutical and Biotechnology Industries; High Setup and Maintenance Cost of Freeze-Drying Equipment.
8. Can you provide examples of recent developments in the market?
In November 2022, Telstar expanded the process laboratory service for freeze-drying and sterilization by incorporating cold sterilization methods for non-compatible medical and pharmaceutical products with conventional high-temperature sterilization.
9. What pricing options are available for accessing the report?
Pricing options include single-user, multi-user, and enterprise licenses priced at USD 4750, USD 5250, and USD 8750 respectively.
10. Is the market size provided in terms of value or volume?
The market size is provided in terms of value, measured in Million and volume, measured in K Unit.
11. Are there any specific market keywords associated with the report?
Yes, the market keyword associated with the report is "Lyophilization Equipment and Services Industry," which aids in identifying and referencing the specific market segment covered.
12. How do I determine which pricing option suits my needs best?
The pricing options vary based on user requirements and access needs. Individual users may opt for single-user licenses, while businesses requiring broader access may choose multi-user or enterprise licenses for cost-effective access to the report.
13. Are there any additional resources or data provided in the Lyophilization Equipment and Services Industry report?
While the report offers comprehensive insights, it's advisable to review the specific contents or supplementary materials provided to ascertain if additional resources or data are available.
14. How can I stay updated on further developments or reports in the Lyophilization Equipment and Services Industry?
To stay informed about further developments, trends, and reports in the Lyophilization Equipment and Services Industry, consider subscribing to industry newsletters, following relevant companies and organizations, or regularly checking reputable industry news sources and publications.
Methodology
Step 1 - Identification of Relevant Samples Size from Population Database


Step 2 - Approaches for Defining Global Market Size (Value, Volume* & Price*)

Note*: In applicable scenarios
Step 3 - Data Sources
Primary Research
- Web Analytics
- Survey Reports
- Research Institute
- Latest Research Reports
- Opinion Leaders
Secondary Research
- Annual Reports
- White Paper
- Latest Press Release
- Industry Association
- Paid Database
- Investor Presentations

Step 4 - Data Triangulation
Involves using different sources of information in order to increase the validity of a study
These sources are likely to be stakeholders in a program - participants, other researchers, program staff, other community members, and so on.
Then we put all data in single framework & apply various statistical tools to find out the dynamic on the market.
During the analysis stage, feedback from the stakeholder groups would be compared to determine areas of agreement as well as areas of divergence


