
Key Insights
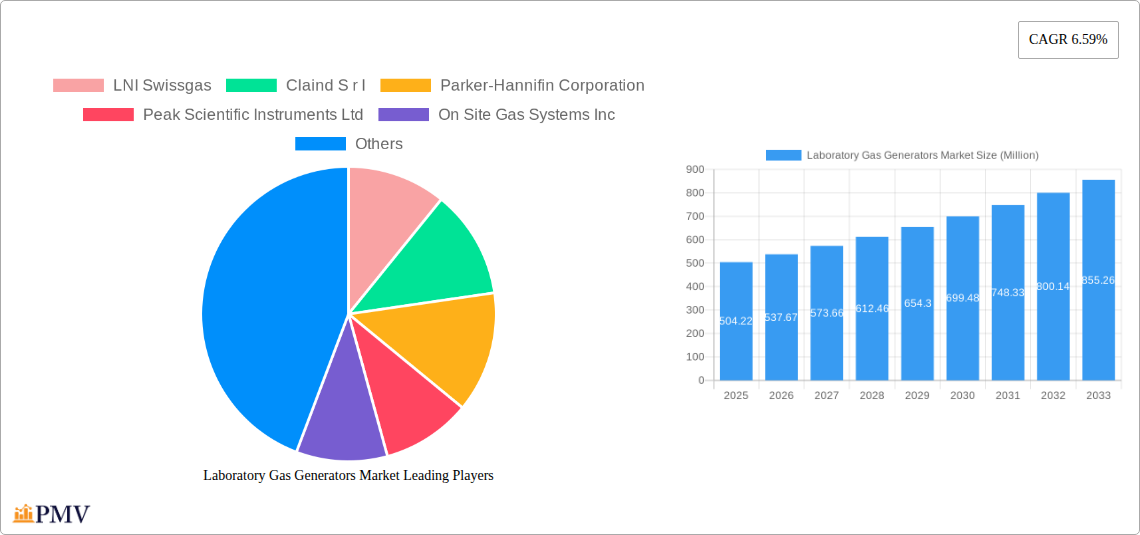
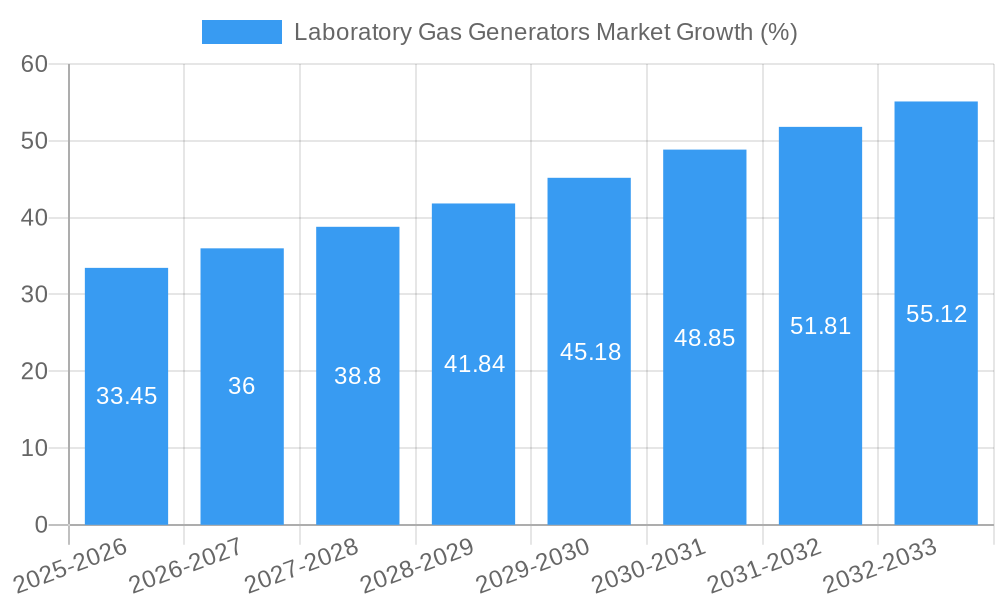
The Laboratory Gas Generators market, valued at $504.22 million in 2025, is projected to experience robust growth, driven by increasing demand from research institutions, pharmaceutical companies, and biotechnology firms. The market's Compound Annual Growth Rate (CAGR) of 6.59% from 2019 to 2024 suggests a continuous expansion, expected to persist through 2033. Key drivers include the rising adoption of gas generators in laboratories for cost savings on gas cylinder purchases, improved safety profiles compared to traditional gas cylinders, and the increasing need for high-purity gases in advanced analytical techniques such as chromatography and mass spectrometry. Market segmentation reveals that Nitrogen Gas Generators constitute a significant portion, reflecting their wide application across various laboratory settings. The Food and Beverage, Chemical & Petrochemical, and Pharmaceutical & Biotechnological sectors are the largest end-users, reflecting the critical role of high-purity gases in quality control, process optimization, and research and development activities. Geographic analysis indicates strong market presence in North America and Europe, driven by established research infrastructure and stringent regulatory frameworks. However, the Asia-Pacific region shows promising growth potential due to rapid industrialization and increasing investments in research and development. Competitive dynamics are marked by the presence of both large multinational corporations and specialized niche players, leading to innovations and technological advancements in generator designs and functionalities. Continued advancements in gas generation technology, coupled with increasing demand for environmentally friendly and cost-effective solutions, are expected to further propel market growth in the coming years.
The continued expansion of the laboratory gas generators market is fueled by several factors. The shift towards on-site gas generation reduces reliance on external suppliers, minimizing logistical challenges and ensuring a constant supply of high-purity gases. This is particularly crucial in industries with stringent quality control measures. Furthermore, the inherent safety improvements offered by gas generators, compared to the risks associated with compressed gas cylinders, contribute to their increasing adoption. Emerging economies, notably within the Asia-Pacific region, are expected to witness significant growth due to escalating investments in their research infrastructures and burgeoning pharmaceutical and biotechnology sectors. This presents lucrative opportunities for established players and new entrants alike. However, factors such as the initial high investment costs associated with gas generator installation and ongoing maintenance could potentially restrain market expansion to some extent. Therefore, companies are focusing on innovative financing models and developing user-friendly, low-maintenance systems to overcome this barrier.
Laboratory Gas Generators Market: A Comprehensive Report (2019-2033)
This in-depth report provides a comprehensive analysis of the Laboratory Gas Generators Market, covering market size, segmentation, competitive landscape, key trends, and future growth prospects. The study period spans from 2019 to 2033, with 2025 serving as the base and estimated year. The forecast period extends from 2025 to 2033, while the historical period encompasses 2019-2024. The report offers actionable insights for stakeholders across the industry, including manufacturers, distributors, researchers, and investors.
Laboratory Gas Generators Market Market Structure & Competitive Dynamics
The Laboratory Gas Generators Market exhibits a moderately consolidated structure, with several key players dominating the landscape. Market share is primarily determined by factors such as technological innovation, product portfolio breadth, geographical reach, and established customer relationships. The market's competitive dynamics are shaped by continuous product development, strategic partnerships, mergers and acquisitions (M&A), and regulatory changes. The total M&A deal value in the market over the last five years (2019-2024) is estimated at xx Million. Innovation ecosystems are characterized by collaboration between research institutions, equipment manufacturers, and end-users, driving advancements in gas generation technologies. Regulatory frameworks, particularly concerning safety and environmental standards, significantly influence market practices. Product substitutes, such as bottled gases, pose competitive challenges, while end-user trends toward automation and increased efficiency are driving demand for advanced gas generators.
- Market Concentration: Moderately concentrated, with top 5 players holding approximately xx% of the market share.
- M&A Activity: Significant activity in recent years, with an average deal value of xx Million.
- Regulatory Landscape: Stringent safety and environmental regulations influence product design and market access.
- Substitute Products: Bottled gases remain a significant competitive threat.
- Innovation Ecosystem: Strong collaboration between manufacturers, researchers, and end-users.
Laboratory Gas Generators Market Industry Trends & Insights
The Laboratory Gas Generators Market is experiencing robust growth, driven by the expanding global life sciences and industrial sectors. The Compound Annual Growth Rate (CAGR) during the forecast period (2025-2033) is projected to be xx%. Technological advancements, such as improved gas purity and enhanced system automation, are major contributors to this growth. The market penetration of advanced gas generators, particularly in emerging economies, remains relatively low, presenting significant growth opportunities. Consumer preferences are shifting towards cost-effective, compact, and environmentally friendly gas generation solutions. Competitive dynamics are intense, with companies continuously striving to enhance product offerings and expand market share through innovation and strategic initiatives.
Dominant Markets & Segments in Laboratory Gas Generators Market
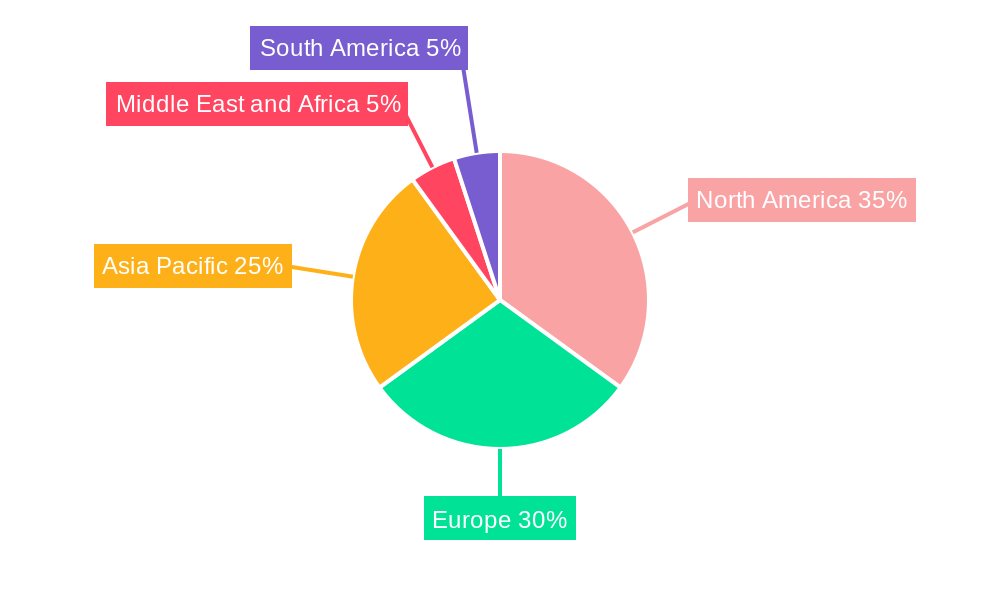
The North American region currently dominates the Laboratory Gas Generators Market, driven by the high concentration of pharmaceutical and biotechnological companies, robust research infrastructure, and favorable economic conditions. Within the segment breakdown:
- Type: Nitrogen gas generators currently hold the largest market share, followed by hydrogen and zero-air generators. The growth of the TOC gas generator segment is particularly promising due to increasing demand for high-purity gases in analytical applications.
- End-User: Pharmaceutical and biotechnological companies constitute the largest end-user segment, followed by chemical and petrochemical companies and the food and beverage sector.
Key Drivers for Dominant Regions/Segments:
North America: Strong R&D investment, advanced healthcare infrastructure, and a large pharmaceutical industry.
Europe: Significant presence of chemical and industrial companies, coupled with stringent environmental regulations.
Asia-Pacific: Rapid industrialization, expanding healthcare sector, and growing demand for advanced laboratory equipment.
Nitrogen Gas Generators: Driven by widespread use in analytical instruments and sample preparation.
Hydrogen Gas Generators: Fueled by increasing demand in gas chromatography (GC) applications.
Zero Air Generators: Driven by the need for ultra-pure air in various laboratory instruments.
TOC Gas Generators: Growing demand in environmental monitoring and water analysis.
Pharmaceutical & Biotech: High demand for high-purity gases for sensitive analytical testing.
Chemical & Petrochemical: Need for precise gas control in industrial processes.
Laboratory Gas Generators Market Product Innovations
Recent product innovations focus on enhancing gas purity, improving system reliability, and reducing operational costs. Technological trends include the integration of smart sensors for real-time monitoring, automated gas switching systems for enhanced workflow efficiency, and compact designs for space-constrained laboratories. These innovations directly address the market needs for improved accuracy, reduced maintenance, and enhanced ease of use, leading to increased adoption across diverse research and industrial settings.
Report Segmentation & Scope
The report comprehensively segments the Laboratory Gas Generators Market by type (Nitrogen Gas Generators, Hydrogen Gas Generators, Zero Air Generators, TOC Gas Generators, Other Gas Generators) and end-user (Food and Beverage Companies, Chemical and Petrochemical Companies, Pharmaceutical and Biotechnological Companies). Each segment's market size, growth projections, and competitive dynamics are detailed within the report. This segmentation allows for a granular understanding of market opportunities across various applications and industries. For example, the Nitrogen Gas Generators segment is anticipated to witness a CAGR of xx% during the forecast period, driven primarily by its widespread adoption in various laboratory analytical techniques.
Key Drivers of Laboratory Gas Generators Market Growth
The market's growth is propelled by several key factors. The expanding life sciences industry and increasing demand for advanced analytical techniques fuel the need for high-purity gases. Stringent regulatory requirements for accurate and reliable testing further drive market growth. Technological advancements, such as miniaturization and improved gas purification techniques, enhance the efficiency and cost-effectiveness of laboratory gas generators, further stimulating market expansion.
Challenges in the Laboratory Gas Generators Market Sector
Despite positive growth prospects, the market faces certain challenges. Fluctuations in raw material prices can impact production costs and profitability. The competitive landscape, characterized by numerous established players and emerging competitors, creates pressure on pricing and margins. Stringent safety regulations and environmental concerns add to the complexity of operations and compliance costs. Additionally, the ongoing supply chain disruptions can lead to production bottlenecks.
Leading Players in the Laboratory Gas Generators Market Market
- LNI Swissgas
- Claind S r l
- Parker-Hannifin Corporation
- Peak Scientific Instruments Ltd
- On Site Gas Systems Inc
- Oxymat A/S
- Isolcell S p A
- ErreDue spa
- Linde Plc (Praxair Technology Inc)
- F-Dgsi
- Valco Instruments Company Inc (VICI DBS SRL)
- Labtech S R L
- Nel ASA
Key Developments in Laboratory Gas Generators Market Sector
- June 2022: LNI launched its new product, the HG MINI hydrogen generator, featuring an innovative static drying system that ensures maximum hydrogen purity.
- March 2022: PEAK Scientific expanded its manufacturing facilities in Glasgow, increasing production capacity and creating new employment opportunities.
Strategic Laboratory Gas Generators Market Market Outlook
The future of the Laboratory Gas Generators Market appears promising, driven by continued innovation, increasing demand from key industries, and expanding geographic reach. Strategic opportunities exist for companies that can leverage technological advancements, establish strong distribution networks, and cater to the growing needs of emerging economies. Focus on developing sustainable and environmentally friendly solutions will also be crucial for long-term success in this dynamic market.
Laboratory Gas Generators Market Segmentation
-
1. Type
- 1.1. Nitrogen Gas Generators
- 1.2. Hydrogen Gas Generators
- 1.3. Zero Air Generators
- 1.4. TOC Gas Generators
- 1.5. Other Gas Generators
-
2. End User
- 2.1. Food and Beverage Companies
- 2.2. Chemical and Petrochemical Companies
- 2.3. Pharmaceutical and Biotechnological Companies
Laboratory Gas Generators Market Segmentation By Geography
-
1. North America
- 1.1. United States
- 1.2. Canada
- 1.3. Mexico
-
2. Europe
- 2.1. Germany
- 2.2. United Kingdom
- 2.3. France
- 2.4. Italy
- 2.5. Spain
- 2.6. Rest of Europe
-
3. Asia Pacific
- 3.1. China
- 3.2. Japan
- 3.3. India
- 3.4. Australia
- 3.5. South Korea
- 3.6. Rest of Asia Pacific
-
4. Middle East and Africa
- 4.1. GCC
- 4.2. South Africa
- 4.3. Rest of Middle East and Africa
-
5. South America
- 5.1. Brazil
- 5.2. Argentina
- 5.3. Rest of South America
Laboratory Gas Generators Market REPORT HIGHLIGHTS
| Aspects | Details |
|---|---|
| Study Period | 2019-2033 |
| Base Year | 2024 |
| Estimated Year | 2025 |
| Forecast Period | 2025-2033 |
| Historical Period | 2019-2024 |
| Growth Rate | CAGR of 6.59% from 2019-2033 |
| Segmentation |
|
Table of Contents
- 1. Introduction
- 1.1. Research Scope
- 1.2. Market Segmentation
- 1.3. Research Methodology
- 1.4. Definitions and Assumptions
- 2. Executive Summary
- 2.1. Introduction
- 3. Market Dynamics
- 3.1. Introduction
- 3.2. Market Drivers
- 3.2.1. Rising Safety Concerns Related to the Use of Conventional Gas Cylinders; Growing Importance of Analytical Techniques in Drug and Food Approval Processes; Increasing R&D Spending in Target Industries
- 3.3. Market Restrains
- 3.3.1. Reluctance to Replace Conventional Gas Supply Methods; Lack of Skilled Personnel
- 3.4. Market Trends
- 3.4.1. Nitrogen Gas Generators is Expected to Hold Significant Share in the Market Over the Forecast Period
- 4. Market Factor Analysis
- 4.1. Porters Five Forces
- 4.2. Supply/Value Chain
- 4.3. PESTEL analysis
- 4.4. Market Entropy
- 4.5. Patent/Trademark Analysis
- 5. Global Laboratory Gas Generators Market Analysis, Insights and Forecast, 2019-2031
- 5.1. Market Analysis, Insights and Forecast - by Type
- 5.1.1. Nitrogen Gas Generators
- 5.1.2. Hydrogen Gas Generators
- 5.1.3. Zero Air Generators
- 5.1.4. TOC Gas Generators
- 5.1.5. Other Gas Generators
- 5.2. Market Analysis, Insights and Forecast - by End User
- 5.2.1. Food and Beverage Companies
- 5.2.2. Chemical and Petrochemical Companies
- 5.2.3. Pharmaceutical and Biotechnological Companies
- 5.3. Market Analysis, Insights and Forecast - by Region
- 5.3.1. North America
- 5.3.2. Europe
- 5.3.3. Asia Pacific
- 5.3.4. Middle East and Africa
- 5.3.5. South America
- 5.1. Market Analysis, Insights and Forecast - by Type
- 6. North America Laboratory Gas Generators Market Analysis, Insights and Forecast, 2019-2031
- 6.1. Market Analysis, Insights and Forecast - by Type
- 6.1.1. Nitrogen Gas Generators
- 6.1.2. Hydrogen Gas Generators
- 6.1.3. Zero Air Generators
- 6.1.4. TOC Gas Generators
- 6.1.5. Other Gas Generators
- 6.2. Market Analysis, Insights and Forecast - by End User
- 6.2.1. Food and Beverage Companies
- 6.2.2. Chemical and Petrochemical Companies
- 6.2.3. Pharmaceutical and Biotechnological Companies
- 6.1. Market Analysis, Insights and Forecast - by Type
- 7. Europe Laboratory Gas Generators Market Analysis, Insights and Forecast, 2019-2031
- 7.1. Market Analysis, Insights and Forecast - by Type
- 7.1.1. Nitrogen Gas Generators
- 7.1.2. Hydrogen Gas Generators
- 7.1.3. Zero Air Generators
- 7.1.4. TOC Gas Generators
- 7.1.5. Other Gas Generators
- 7.2. Market Analysis, Insights and Forecast - by End User
- 7.2.1. Food and Beverage Companies
- 7.2.2. Chemical and Petrochemical Companies
- 7.2.3. Pharmaceutical and Biotechnological Companies
- 7.1. Market Analysis, Insights and Forecast - by Type
- 8. Asia Pacific Laboratory Gas Generators Market Analysis, Insights and Forecast, 2019-2031
- 8.1. Market Analysis, Insights and Forecast - by Type
- 8.1.1. Nitrogen Gas Generators
- 8.1.2. Hydrogen Gas Generators
- 8.1.3. Zero Air Generators
- 8.1.4. TOC Gas Generators
- 8.1.5. Other Gas Generators
- 8.2. Market Analysis, Insights and Forecast - by End User
- 8.2.1. Food and Beverage Companies
- 8.2.2. Chemical and Petrochemical Companies
- 8.2.3. Pharmaceutical and Biotechnological Companies
- 8.1. Market Analysis, Insights and Forecast - by Type
- 9. Middle East and Africa Laboratory Gas Generators Market Analysis, Insights and Forecast, 2019-2031
- 9.1. Market Analysis, Insights and Forecast - by Type
- 9.1.1. Nitrogen Gas Generators
- 9.1.2. Hydrogen Gas Generators
- 9.1.3. Zero Air Generators
- 9.1.4. TOC Gas Generators
- 9.1.5. Other Gas Generators
- 9.2. Market Analysis, Insights and Forecast - by End User
- 9.2.1. Food and Beverage Companies
- 9.2.2. Chemical and Petrochemical Companies
- 9.2.3. Pharmaceutical and Biotechnological Companies
- 9.1. Market Analysis, Insights and Forecast - by Type
- 10. South America Laboratory Gas Generators Market Analysis, Insights and Forecast, 2019-2031
- 10.1. Market Analysis, Insights and Forecast - by Type
- 10.1.1. Nitrogen Gas Generators
- 10.1.2. Hydrogen Gas Generators
- 10.1.3. Zero Air Generators
- 10.1.4. TOC Gas Generators
- 10.1.5. Other Gas Generators
- 10.2. Market Analysis, Insights and Forecast - by End User
- 10.2.1. Food and Beverage Companies
- 10.2.2. Chemical and Petrochemical Companies
- 10.2.3. Pharmaceutical and Biotechnological Companies
- 10.1. Market Analysis, Insights and Forecast - by Type
- 11. North America Laboratory Gas Generators Market Analysis, Insights and Forecast, 2019-2031
- 11.1. Market Analysis, Insights and Forecast - By Country/Sub-region
- 11.1.1 United States
- 11.1.2 Canada
- 11.1.3 Mexico
- 12. Europe Laboratory Gas Generators Market Analysis, Insights and Forecast, 2019-2031
- 12.1. Market Analysis, Insights and Forecast - By Country/Sub-region
- 12.1.1 Germany
- 12.1.2 United Kingdom
- 12.1.3 France
- 12.1.4 Italy
- 12.1.5 Spain
- 12.1.6 Rest of Europe
- 13. Asia Pacific Laboratory Gas Generators Market Analysis, Insights and Forecast, 2019-2031
- 13.1. Market Analysis, Insights and Forecast - By Country/Sub-region
- 13.1.1 China
- 13.1.2 Japan
- 13.1.3 India
- 13.1.4 Australia
- 13.1.5 South Korea
- 13.1.6 Rest of Asia Pacific
- 14. Middle East and Africa Laboratory Gas Generators Market Analysis, Insights and Forecast, 2019-2031
- 14.1. Market Analysis, Insights and Forecast - By Country/Sub-region
- 14.1.1 GCC
- 14.1.2 South Africa
- 14.1.3 Rest of Middle East and Africa
- 15. South America Laboratory Gas Generators Market Analysis, Insights and Forecast, 2019-2031
- 15.1. Market Analysis, Insights and Forecast - By Country/Sub-region
- 15.1.1 Brazil
- 15.1.2 Argentina
- 15.1.3 Rest of South America
- 16. Competitive Analysis
- 16.1. Global Market Share Analysis 2024
- 16.2. Company Profiles
- 16.2.1 LNI Swissgas
- 16.2.1.1. Overview
- 16.2.1.2. Products
- 16.2.1.3. SWOT Analysis
- 16.2.1.4. Recent Developments
- 16.2.1.5. Financials (Based on Availability)
- 16.2.2 Claind S r l
- 16.2.2.1. Overview
- 16.2.2.2. Products
- 16.2.2.3. SWOT Analysis
- 16.2.2.4. Recent Developments
- 16.2.2.5. Financials (Based on Availability)
- 16.2.3 Parker-Hannifin Corporation
- 16.2.3.1. Overview
- 16.2.3.2. Products
- 16.2.3.3. SWOT Analysis
- 16.2.3.4. Recent Developments
- 16.2.3.5. Financials (Based on Availability)
- 16.2.4 Peak Scientific Instruments Ltd
- 16.2.4.1. Overview
- 16.2.4.2. Products
- 16.2.4.3. SWOT Analysis
- 16.2.4.4. Recent Developments
- 16.2.4.5. Financials (Based on Availability)
- 16.2.5 On Site Gas Systems Inc
- 16.2.5.1. Overview
- 16.2.5.2. Products
- 16.2.5.3. SWOT Analysis
- 16.2.5.4. Recent Developments
- 16.2.5.5. Financials (Based on Availability)
- 16.2.6 Oxymat A/S*List Not Exhaustive
- 16.2.6.1. Overview
- 16.2.6.2. Products
- 16.2.6.3. SWOT Analysis
- 16.2.6.4. Recent Developments
- 16.2.6.5. Financials (Based on Availability)
- 16.2.7 Isolcell S p A
- 16.2.7.1. Overview
- 16.2.7.2. Products
- 16.2.7.3. SWOT Analysis
- 16.2.7.4. Recent Developments
- 16.2.7.5. Financials (Based on Availability)
- 16.2.8 ErreDue spa
- 16.2.8.1. Overview
- 16.2.8.2. Products
- 16.2.8.3. SWOT Analysis
- 16.2.8.4. Recent Developments
- 16.2.8.5. Financials (Based on Availability)
- 16.2.9 Linde Plc (Praxair Technology Inc )
- 16.2.9.1. Overview
- 16.2.9.2. Products
- 16.2.9.3. SWOT Analysis
- 16.2.9.4. Recent Developments
- 16.2.9.5. Financials (Based on Availability)
- 16.2.10 F-Dgsi
- 16.2.10.1. Overview
- 16.2.10.2. Products
- 16.2.10.3. SWOT Analysis
- 16.2.10.4. Recent Developments
- 16.2.10.5. Financials (Based on Availability)
- 16.2.11 Valco InstrumenValco Instruments Company Inc (VICI DBS SRL)
- 16.2.11.1. Overview
- 16.2.11.2. Products
- 16.2.11.3. SWOT Analysis
- 16.2.11.4. Recent Developments
- 16.2.11.5. Financials (Based on Availability)
- 16.2.12 Labtech S R L
- 16.2.12.1. Overview
- 16.2.12.2. Products
- 16.2.12.3. SWOT Analysis
- 16.2.12.4. Recent Developments
- 16.2.12.5. Financials (Based on Availability)
- 16.2.13 Nel ASA
- 16.2.13.1. Overview
- 16.2.13.2. Products
- 16.2.13.3. SWOT Analysis
- 16.2.13.4. Recent Developments
- 16.2.13.5. Financials (Based on Availability)
- 16.2.1 LNI Swissgas
List of Figures
- Figure 1: Global Laboratory Gas Generators Market Revenue Breakdown (Million, %) by Region 2024 & 2032
- Figure 2: North America Laboratory Gas Generators Market Revenue (Million), by Country 2024 & 2032
- Figure 3: North America Laboratory Gas Generators Market Revenue Share (%), by Country 2024 & 2032
- Figure 4: Europe Laboratory Gas Generators Market Revenue (Million), by Country 2024 & 2032
- Figure 5: Europe Laboratory Gas Generators Market Revenue Share (%), by Country 2024 & 2032
- Figure 6: Asia Pacific Laboratory Gas Generators Market Revenue (Million), by Country 2024 & 2032
- Figure 7: Asia Pacific Laboratory Gas Generators Market Revenue Share (%), by Country 2024 & 2032
- Figure 8: Middle East and Africa Laboratory Gas Generators Market Revenue (Million), by Country 2024 & 2032
- Figure 9: Middle East and Africa Laboratory Gas Generators Market Revenue Share (%), by Country 2024 & 2032
- Figure 10: South America Laboratory Gas Generators Market Revenue (Million), by Country 2024 & 2032
- Figure 11: South America Laboratory Gas Generators Market Revenue Share (%), by Country 2024 & 2032
- Figure 12: North America Laboratory Gas Generators Market Revenue (Million), by Type 2024 & 2032
- Figure 13: North America Laboratory Gas Generators Market Revenue Share (%), by Type 2024 & 2032
- Figure 14: North America Laboratory Gas Generators Market Revenue (Million), by End User 2024 & 2032
- Figure 15: North America Laboratory Gas Generators Market Revenue Share (%), by End User 2024 & 2032
- Figure 16: North America Laboratory Gas Generators Market Revenue (Million), by Country 2024 & 2032
- Figure 17: North America Laboratory Gas Generators Market Revenue Share (%), by Country 2024 & 2032
- Figure 18: Europe Laboratory Gas Generators Market Revenue (Million), by Type 2024 & 2032
- Figure 19: Europe Laboratory Gas Generators Market Revenue Share (%), by Type 2024 & 2032
- Figure 20: Europe Laboratory Gas Generators Market Revenue (Million), by End User 2024 & 2032
- Figure 21: Europe Laboratory Gas Generators Market Revenue Share (%), by End User 2024 & 2032
- Figure 22: Europe Laboratory Gas Generators Market Revenue (Million), by Country 2024 & 2032
- Figure 23: Europe Laboratory Gas Generators Market Revenue Share (%), by Country 2024 & 2032
- Figure 24: Asia Pacific Laboratory Gas Generators Market Revenue (Million), by Type 2024 & 2032
- Figure 25: Asia Pacific Laboratory Gas Generators Market Revenue Share (%), by Type 2024 & 2032
- Figure 26: Asia Pacific Laboratory Gas Generators Market Revenue (Million), by End User 2024 & 2032
- Figure 27: Asia Pacific Laboratory Gas Generators Market Revenue Share (%), by End User 2024 & 2032
- Figure 28: Asia Pacific Laboratory Gas Generators Market Revenue (Million), by Country 2024 & 2032
- Figure 29: Asia Pacific Laboratory Gas Generators Market Revenue Share (%), by Country 2024 & 2032
- Figure 30: Middle East and Africa Laboratory Gas Generators Market Revenue (Million), by Type 2024 & 2032
- Figure 31: Middle East and Africa Laboratory Gas Generators Market Revenue Share (%), by Type 2024 & 2032
- Figure 32: Middle East and Africa Laboratory Gas Generators Market Revenue (Million), by End User 2024 & 2032
- Figure 33: Middle East and Africa Laboratory Gas Generators Market Revenue Share (%), by End User 2024 & 2032
- Figure 34: Middle East and Africa Laboratory Gas Generators Market Revenue (Million), by Country 2024 & 2032
- Figure 35: Middle East and Africa Laboratory Gas Generators Market Revenue Share (%), by Country 2024 & 2032
- Figure 36: South America Laboratory Gas Generators Market Revenue (Million), by Type 2024 & 2032
- Figure 37: South America Laboratory Gas Generators Market Revenue Share (%), by Type 2024 & 2032
- Figure 38: South America Laboratory Gas Generators Market Revenue (Million), by End User 2024 & 2032
- Figure 39: South America Laboratory Gas Generators Market Revenue Share (%), by End User 2024 & 2032
- Figure 40: South America Laboratory Gas Generators Market Revenue (Million), by Country 2024 & 2032
- Figure 41: South America Laboratory Gas Generators Market Revenue Share (%), by Country 2024 & 2032
List of Tables
- Table 1: Global Laboratory Gas Generators Market Revenue Million Forecast, by Region 2019 & 2032
- Table 2: Global Laboratory Gas Generators Market Revenue Million Forecast, by Type 2019 & 2032
- Table 3: Global Laboratory Gas Generators Market Revenue Million Forecast, by End User 2019 & 2032
- Table 4: Global Laboratory Gas Generators Market Revenue Million Forecast, by Region 2019 & 2032
- Table 5: Global Laboratory Gas Generators Market Revenue Million Forecast, by Country 2019 & 2032
- Table 6: United States Laboratory Gas Generators Market Revenue (Million) Forecast, by Application 2019 & 2032
- Table 7: Canada Laboratory Gas Generators Market Revenue (Million) Forecast, by Application 2019 & 2032
- Table 8: Mexico Laboratory Gas Generators Market Revenue (Million) Forecast, by Application 2019 & 2032
- Table 9: Global Laboratory Gas Generators Market Revenue Million Forecast, by Country 2019 & 2032
- Table 10: Germany Laboratory Gas Generators Market Revenue (Million) Forecast, by Application 2019 & 2032
- Table 11: United Kingdom Laboratory Gas Generators Market Revenue (Million) Forecast, by Application 2019 & 2032
- Table 12: France Laboratory Gas Generators Market Revenue (Million) Forecast, by Application 2019 & 2032
- Table 13: Italy Laboratory Gas Generators Market Revenue (Million) Forecast, by Application 2019 & 2032
- Table 14: Spain Laboratory Gas Generators Market Revenue (Million) Forecast, by Application 2019 & 2032
- Table 15: Rest of Europe Laboratory Gas Generators Market Revenue (Million) Forecast, by Application 2019 & 2032
- Table 16: Global Laboratory Gas Generators Market Revenue Million Forecast, by Country 2019 & 2032
- Table 17: China Laboratory Gas Generators Market Revenue (Million) Forecast, by Application 2019 & 2032
- Table 18: Japan Laboratory Gas Generators Market Revenue (Million) Forecast, by Application 2019 & 2032
- Table 19: India Laboratory Gas Generators Market Revenue (Million) Forecast, by Application 2019 & 2032
- Table 20: Australia Laboratory Gas Generators Market Revenue (Million) Forecast, by Application 2019 & 2032
- Table 21: South Korea Laboratory Gas Generators Market Revenue (Million) Forecast, by Application 2019 & 2032
- Table 22: Rest of Asia Pacific Laboratory Gas Generators Market Revenue (Million) Forecast, by Application 2019 & 2032
- Table 23: Global Laboratory Gas Generators Market Revenue Million Forecast, by Country 2019 & 2032
- Table 24: GCC Laboratory Gas Generators Market Revenue (Million) Forecast, by Application 2019 & 2032
- Table 25: South Africa Laboratory Gas Generators Market Revenue (Million) Forecast, by Application 2019 & 2032
- Table 26: Rest of Middle East and Africa Laboratory Gas Generators Market Revenue (Million) Forecast, by Application 2019 & 2032
- Table 27: Global Laboratory Gas Generators Market Revenue Million Forecast, by Country 2019 & 2032
- Table 28: Brazil Laboratory Gas Generators Market Revenue (Million) Forecast, by Application 2019 & 2032
- Table 29: Argentina Laboratory Gas Generators Market Revenue (Million) Forecast, by Application 2019 & 2032
- Table 30: Rest of South America Laboratory Gas Generators Market Revenue (Million) Forecast, by Application 2019 & 2032
- Table 31: Global Laboratory Gas Generators Market Revenue Million Forecast, by Type 2019 & 2032
- Table 32: Global Laboratory Gas Generators Market Revenue Million Forecast, by End User 2019 & 2032
- Table 33: Global Laboratory Gas Generators Market Revenue Million Forecast, by Country 2019 & 2032
- Table 34: United States Laboratory Gas Generators Market Revenue (Million) Forecast, by Application 2019 & 2032
- Table 35: Canada Laboratory Gas Generators Market Revenue (Million) Forecast, by Application 2019 & 2032
- Table 36: Mexico Laboratory Gas Generators Market Revenue (Million) Forecast, by Application 2019 & 2032
- Table 37: Global Laboratory Gas Generators Market Revenue Million Forecast, by Type 2019 & 2032
- Table 38: Global Laboratory Gas Generators Market Revenue Million Forecast, by End User 2019 & 2032
- Table 39: Global Laboratory Gas Generators Market Revenue Million Forecast, by Country 2019 & 2032
- Table 40: Germany Laboratory Gas Generators Market Revenue (Million) Forecast, by Application 2019 & 2032
- Table 41: United Kingdom Laboratory Gas Generators Market Revenue (Million) Forecast, by Application 2019 & 2032
- Table 42: France Laboratory Gas Generators Market Revenue (Million) Forecast, by Application 2019 & 2032
- Table 43: Italy Laboratory Gas Generators Market Revenue (Million) Forecast, by Application 2019 & 2032
- Table 44: Spain Laboratory Gas Generators Market Revenue (Million) Forecast, by Application 2019 & 2032
- Table 45: Rest of Europe Laboratory Gas Generators Market Revenue (Million) Forecast, by Application 2019 & 2032
- Table 46: Global Laboratory Gas Generators Market Revenue Million Forecast, by Type 2019 & 2032
- Table 47: Global Laboratory Gas Generators Market Revenue Million Forecast, by End User 2019 & 2032
- Table 48: Global Laboratory Gas Generators Market Revenue Million Forecast, by Country 2019 & 2032
- Table 49: China Laboratory Gas Generators Market Revenue (Million) Forecast, by Application 2019 & 2032
- Table 50: Japan Laboratory Gas Generators Market Revenue (Million) Forecast, by Application 2019 & 2032
- Table 51: India Laboratory Gas Generators Market Revenue (Million) Forecast, by Application 2019 & 2032
- Table 52: Australia Laboratory Gas Generators Market Revenue (Million) Forecast, by Application 2019 & 2032
- Table 53: South Korea Laboratory Gas Generators Market Revenue (Million) Forecast, by Application 2019 & 2032
- Table 54: Rest of Asia Pacific Laboratory Gas Generators Market Revenue (Million) Forecast, by Application 2019 & 2032
- Table 55: Global Laboratory Gas Generators Market Revenue Million Forecast, by Type 2019 & 2032
- Table 56: Global Laboratory Gas Generators Market Revenue Million Forecast, by End User 2019 & 2032
- Table 57: Global Laboratory Gas Generators Market Revenue Million Forecast, by Country 2019 & 2032
- Table 58: GCC Laboratory Gas Generators Market Revenue (Million) Forecast, by Application 2019 & 2032
- Table 59: South Africa Laboratory Gas Generators Market Revenue (Million) Forecast, by Application 2019 & 2032
- Table 60: Rest of Middle East and Africa Laboratory Gas Generators Market Revenue (Million) Forecast, by Application 2019 & 2032
- Table 61: Global Laboratory Gas Generators Market Revenue Million Forecast, by Type 2019 & 2032
- Table 62: Global Laboratory Gas Generators Market Revenue Million Forecast, by End User 2019 & 2032
- Table 63: Global Laboratory Gas Generators Market Revenue Million Forecast, by Country 2019 & 2032
- Table 64: Brazil Laboratory Gas Generators Market Revenue (Million) Forecast, by Application 2019 & 2032
- Table 65: Argentina Laboratory Gas Generators Market Revenue (Million) Forecast, by Application 2019 & 2032
- Table 66: Rest of South America Laboratory Gas Generators Market Revenue (Million) Forecast, by Application 2019 & 2032
Frequently Asked Questions
1. What is the projected Compound Annual Growth Rate (CAGR) of the Laboratory Gas Generators Market?
The projected CAGR is approximately 6.59%.
2. Which companies are prominent players in the Laboratory Gas Generators Market?
Key companies in the market include LNI Swissgas, Claind S r l, Parker-Hannifin Corporation, Peak Scientific Instruments Ltd, On Site Gas Systems Inc, Oxymat A/S*List Not Exhaustive, Isolcell S p A, ErreDue spa, Linde Plc (Praxair Technology Inc ), F-Dgsi, Valco InstrumenValco Instruments Company Inc (VICI DBS SRL), Labtech S R L, Nel ASA.
3. What are the main segments of the Laboratory Gas Generators Market?
The market segments include Type, End User.
4. Can you provide details about the market size?
The market size is estimated to be USD 504.22 Million as of 2022.
5. What are some drivers contributing to market growth?
Rising Safety Concerns Related to the Use of Conventional Gas Cylinders; Growing Importance of Analytical Techniques in Drug and Food Approval Processes; Increasing R&D Spending in Target Industries.
6. What are the notable trends driving market growth?
Nitrogen Gas Generators is Expected to Hold Significant Share in the Market Over the Forecast Period.
7. Are there any restraints impacting market growth?
Reluctance to Replace Conventional Gas Supply Methods; Lack of Skilled Personnel.
8. Can you provide examples of recent developments in the market?
June 2022- LNI launched its new product, the HG MINI hydrogen generator. It has an innovative static drying system that ensures the maximum grade of hydrogen purity and protects the GC with its humidity safeguard.
9. What pricing options are available for accessing the report?
Pricing options include single-user, multi-user, and enterprise licenses priced at USD 4750, USD 5250, and USD 8750 respectively.
10. Is the market size provided in terms of value or volume?
The market size is provided in terms of value, measured in Million.
11. Are there any specific market keywords associated with the report?
Yes, the market keyword associated with the report is "Laboratory Gas Generators Market," which aids in identifying and referencing the specific market segment covered.
12. How do I determine which pricing option suits my needs best?
The pricing options vary based on user requirements and access needs. Individual users may opt for single-user licenses, while businesses requiring broader access may choose multi-user or enterprise licenses for cost-effective access to the report.
13. Are there any additional resources or data provided in the Laboratory Gas Generators Market report?
While the report offers comprehensive insights, it's advisable to review the specific contents or supplementary materials provided to ascertain if additional resources or data are available.
14. How can I stay updated on further developments or reports in the Laboratory Gas Generators Market?
To stay informed about further developments, trends, and reports in the Laboratory Gas Generators Market, consider subscribing to industry newsletters, following relevant companies and organizations, or regularly checking reputable industry news sources and publications.
Methodology
Step 1 - Identification of Relevant Samples Size from Population Database


Step 2 - Approaches for Defining Global Market Size (Value, Volume* & Price*)

Note*: In applicable scenarios
Step 3 - Data Sources
Primary Research
- Web Analytics
- Survey Reports
- Research Institute
- Latest Research Reports
- Opinion Leaders
Secondary Research
- Annual Reports
- White Paper
- Latest Press Release
- Industry Association
- Paid Database
- Investor Presentations

Step 4 - Data Triangulation
Involves using different sources of information in order to increase the validity of a study
These sources are likely to be stakeholders in a program - participants, other researchers, program staff, other community members, and so on.
Then we put all data in single framework & apply various statistical tools to find out the dynamic on the market.
During the analysis stage, feedback from the stakeholder groups would be compared to determine areas of agreement as well as areas of divergence


