
Key Insights
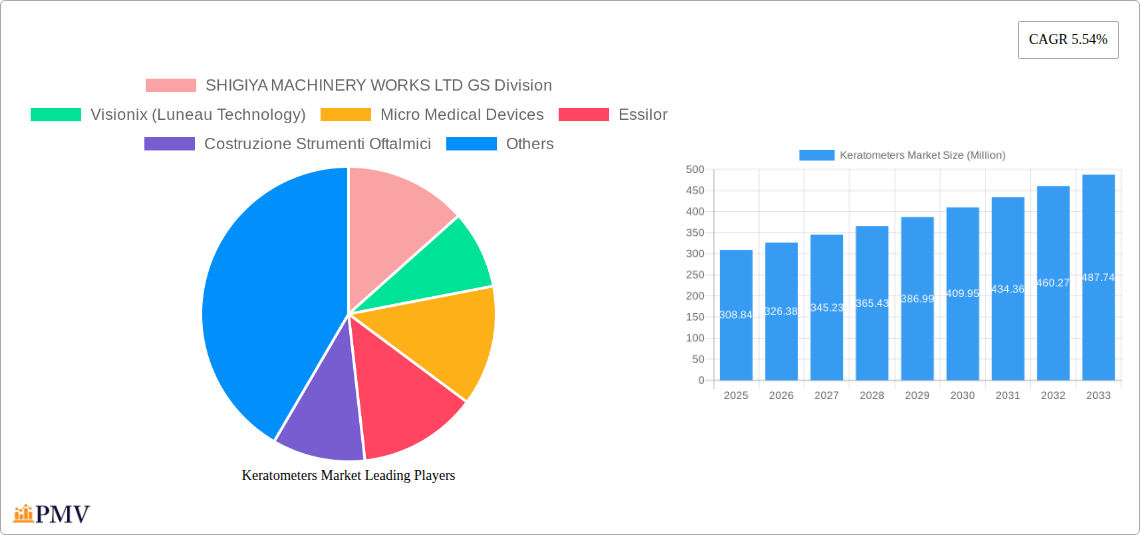
The global keratometers market, valued at $308.84 million in 2025, is projected to experience robust growth, driven by several key factors. The increasing prevalence of refractive errors like myopia and hyperopia, coupled with rising awareness about eye health and the demand for precise diagnostic tools, fuels market expansion. Technological advancements leading to the development of more accurate, portable, and user-friendly keratometers are also significantly contributing to market growth. The integration of automated features and sophisticated imaging capabilities enhances diagnostic precision, attracting ophthalmologists and optometrists. Growth is further fueled by the expanding healthcare infrastructure, particularly in developing economies, leading to increased accessibility of advanced diagnostic equipment. The market is segmented by type (stationary and portable) and end-user (hospitals, eye clinics, and others), with portable keratometers gaining traction due to their convenience and portability. Leading market players such as Topcon, Nidek, and Zeiss are investing in research and development, as well as strategic partnerships and acquisitions, to solidify their market positions and introduce innovative products.
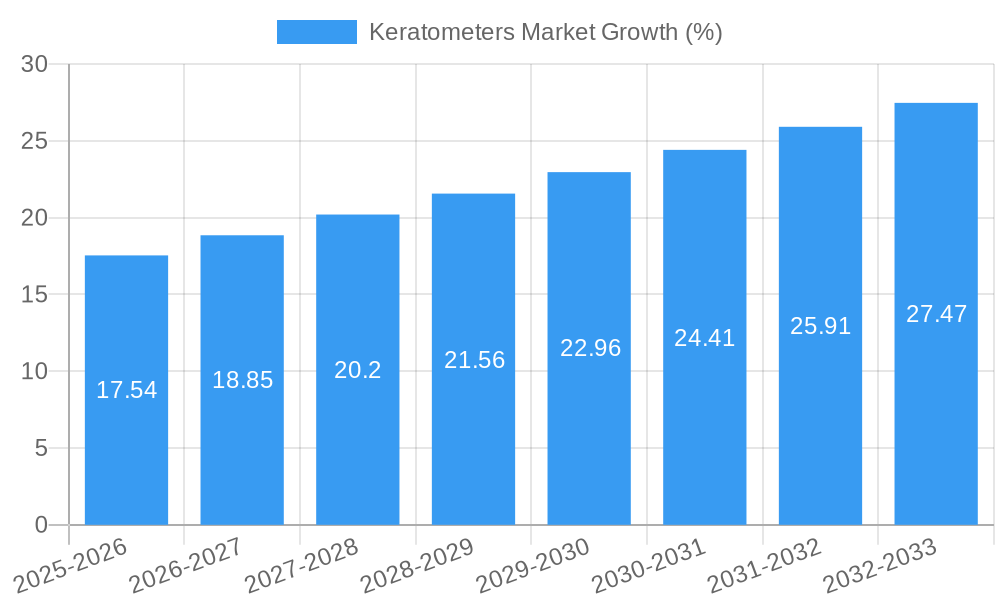
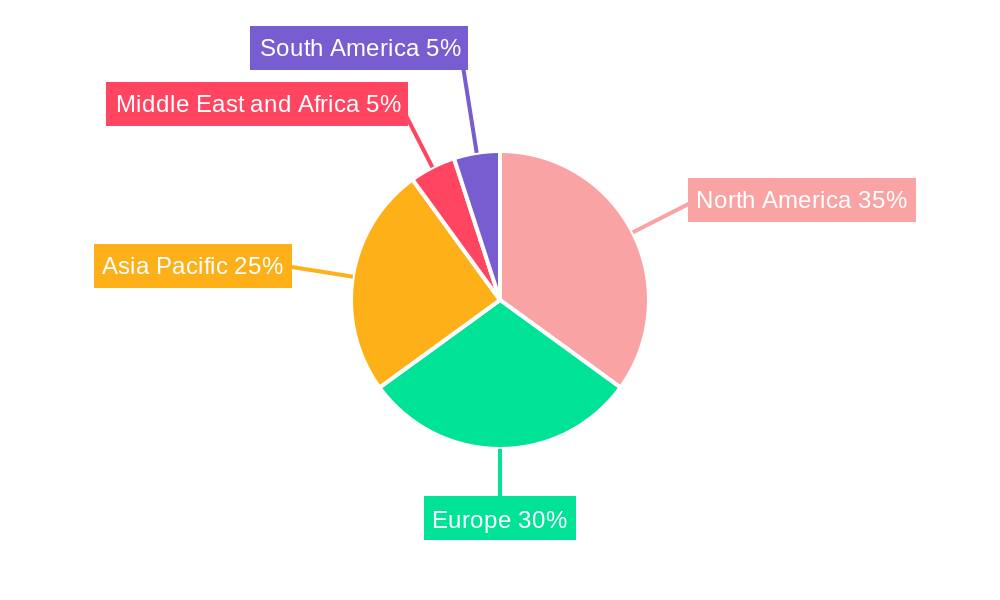
Significant regional variations exist within the market. North America and Europe currently hold substantial market shares, driven by established healthcare infrastructure and high adoption rates of advanced diagnostic technologies. However, the Asia-Pacific region is anticipated to exhibit the highest growth rate over the forecast period (2025-2033), owing to rising disposable incomes, increasing awareness of eye health, and a burgeoning middle class. Market restraints include the high cost of advanced keratometers, particularly in low- and middle-income countries, and the potential for errors in measurement, necessitating skilled technicians for operation. Despite these challenges, the long-term outlook for the keratometers market remains positive, driven by technological innovation, rising demand for improved eye care, and expanding global healthcare infrastructure. The market is expected to maintain a compound annual growth rate (CAGR) of 5.54% throughout the forecast period.
Keratometers Market: A Comprehensive Report (2019-2033)
This detailed report provides a comprehensive analysis of the global Keratometers Market, offering invaluable insights for stakeholders seeking to understand market dynamics, competitive landscapes, and future growth opportunities. Covering the period 2019-2033, with a focus on 2025, this report delivers actionable intelligence to drive strategic decision-making.
Keratometers Market Market Structure & Competitive Dynamics
The global keratometers market exhibits a moderately consolidated structure, with several key players holding significant market share. The market is characterized by a dynamic interplay of established industry giants and emerging innovative companies. The competitive landscape is shaped by factors such as technological advancements, regulatory approvals, and strategic mergers and acquisitions (M&A). Innovation ecosystems play a crucial role, with ongoing research and development driving the introduction of advanced keratometers with improved accuracy, portability, and features. Regulatory frameworks, varying across regions, influence market access and product approvals. Product substitutes, while limited, include other ophthalmic diagnostic tools, impacting the market's overall growth. End-user trends, particularly the increasing demand for advanced eye care services, drive market growth. M&A activities are relatively frequent, with deals often aimed at expanding product portfolios and geographical reach. While precise M&A deal values are difficult to obtain without proprietary data, it is expected that deal values fluctuate between xx Million and xx Million based on market size and industry trends. Market share is concentrated amongst the top players, with the top 5 companies holding an estimated xx% of the overall market share in 2025. This concentration is expected to slightly decrease by 2033, with emerging companies gaining traction through innovation.
Keratometers Market Industry Trends & Insights
The global keratometers market is projected to experience significant growth during the forecast period (2025-2033), driven by several key factors. The rising prevalence of refractive errors globally is a primary driver, increasing the demand for accurate and efficient diagnostic tools like keratometers. Technological advancements, such as the integration of advanced imaging technologies and software algorithms, are enhancing the accuracy and speed of keratometry measurements, further propelling market growth. The increasing adoption of minimally invasive refractive surgeries is also contributing to market expansion, as keratometers are crucial for pre-operative planning and assessment. Consumer preferences are shifting towards advanced features, such as portability and user-friendliness, which are driving the demand for portable keratometers. Competitive dynamics within the market are intense, with companies investing heavily in research and development to introduce innovative products and enhance their market positions. The market is expected to exhibit a CAGR of xx% during the forecast period, with market penetration steadily increasing in developing economies. The market size is predicted to reach xx Million by 2033.
Dominant Markets & Segments in Keratometers Market
The North American region is currently the dominant market for keratometers, driven by factors such as high healthcare expenditure, advanced healthcare infrastructure, and a large patient base with refractive errors. Within the segment breakdown:
- By Type: The stationary type keratometers segment currently holds the largest market share, owing to its high accuracy and advanced features. However, the portable type keratometers segment is expected to witness faster growth during the forecast period, driven by increasing demand for convenient and portable diagnostic tools.
- By End User: Hospitals constitute the largest end-user segment, followed by eye clinics. Growth in this segment is driven by increasing investments in healthcare infrastructure and the rising number of ophthalmology departments in hospitals.
Key Drivers for North American Dominance:
- Advanced healthcare infrastructure and technological advancements.
- High healthcare expenditure and insurance coverage.
- High prevalence of refractive errors.
- Strong presence of key market players.
Other regions, such as Europe and Asia-Pacific, are also witnessing significant growth, driven by rising healthcare awareness and increasing disposable incomes. The market is expected to experience a geographic shift towards developing economies in the coming years.
Keratometers Market Product Innovations
Recent advancements in keratometer technology have focused on improving accuracy, portability, and integration with other ophthalmic diagnostic tools. New keratometers are incorporating advanced imaging techniques like Placido disc and Scheimpflug imaging, enhancing the precision of corneal curvature measurements. The integration of automated analysis software simplifies the diagnostic process and reduces the potential for human error. Moreover, the miniaturization of components has led to the development of more compact and portable devices, improving accessibility and convenience for both healthcare professionals and patients. This reflects the trend toward improved user-experience and ease of integration within existing clinical workflows.
Report Segmentation & Scope
The report segments the keratometers market based on type and end-user.
By Type:
Stationary Type Keratometers: This segment is characterized by high accuracy and advanced features but is less portable. We project a xx Million market size in 2025 growing to xx Million by 2033, with a CAGR of xx%. Competitive dynamics are driven by feature enhancements and technological integration.
Portable Type Keratometers: This segment offers convenience and portability, which is driving growth. We estimate a xx Million market size in 2025 growing to xx Million by 2033, with a CAGR of xx%. The competitive landscape focuses on ease of use and affordability.
By End User:
Hospitals: This segment dominates market share due to high volumes of patients and investment in advanced diagnostic tools. The segment is predicted to grow at a CAGR of xx%, reaching xx Million by 2033. Competitive dynamics center on device integration and workflow optimization within the hospital setting.
Eye Clinics: This segment contributes significantly to the market, driven by increased demand for specialized eye care. It is projected to grow at a CAGR of xx%, reaching xx Million by 2033. The competitive landscape emphasizes ease of use and faster measurement times for higher patient throughput.
Others: This segment includes smaller practices and research institutions. It will contribute xx Million to market size in 2025, growing to xx Million by 2033. Growth will be driven by increasing affordability and technological advancements.
Key Drivers of Keratometers Market Growth
Several factors are driving the growth of the keratometers market. The increasing prevalence of refractive errors like myopia and hyperopia is a primary driver, necessitating accurate corneal curvature measurements for diagnosis and treatment planning. Technological advancements, such as the development of more accurate and portable devices with advanced features, are also contributing to market growth. Furthermore, the rising adoption of refractive surgeries and the increasing demand for advanced eye care services are fueling market expansion. Favorable regulatory environments in several regions are also facilitating market growth. The increasing focus on eye health globally, coupled with government initiatives promoting preventative eye care, further contributes to the market’s expansion.
Challenges in the Keratometers Market Sector
Despite its growth potential, the keratometers market faces several challenges. Stringent regulatory approvals for new medical devices can create hurdles for market entry and slow down innovation. Supply chain disruptions, particularly those affecting component sourcing, can impact production and availability. Intense competition among established players and the emergence of new entrants can create pricing pressures. The high cost of advanced keratometers can limit their accessibility in certain regions, particularly in low and middle-income countries. These factors present complexities for sustained market growth, requiring strategic planning and adaptation by market participants.
Leading Players in the Keratometers Market Market
- SHIGIYA MACHINERY WORKS LTD GS Division
- Visionix (Luneau Technology)
- Micro Medical Devices
- Essilor
- Costruzione Strumenti Oftalmici
- Reichert Inc
- Carl Zeiss AG
- Naugra Medical
- Topcon Corporation
- Canon Medical Systems Corporation
- NIDEK CO LTD
- TOMEY GmbH
Key Developments in Keratometers Market Sector
June 2023: EssilorLuxottica and the World Society of Paediatric Ophthalmology and Strabismus collaborated to advance knowledge and education of myopia management globally. This collaboration is expected to positively impact the market by increasing awareness and driving adoption of myopia management strategies, indirectly boosting keratometer demand for diagnosis.
March 2023: WaveFront Dynamics Inc. launched its WaveDyn Vision Analyzer, a dynamic aberrometry measurement system also used for keratometry. This product launch introduces a technologically advanced option to the market, potentially influencing adoption trends and driving competition.
Strategic Keratometers Market Market Outlook
The future of the keratometers market appears bright, driven by sustained technological advancements, rising prevalence of refractive errors, and increased awareness of eye health. Strategic opportunities lie in developing cost-effective, portable, and user-friendly devices catering to diverse healthcare settings. Expanding into emerging markets with high unmet needs represents a significant growth area. Furthermore, collaborations and strategic partnerships among industry players could accelerate innovation and market penetration. Focusing on integration with other ophthalmic diagnostic tools and leveraging data analytics to enhance clinical decision-making will be key for sustained success in this evolving market.
Keratometers Market Segmentation
-
1. Type
- 1.1. Stationary Type Keratometers
- 1.2. Portable Type Keratometers
-
2. End User
- 2.1. Hospitals
- 2.2. Eye Clinics
- 2.3. Others
Keratometers Market Segmentation By Geography
-
1. North America
- 1.1. United States
- 1.2. Canada
- 1.3. Mexico
-
2. Europe
- 2.1. Germany
- 2.2. United Kingdom
- 2.3. France
- 2.4. Italy
- 2.5. Spain
- 2.6. Rest of Europe
-
3. Asia Pacific
- 3.1. China
- 3.2. Japan
- 3.3. India
- 3.4. Australia
- 3.5. South Korea
- 3.6. Rest of Asia Pacific
-
4. Middle East and Africa
- 4.1. GCC
- 4.2. South Africa
- 4.3. Rest of Middle East and Africa
-
5. South America
- 5.1. Brazil
- 5.2. Argentina
- 5.3. Rest of South America
Keratometers Market REPORT HIGHLIGHTS
| Aspects | Details |
|---|---|
| Study Period | 2019-2033 |
| Base Year | 2024 |
| Estimated Year | 2025 |
| Forecast Period | 2025-2033 |
| Historical Period | 2019-2024 |
| Growth Rate | CAGR of 5.54% from 2019-2033 |
| Segmentation |
|
Table of Contents
- 1. Introduction
- 1.1. Research Scope
- 1.2. Market Segmentation
- 1.3. Research Methodology
- 1.4. Definitions and Assumptions
- 2. Executive Summary
- 2.1. Introduction
- 3. Market Dynamics
- 3.1. Introduction
- 3.2. Market Drivers
- 3.2.1 Increasing Burden of Eye Disorders; Growing Investments
- 3.2.2 Funds
- 3.2.3 and Grants on Eye Care Devices
- 3.3. Market Restrains
- 3.3.1. Lack of Primary Infrastructure For Eye Related Diseases in Underdeveloped and Developing Countries
- 3.4. Market Trends
- 3.4.1. Hospitals are Expected to Hold a Significant Market Share Over the Forecast Period
- 4. Market Factor Analysis
- 4.1. Porters Five Forces
- 4.2. Supply/Value Chain
- 4.3. PESTEL analysis
- 4.4. Market Entropy
- 4.5. Patent/Trademark Analysis
- 5. Global Keratometers Market Analysis, Insights and Forecast, 2019-2031
- 5.1. Market Analysis, Insights and Forecast - by Type
- 5.1.1. Stationary Type Keratometers
- 5.1.2. Portable Type Keratometers
- 5.2. Market Analysis, Insights and Forecast - by End User
- 5.2.1. Hospitals
- 5.2.2. Eye Clinics
- 5.2.3. Others
- 5.3. Market Analysis, Insights and Forecast - by Region
- 5.3.1. North America
- 5.3.2. Europe
- 5.3.3. Asia Pacific
- 5.3.4. Middle East and Africa
- 5.3.5. South America
- 5.1. Market Analysis, Insights and Forecast - by Type
- 6. North America Keratometers Market Analysis, Insights and Forecast, 2019-2031
- 6.1. Market Analysis, Insights and Forecast - by Type
- 6.1.1. Stationary Type Keratometers
- 6.1.2. Portable Type Keratometers
- 6.2. Market Analysis, Insights and Forecast - by End User
- 6.2.1. Hospitals
- 6.2.2. Eye Clinics
- 6.2.3. Others
- 6.1. Market Analysis, Insights and Forecast - by Type
- 7. Europe Keratometers Market Analysis, Insights and Forecast, 2019-2031
- 7.1. Market Analysis, Insights and Forecast - by Type
- 7.1.1. Stationary Type Keratometers
- 7.1.2. Portable Type Keratometers
- 7.2. Market Analysis, Insights and Forecast - by End User
- 7.2.1. Hospitals
- 7.2.2. Eye Clinics
- 7.2.3. Others
- 7.1. Market Analysis, Insights and Forecast - by Type
- 8. Asia Pacific Keratometers Market Analysis, Insights and Forecast, 2019-2031
- 8.1. Market Analysis, Insights and Forecast - by Type
- 8.1.1. Stationary Type Keratometers
- 8.1.2. Portable Type Keratometers
- 8.2. Market Analysis, Insights and Forecast - by End User
- 8.2.1. Hospitals
- 8.2.2. Eye Clinics
- 8.2.3. Others
- 8.1. Market Analysis, Insights and Forecast - by Type
- 9. Middle East and Africa Keratometers Market Analysis, Insights and Forecast, 2019-2031
- 9.1. Market Analysis, Insights and Forecast - by Type
- 9.1.1. Stationary Type Keratometers
- 9.1.2. Portable Type Keratometers
- 9.2. Market Analysis, Insights and Forecast - by End User
- 9.2.1. Hospitals
- 9.2.2. Eye Clinics
- 9.2.3. Others
- 9.1. Market Analysis, Insights and Forecast - by Type
- 10. South America Keratometers Market Analysis, Insights and Forecast, 2019-2031
- 10.1. Market Analysis, Insights and Forecast - by Type
- 10.1.1. Stationary Type Keratometers
- 10.1.2. Portable Type Keratometers
- 10.2. Market Analysis, Insights and Forecast - by End User
- 10.2.1. Hospitals
- 10.2.2. Eye Clinics
- 10.2.3. Others
- 10.1. Market Analysis, Insights and Forecast - by Type
- 11. North America Keratometers Market Analysis, Insights and Forecast, 2019-2031
- 11.1. Market Analysis, Insights and Forecast - By Country/Sub-region
- 11.1.1 United States
- 11.1.2 Canada
- 11.1.3 Mexico
- 12. Europe Keratometers Market Analysis, Insights and Forecast, 2019-2031
- 12.1. Market Analysis, Insights and Forecast - By Country/Sub-region
- 12.1.1 Germany
- 12.1.2 United Kingdom
- 12.1.3 France
- 12.1.4 Italy
- 12.1.5 Spain
- 12.1.6 Rest of Europe
- 13. Asia Pacific Keratometers Market Analysis, Insights and Forecast, 2019-2031
- 13.1. Market Analysis, Insights and Forecast - By Country/Sub-region
- 13.1.1 China
- 13.1.2 Japan
- 13.1.3 India
- 13.1.4 Australia
- 13.1.5 South Korea
- 13.1.6 Rest of Asia Pacific
- 14. Middle East and Africa Keratometers Market Analysis, Insights and Forecast, 2019-2031
- 14.1. Market Analysis, Insights and Forecast - By Country/Sub-region
- 14.1.1 GCC
- 14.1.2 South Africa
- 14.1.3 Rest of Middle East and Africa
- 15. South America Keratometers Market Analysis, Insights and Forecast, 2019-2031
- 15.1. Market Analysis, Insights and Forecast - By Country/Sub-region
- 15.1.1 Brazil
- 15.1.2 Argentina
- 15.1.3 Rest of South America
- 16. Competitive Analysis
- 16.1. Global Market Share Analysis 2024
- 16.2. Company Profiles
- 16.2.1 SHIGIYA MACHINERY WORKS LTD GS Division
- 16.2.1.1. Overview
- 16.2.1.2. Products
- 16.2.1.3. SWOT Analysis
- 16.2.1.4. Recent Developments
- 16.2.1.5. Financials (Based on Availability)
- 16.2.2 Visionix (Luneau Technology)
- 16.2.2.1. Overview
- 16.2.2.2. Products
- 16.2.2.3. SWOT Analysis
- 16.2.2.4. Recent Developments
- 16.2.2.5. Financials (Based on Availability)
- 16.2.3 Micro Medical Devices
- 16.2.3.1. Overview
- 16.2.3.2. Products
- 16.2.3.3. SWOT Analysis
- 16.2.3.4. Recent Developments
- 16.2.3.5. Financials (Based on Availability)
- 16.2.4 Essilor
- 16.2.4.1. Overview
- 16.2.4.2. Products
- 16.2.4.3. SWOT Analysis
- 16.2.4.4. Recent Developments
- 16.2.4.5. Financials (Based on Availability)
- 16.2.5 Costruzione Strumenti Oftalmici
- 16.2.5.1. Overview
- 16.2.5.2. Products
- 16.2.5.3. SWOT Analysis
- 16.2.5.4. Recent Developments
- 16.2.5.5. Financials (Based on Availability)
- 16.2.6 Reichert Inc
- 16.2.6.1. Overview
- 16.2.6.2. Products
- 16.2.6.3. SWOT Analysis
- 16.2.6.4. Recent Developments
- 16.2.6.5. Financials (Based on Availability)
- 16.2.7 Carl Zeiss AG
- 16.2.7.1. Overview
- 16.2.7.2. Products
- 16.2.7.3. SWOT Analysis
- 16.2.7.4. Recent Developments
- 16.2.7.5. Financials (Based on Availability)
- 16.2.8 Naugra Medical
- 16.2.8.1. Overview
- 16.2.8.2. Products
- 16.2.8.3. SWOT Analysis
- 16.2.8.4. Recent Developments
- 16.2.8.5. Financials (Based on Availability)
- 16.2.9 Topcon Corporation
- 16.2.9.1. Overview
- 16.2.9.2. Products
- 16.2.9.3. SWOT Analysis
- 16.2.9.4. Recent Developments
- 16.2.9.5. Financials (Based on Availability)
- 16.2.10 Canon Medical Systems Corporation*List Not Exhaustive
- 16.2.10.1. Overview
- 16.2.10.2. Products
- 16.2.10.3. SWOT Analysis
- 16.2.10.4. Recent Developments
- 16.2.10.5. Financials (Based on Availability)
- 16.2.11 NIDEK CO LTD
- 16.2.11.1. Overview
- 16.2.11.2. Products
- 16.2.11.3. SWOT Analysis
- 16.2.11.4. Recent Developments
- 16.2.11.5. Financials (Based on Availability)
- 16.2.12 TOMEY GmbH
- 16.2.12.1. Overview
- 16.2.12.2. Products
- 16.2.12.3. SWOT Analysis
- 16.2.12.4. Recent Developments
- 16.2.12.5. Financials (Based on Availability)
- 16.2.1 SHIGIYA MACHINERY WORKS LTD GS Division
List of Figures
- Figure 1: Global Keratometers Market Revenue Breakdown (Million, %) by Region 2024 & 2032
- Figure 2: North America Keratometers Market Revenue (Million), by Country 2024 & 2032
- Figure 3: North America Keratometers Market Revenue Share (%), by Country 2024 & 2032
- Figure 4: Europe Keratometers Market Revenue (Million), by Country 2024 & 2032
- Figure 5: Europe Keratometers Market Revenue Share (%), by Country 2024 & 2032
- Figure 6: Asia Pacific Keratometers Market Revenue (Million), by Country 2024 & 2032
- Figure 7: Asia Pacific Keratometers Market Revenue Share (%), by Country 2024 & 2032
- Figure 8: Middle East and Africa Keratometers Market Revenue (Million), by Country 2024 & 2032
- Figure 9: Middle East and Africa Keratometers Market Revenue Share (%), by Country 2024 & 2032
- Figure 10: South America Keratometers Market Revenue (Million), by Country 2024 & 2032
- Figure 11: South America Keratometers Market Revenue Share (%), by Country 2024 & 2032
- Figure 12: North America Keratometers Market Revenue (Million), by Type 2024 & 2032
- Figure 13: North America Keratometers Market Revenue Share (%), by Type 2024 & 2032
- Figure 14: North America Keratometers Market Revenue (Million), by End User 2024 & 2032
- Figure 15: North America Keratometers Market Revenue Share (%), by End User 2024 & 2032
- Figure 16: North America Keratometers Market Revenue (Million), by Country 2024 & 2032
- Figure 17: North America Keratometers Market Revenue Share (%), by Country 2024 & 2032
- Figure 18: Europe Keratometers Market Revenue (Million), by Type 2024 & 2032
- Figure 19: Europe Keratometers Market Revenue Share (%), by Type 2024 & 2032
- Figure 20: Europe Keratometers Market Revenue (Million), by End User 2024 & 2032
- Figure 21: Europe Keratometers Market Revenue Share (%), by End User 2024 & 2032
- Figure 22: Europe Keratometers Market Revenue (Million), by Country 2024 & 2032
- Figure 23: Europe Keratometers Market Revenue Share (%), by Country 2024 & 2032
- Figure 24: Asia Pacific Keratometers Market Revenue (Million), by Type 2024 & 2032
- Figure 25: Asia Pacific Keratometers Market Revenue Share (%), by Type 2024 & 2032
- Figure 26: Asia Pacific Keratometers Market Revenue (Million), by End User 2024 & 2032
- Figure 27: Asia Pacific Keratometers Market Revenue Share (%), by End User 2024 & 2032
- Figure 28: Asia Pacific Keratometers Market Revenue (Million), by Country 2024 & 2032
- Figure 29: Asia Pacific Keratometers Market Revenue Share (%), by Country 2024 & 2032
- Figure 30: Middle East and Africa Keratometers Market Revenue (Million), by Type 2024 & 2032
- Figure 31: Middle East and Africa Keratometers Market Revenue Share (%), by Type 2024 & 2032
- Figure 32: Middle East and Africa Keratometers Market Revenue (Million), by End User 2024 & 2032
- Figure 33: Middle East and Africa Keratometers Market Revenue Share (%), by End User 2024 & 2032
- Figure 34: Middle East and Africa Keratometers Market Revenue (Million), by Country 2024 & 2032
- Figure 35: Middle East and Africa Keratometers Market Revenue Share (%), by Country 2024 & 2032
- Figure 36: South America Keratometers Market Revenue (Million), by Type 2024 & 2032
- Figure 37: South America Keratometers Market Revenue Share (%), by Type 2024 & 2032
- Figure 38: South America Keratometers Market Revenue (Million), by End User 2024 & 2032
- Figure 39: South America Keratometers Market Revenue Share (%), by End User 2024 & 2032
- Figure 40: South America Keratometers Market Revenue (Million), by Country 2024 & 2032
- Figure 41: South America Keratometers Market Revenue Share (%), by Country 2024 & 2032
List of Tables
- Table 1: Global Keratometers Market Revenue Million Forecast, by Region 2019 & 2032
- Table 2: Global Keratometers Market Revenue Million Forecast, by Type 2019 & 2032
- Table 3: Global Keratometers Market Revenue Million Forecast, by End User 2019 & 2032
- Table 4: Global Keratometers Market Revenue Million Forecast, by Region 2019 & 2032
- Table 5: Global Keratometers Market Revenue Million Forecast, by Country 2019 & 2032
- Table 6: United States Keratometers Market Revenue (Million) Forecast, by Application 2019 & 2032
- Table 7: Canada Keratometers Market Revenue (Million) Forecast, by Application 2019 & 2032
- Table 8: Mexico Keratometers Market Revenue (Million) Forecast, by Application 2019 & 2032
- Table 9: Global Keratometers Market Revenue Million Forecast, by Country 2019 & 2032
- Table 10: Germany Keratometers Market Revenue (Million) Forecast, by Application 2019 & 2032
- Table 11: United Kingdom Keratometers Market Revenue (Million) Forecast, by Application 2019 & 2032
- Table 12: France Keratometers Market Revenue (Million) Forecast, by Application 2019 & 2032
- Table 13: Italy Keratometers Market Revenue (Million) Forecast, by Application 2019 & 2032
- Table 14: Spain Keratometers Market Revenue (Million) Forecast, by Application 2019 & 2032
- Table 15: Rest of Europe Keratometers Market Revenue (Million) Forecast, by Application 2019 & 2032
- Table 16: Global Keratometers Market Revenue Million Forecast, by Country 2019 & 2032
- Table 17: China Keratometers Market Revenue (Million) Forecast, by Application 2019 & 2032
- Table 18: Japan Keratometers Market Revenue (Million) Forecast, by Application 2019 & 2032
- Table 19: India Keratometers Market Revenue (Million) Forecast, by Application 2019 & 2032
- Table 20: Australia Keratometers Market Revenue (Million) Forecast, by Application 2019 & 2032
- Table 21: South Korea Keratometers Market Revenue (Million) Forecast, by Application 2019 & 2032
- Table 22: Rest of Asia Pacific Keratometers Market Revenue (Million) Forecast, by Application 2019 & 2032
- Table 23: Global Keratometers Market Revenue Million Forecast, by Country 2019 & 2032
- Table 24: GCC Keratometers Market Revenue (Million) Forecast, by Application 2019 & 2032
- Table 25: South Africa Keratometers Market Revenue (Million) Forecast, by Application 2019 & 2032
- Table 26: Rest of Middle East and Africa Keratometers Market Revenue (Million) Forecast, by Application 2019 & 2032
- Table 27: Global Keratometers Market Revenue Million Forecast, by Country 2019 & 2032
- Table 28: Brazil Keratometers Market Revenue (Million) Forecast, by Application 2019 & 2032
- Table 29: Argentina Keratometers Market Revenue (Million) Forecast, by Application 2019 & 2032
- Table 30: Rest of South America Keratometers Market Revenue (Million) Forecast, by Application 2019 & 2032
- Table 31: Global Keratometers Market Revenue Million Forecast, by Type 2019 & 2032
- Table 32: Global Keratometers Market Revenue Million Forecast, by End User 2019 & 2032
- Table 33: Global Keratometers Market Revenue Million Forecast, by Country 2019 & 2032
- Table 34: United States Keratometers Market Revenue (Million) Forecast, by Application 2019 & 2032
- Table 35: Canada Keratometers Market Revenue (Million) Forecast, by Application 2019 & 2032
- Table 36: Mexico Keratometers Market Revenue (Million) Forecast, by Application 2019 & 2032
- Table 37: Global Keratometers Market Revenue Million Forecast, by Type 2019 & 2032
- Table 38: Global Keratometers Market Revenue Million Forecast, by End User 2019 & 2032
- Table 39: Global Keratometers Market Revenue Million Forecast, by Country 2019 & 2032
- Table 40: Germany Keratometers Market Revenue (Million) Forecast, by Application 2019 & 2032
- Table 41: United Kingdom Keratometers Market Revenue (Million) Forecast, by Application 2019 & 2032
- Table 42: France Keratometers Market Revenue (Million) Forecast, by Application 2019 & 2032
- Table 43: Italy Keratometers Market Revenue (Million) Forecast, by Application 2019 & 2032
- Table 44: Spain Keratometers Market Revenue (Million) Forecast, by Application 2019 & 2032
- Table 45: Rest of Europe Keratometers Market Revenue (Million) Forecast, by Application 2019 & 2032
- Table 46: Global Keratometers Market Revenue Million Forecast, by Type 2019 & 2032
- Table 47: Global Keratometers Market Revenue Million Forecast, by End User 2019 & 2032
- Table 48: Global Keratometers Market Revenue Million Forecast, by Country 2019 & 2032
- Table 49: China Keratometers Market Revenue (Million) Forecast, by Application 2019 & 2032
- Table 50: Japan Keratometers Market Revenue (Million) Forecast, by Application 2019 & 2032
- Table 51: India Keratometers Market Revenue (Million) Forecast, by Application 2019 & 2032
- Table 52: Australia Keratometers Market Revenue (Million) Forecast, by Application 2019 & 2032
- Table 53: South Korea Keratometers Market Revenue (Million) Forecast, by Application 2019 & 2032
- Table 54: Rest of Asia Pacific Keratometers Market Revenue (Million) Forecast, by Application 2019 & 2032
- Table 55: Global Keratometers Market Revenue Million Forecast, by Type 2019 & 2032
- Table 56: Global Keratometers Market Revenue Million Forecast, by End User 2019 & 2032
- Table 57: Global Keratometers Market Revenue Million Forecast, by Country 2019 & 2032
- Table 58: GCC Keratometers Market Revenue (Million) Forecast, by Application 2019 & 2032
- Table 59: South Africa Keratometers Market Revenue (Million) Forecast, by Application 2019 & 2032
- Table 60: Rest of Middle East and Africa Keratometers Market Revenue (Million) Forecast, by Application 2019 & 2032
- Table 61: Global Keratometers Market Revenue Million Forecast, by Type 2019 & 2032
- Table 62: Global Keratometers Market Revenue Million Forecast, by End User 2019 & 2032
- Table 63: Global Keratometers Market Revenue Million Forecast, by Country 2019 & 2032
- Table 64: Brazil Keratometers Market Revenue (Million) Forecast, by Application 2019 & 2032
- Table 65: Argentina Keratometers Market Revenue (Million) Forecast, by Application 2019 & 2032
- Table 66: Rest of South America Keratometers Market Revenue (Million) Forecast, by Application 2019 & 2032
Frequently Asked Questions
1. What is the projected Compound Annual Growth Rate (CAGR) of the Keratometers Market?
The projected CAGR is approximately 5.54%.
2. Which companies are prominent players in the Keratometers Market?
Key companies in the market include SHIGIYA MACHINERY WORKS LTD GS Division, Visionix (Luneau Technology), Micro Medical Devices, Essilor, Costruzione Strumenti Oftalmici, Reichert Inc, Carl Zeiss AG, Naugra Medical, Topcon Corporation, Canon Medical Systems Corporation*List Not Exhaustive, NIDEK CO LTD, TOMEY GmbH.
3. What are the main segments of the Keratometers Market?
The market segments include Type, End User.
4. Can you provide details about the market size?
The market size is estimated to be USD 308.84 Million as of 2022.
5. What are some drivers contributing to market growth?
Increasing Burden of Eye Disorders; Growing Investments. Funds. and Grants on Eye Care Devices.
6. What are the notable trends driving market growth?
Hospitals are Expected to Hold a Significant Market Share Over the Forecast Period.
7. Are there any restraints impacting market growth?
Lack of Primary Infrastructure For Eye Related Diseases in Underdeveloped and Developing Countries.
8. Can you provide examples of recent developments in the market?
June 2023: EssilorLuxottica and the World Society of Paediatric Ophthalmology and Strabismus collaborated to advance knowledge and education of myopia management globally. This collaboration is expected to contribute to educating further and help eye care professionals successfully integrate myopia management in practice and guide their patients on how to manage their myopia.
9. What pricing options are available for accessing the report?
Pricing options include single-user, multi-user, and enterprise licenses priced at USD 4750, USD 5250, and USD 8750 respectively.
10. Is the market size provided in terms of value or volume?
The market size is provided in terms of value, measured in Million.
11. Are there any specific market keywords associated with the report?
Yes, the market keyword associated with the report is "Keratometers Market," which aids in identifying and referencing the specific market segment covered.
12. How do I determine which pricing option suits my needs best?
The pricing options vary based on user requirements and access needs. Individual users may opt for single-user licenses, while businesses requiring broader access may choose multi-user or enterprise licenses for cost-effective access to the report.
13. Are there any additional resources or data provided in the Keratometers Market report?
While the report offers comprehensive insights, it's advisable to review the specific contents or supplementary materials provided to ascertain if additional resources or data are available.
14. How can I stay updated on further developments or reports in the Keratometers Market?
To stay informed about further developments, trends, and reports in the Keratometers Market, consider subscribing to industry newsletters, following relevant companies and organizations, or regularly checking reputable industry news sources and publications.
Methodology
Step 1 - Identification of Relevant Samples Size from Population Database


Step 2 - Approaches for Defining Global Market Size (Value, Volume* & Price*)

Note*: In applicable scenarios
Step 3 - Data Sources
Primary Research
- Web Analytics
- Survey Reports
- Research Institute
- Latest Research Reports
- Opinion Leaders
Secondary Research
- Annual Reports
- White Paper
- Latest Press Release
- Industry Association
- Paid Database
- Investor Presentations

Step 4 - Data Triangulation
Involves using different sources of information in order to increase the validity of a study
These sources are likely to be stakeholders in a program - participants, other researchers, program staff, other community members, and so on.
Then we put all data in single framework & apply various statistical tools to find out the dynamic on the market.
During the analysis stage, feedback from the stakeholder groups would be compared to determine areas of agreement as well as areas of divergence


