
Key Insights
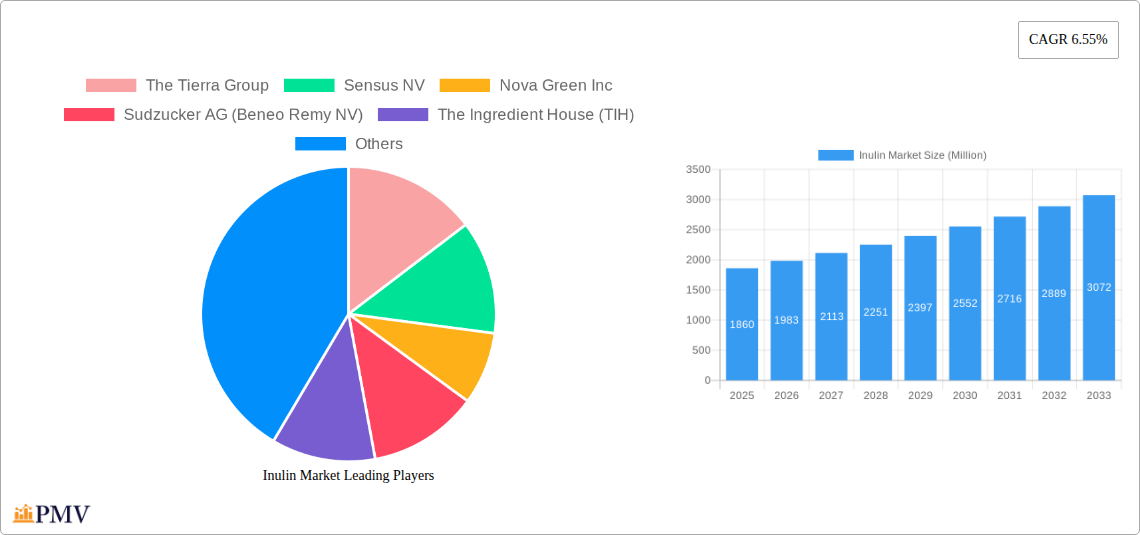
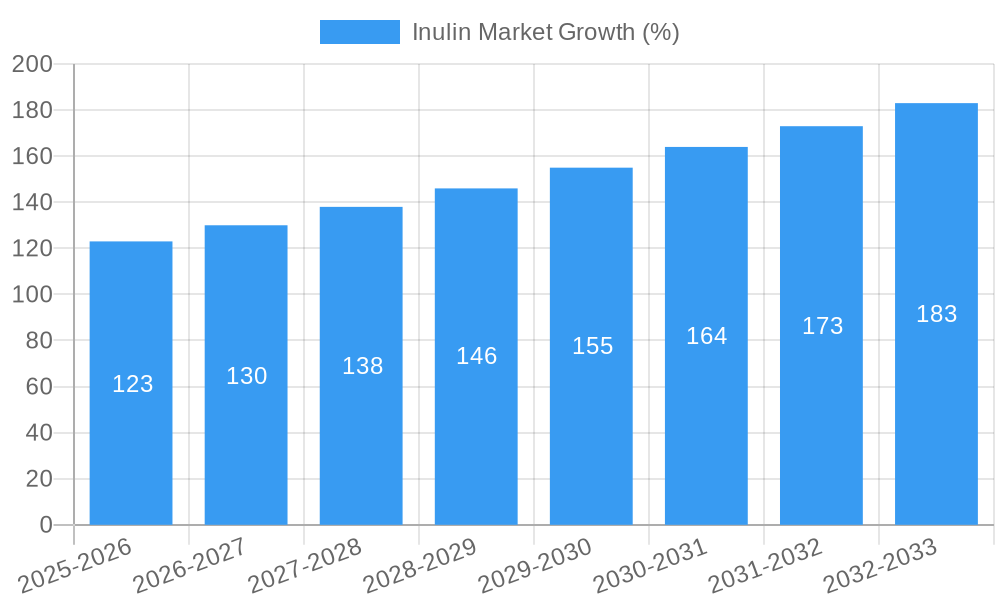
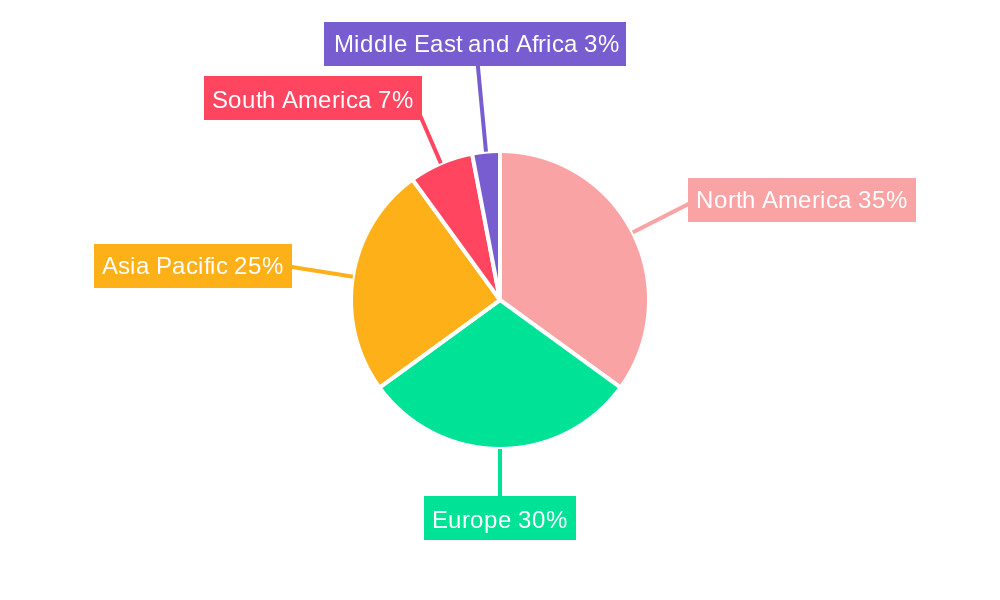
The global inulin market, valued at $1.86 billion in 2025, is projected to experience robust growth, driven by increasing consumer demand for natural and functional food ingredients. The market's Compound Annual Growth Rate (CAGR) of 6.55% from 2019-2033 indicates a significant expansion opportunity over the forecast period (2025-2033). Key drivers include the rising prevalence of health-conscious consumers seeking prebiotic fibers, growing awareness of inulin's health benefits like improved gut health and blood sugar management, and its versatile applications across food and beverages, dietary supplements, and pharmaceuticals. The food and beverage sector constitutes a major share of the market, with applications in yogurt, bakery products, and confectionery leveraging inulin's texture-enhancing and sweetness properties. Growth is further propelled by the expanding dietary supplement market and increased research into inulin's potential therapeutic uses. However, price fluctuations in raw materials and potential challenges in standardization and extraction processes could pose some restraints to market expansion. North America and Europe currently hold substantial market shares, but the Asia-Pacific region, particularly India and China, is poised for significant growth due to rising disposable incomes and increasing health awareness. Major players like Cargill, Beneo, and Sensus are actively shaping market dynamics through strategic partnerships, product innovation, and expansion into new geographical markets.
The projected growth trajectory of the inulin market is expected to continue its upward trend, driven primarily by the increasing adoption of inulin as a functional food ingredient. Innovation within the food and beverage industry, particularly in creating healthier and more functional products, will fuel further market penetration. The development of novel inulin-based products, combined with effective marketing campaigns highlighting the health benefits, will play a crucial role in expanding consumer awareness and market share across various regions. While challenges related to sustainable sourcing and production costs remain, the long-term outlook for the inulin market appears positive, driven by the confluence of rising consumer demand for healthier food choices and the industry's ongoing efforts to enhance production efficiency and meet market needs.
Inulin Market: A Comprehensive Report (2019-2033)
This detailed report provides a comprehensive analysis of the global inulin market, covering market dynamics, competitive landscape, segmentation, and future growth prospects from 2019 to 2033. The study period is 2019-2033, with 2025 as the base and estimated year, and 2025-2033 as the forecast period. The historical period covered is 2019-2024. This report is invaluable for industry stakeholders, investors, and researchers seeking actionable insights into this rapidly evolving market. The total market size in 2025 is estimated at xx Million and is projected to reach xx Million by 2033, exhibiting a CAGR of xx%.
Inulin Market Market Structure & Competitive Dynamics
This section analyzes the inulin market's competitive landscape, assessing market concentration, innovation, regulatory frameworks, substitute products, end-user trends, and merger & acquisition (M&A) activities. The market is characterized by a moderate level of concentration, with key players holding significant market share. However, smaller players are emerging, driven by innovation in product applications and rising demand.
- Market Concentration: The top five players hold approximately xx% of the market share in 2025.
- Innovation Ecosystems: Ongoing research and development efforts are focused on enhancing inulin's functional properties and expanding its applications in various sectors.
- Regulatory Frameworks: Regulatory compliance and food safety standards vary across regions, impacting market dynamics.
- Product Substitutes: The market faces competition from other prebiotic fibers and dietary supplements.
- End-User Trends: Growing health consciousness and increased demand for natural ingredients drive market growth.
- M&A Activities: Recent M&A activity demonstrates consolidation and strategic expansion in the inulin market. For example, the acquisition of Marroquin Organic International Inc. by AgranaStarke GmbH in March 2020 significantly expanded its product portfolio and market reach. The total value of M&A deals in the inulin market between 2019 and 2024 is estimated at xx Million.
Inulin Market Industry Trends & Insights
This section dives into the key trends shaping the inulin market. The market's growth is fueled by increasing consumer demand for functional foods and dietary supplements, driven by a growing awareness of gut health and the benefits of prebiotics. Technological advancements are also contributing to the market’s expansion, with innovations focusing on improved extraction processes, enhanced product functionalities, and broader applications. Consumer preferences are shifting towards natural and organic products, boosting demand for inulin sourced from sustainable and ethical practices. Intense competition among existing players and the emergence of new entrants further adds to the market dynamism. The market exhibits a robust growth trajectory, with a projected CAGR of xx% from 2025 to 2033. Market penetration in key segments continues to grow steadily, particularly in the food and beverage and dietary supplements sectors.
Dominant Markets & Segments in Inulin Market
This section identifies the leading regions, countries, and segments within the inulin market.
Dominant Region/Country: North America is currently the leading region for inulin consumption, driven by high consumer demand and strong regulatory support for functional foods. Europe follows closely, with significant market share. Key drivers in these regions include:
- Strong consumer demand for functional food and beverages.
- Well-established food and beverage industry.
- Favorable regulatory environment for food additives and functional ingredients.
- Extensive research and development activities.
Dominant Segment: The Food and Beverage segment represents the largest application segment for inulin, driven by its use as a prebiotic ingredient and as a fat replacement in various products. Dietary supplements represent another significant segment fueled by the rising focus on digestive health and immune support.
Inulin Market Product Innovations
Recent innovations have focused on developing inulin products with improved functional properties, such as enhanced solubility, stability, and texture. Technological advancements are driving the development of novel inulin-based products tailored to specific applications, including advanced prebiotic formulations and ingredients for plant-based foods. These innovations improve market fit by addressing consumer demands for healthier, more sustainable food choices.
Report Segmentation & Scope
This report segments the inulin market based on application:
- Food and Beverage: This segment is projected to register a CAGR of xx% during the forecast period, driven by the increasing use of inulin as a prebiotic ingredient in yogurt, dairy products, bakery items, and beverages. Competitive dynamics are characterized by intense competition among various inulin suppliers.
- Other Foods and Beverages: This segment includes applications in confectionery, frozen desserts, and other processed foods, and is expected to exhibit a CAGR of xx% during the forecast period.
- Dietary Supplements: The dietary supplements segment is projected to grow at a CAGR of xx% due to growing awareness of gut health and the increasing preference for natural prebiotics. Competition is driven by the introduction of specialized blends and formulations.
- Pharmaceuticals: The pharmaceutical segment represents a niche market, with applications as a drug excipient and a prebiotic in specialized formulations. The segment is anticipated to show a CAGR of xx%.
Key Drivers of Inulin Market Growth
The inulin market is driven by several key factors:
- Growing consumer awareness: Increased consumer awareness of the health benefits of prebiotics and the role of gut health in overall well-being.
- Health and wellness trends: The global surge in health and wellness trends fuels the demand for functional foods and supplements containing inulin.
- Technological advancements: Innovations in inulin extraction and processing methods, leading to improved product quality and wider applications.
- Rising demand for plant-based foods: Increasing demand for plant-based products drives the adoption of inulin as a functional ingredient.
Challenges in the Inulin Market Sector
Despite favorable growth drivers, several challenges impact the inulin market:
- Price fluctuations: Fluctuations in raw material prices and supply chain disruptions can affect inulin pricing and availability.
- Competition from other prebiotics: Competition from other prebiotic fibers and functional ingredients limits market share.
- Regulatory hurdles: Strict regulatory requirements for food and dietary supplements can impact market entry and expansion. The total impact of these challenges on market growth is estimated to reduce the CAGR by approximately xx%.
Leading Players in the Inulin Market Market
- The Tierra Group
- Sensus NV
- Nova Green Inc
- Sudzucker AG (Beneo Remy NV)
- The Ingredient House (TIH)
- Ciranda Inc
- Adept Impex Private Limited
- Cosucra Groupe Warcoing SA
- Cargill Inc
- The Green Labs LLC
- List Not Exhaustive
Key Developments in Inulin Market Sector
- March 2022: Sensus announced plans to expand inulin production to meet growing demand for natural prebiotics.
- December 2021: Beneo invested USD 33.9 Million in expanding its chicory root fiber inulin production capacity.
- March 2020: AgranaStarke GmbH acquired Marroquin Organic International Inc., expanding its product portfolio.
Strategic Inulin Market Market Outlook
The inulin market presents significant growth potential, driven by continued consumer demand for healthy and functional foods. Strategic opportunities lie in expanding into new applications, developing innovative product formulations, and focusing on sustainable sourcing and production practices. Further investments in research and development and strategic partnerships are key to capturing market share and ensuring future success in this dynamic market.
Inulin Market Segmentation
-
1. Application
-
1.1. Food and Beverage
- 1.1.1. Bakery and Confectionery
- 1.1.2. Dairy Products
- 1.1.3. Meat Products
- 1.1.4. Other Foods and Beverages
- 1.2. Dietary Supplements
- 1.3. Pharmaceuticals
-
1.1. Food and Beverage
Inulin Market Segmentation By Geography
-
1. North America
- 1.1. United States
- 1.2. Canada
- 1.3. Mexico
- 1.4. Rest of North America
-
2. Europe
- 2.1. United Kindgom
- 2.2. France
- 2.3. Germany
- 2.4. Spain
- 2.5. Rest of Europe
-
3. Asia Pacific
- 3.1. China
- 3.2. Japan
- 3.3. Australia
- 3.4. India
- 3.5. Rest of Asia Pacific
-
4. South America
- 4.1. Brazil
- 4.2. Argentina
- 4.3. Rest of South America
-
5. Middle East and Africa
- 5.1. South Africa
- 5.2. Saudi Arabia
- 5.3. Rest of Middle East and Africa
Inulin Market REPORT HIGHLIGHTS
| Aspects | Details |
|---|---|
| Study Period | 2019-2033 |
| Base Year | 2024 |
| Estimated Year | 2025 |
| Forecast Period | 2025-2033 |
| Historical Period | 2019-2024 |
| Growth Rate | CAGR of 6.55% from 2019-2033 |
| Segmentation |
|
Table of Contents
- 1. Introduction
- 1.1. Research Scope
- 1.2. Market Segmentation
- 1.3. Research Methodology
- 1.4. Definitions and Assumptions
- 2. Executive Summary
- 2.1. Introduction
- 3. Market Dynamics
- 3.1. Introduction
- 3.2. Market Drivers
- 3.2.1. Wide Applications and Functionality; Demand For Gluten-Free Products
- 3.3. Market Restrains
- 3.3.1. Easy Availability of Economically Feasible Alternatives
- 3.4. Market Trends
- 3.4.1. Growing Consumers’ Interest in Prebiotics
- 4. Market Factor Analysis
- 4.1. Porters Five Forces
- 4.2. Supply/Value Chain
- 4.3. PESTEL analysis
- 4.4. Market Entropy
- 4.5. Patent/Trademark Analysis
- 5. Global Inulin Market Analysis, Insights and Forecast, 2019-2031
- 5.1. Market Analysis, Insights and Forecast - by Application
- 5.1.1. Food and Beverage
- 5.1.1.1. Bakery and Confectionery
- 5.1.1.2. Dairy Products
- 5.1.1.3. Meat Products
- 5.1.1.4. Other Foods and Beverages
- 5.1.2. Dietary Supplements
- 5.1.3. Pharmaceuticals
- 5.1.1. Food and Beverage
- 5.2. Market Analysis, Insights and Forecast - by Region
- 5.2.1. North America
- 5.2.2. Europe
- 5.2.3. Asia Pacific
- 5.2.4. South America
- 5.2.5. Middle East and Africa
- 5.1. Market Analysis, Insights and Forecast - by Application
- 6. North America Inulin Market Analysis, Insights and Forecast, 2019-2031
- 6.1. Market Analysis, Insights and Forecast - by Application
- 6.1.1. Food and Beverage
- 6.1.1.1. Bakery and Confectionery
- 6.1.1.2. Dairy Products
- 6.1.1.3. Meat Products
- 6.1.1.4. Other Foods and Beverages
- 6.1.2. Dietary Supplements
- 6.1.3. Pharmaceuticals
- 6.1.1. Food and Beverage
- 6.1. Market Analysis, Insights and Forecast - by Application
- 7. Europe Inulin Market Analysis, Insights and Forecast, 2019-2031
- 7.1. Market Analysis, Insights and Forecast - by Application
- 7.1.1. Food and Beverage
- 7.1.1.1. Bakery and Confectionery
- 7.1.1.2. Dairy Products
- 7.1.1.3. Meat Products
- 7.1.1.4. Other Foods and Beverages
- 7.1.2. Dietary Supplements
- 7.1.3. Pharmaceuticals
- 7.1.1. Food and Beverage
- 7.1. Market Analysis, Insights and Forecast - by Application
- 8. Asia Pacific Inulin Market Analysis, Insights and Forecast, 2019-2031
- 8.1. Market Analysis, Insights and Forecast - by Application
- 8.1.1. Food and Beverage
- 8.1.1.1. Bakery and Confectionery
- 8.1.1.2. Dairy Products
- 8.1.1.3. Meat Products
- 8.1.1.4. Other Foods and Beverages
- 8.1.2. Dietary Supplements
- 8.1.3. Pharmaceuticals
- 8.1.1. Food and Beverage
- 8.1. Market Analysis, Insights and Forecast - by Application
- 9. South America Inulin Market Analysis, Insights and Forecast, 2019-2031
- 9.1. Market Analysis, Insights and Forecast - by Application
- 9.1.1. Food and Beverage
- 9.1.1.1. Bakery and Confectionery
- 9.1.1.2. Dairy Products
- 9.1.1.3. Meat Products
- 9.1.1.4. Other Foods and Beverages
- 9.1.2. Dietary Supplements
- 9.1.3. Pharmaceuticals
- 9.1.1. Food and Beverage
- 9.1. Market Analysis, Insights and Forecast - by Application
- 10. Middle East and Africa Inulin Market Analysis, Insights and Forecast, 2019-2031
- 10.1. Market Analysis, Insights and Forecast - by Application
- 10.1.1. Food and Beverage
- 10.1.1.1. Bakery and Confectionery
- 10.1.1.2. Dairy Products
- 10.1.1.3. Meat Products
- 10.1.1.4. Other Foods and Beverages
- 10.1.2. Dietary Supplements
- 10.1.3. Pharmaceuticals
- 10.1.1. Food and Beverage
- 10.1. Market Analysis, Insights and Forecast - by Application
- 11. North America Inulin Market Analysis, Insights and Forecast, 2019-2031
- 11.1. Market Analysis, Insights and Forecast - By Country/Sub-region
- 11.1.1 United States
- 11.1.2 Canada
- 11.1.3 Mexico
- 11.1.4 Rest of North America
- 12. Europe Inulin Market Analysis, Insights and Forecast, 2019-2031
- 12.1. Market Analysis, Insights and Forecast - By Country/Sub-region
- 12.1.1 United Kindgom
- 12.1.2 France
- 12.1.3 Germany
- 12.1.4 Spain
- 12.1.5 Rest of Europe
- 13. Asia Pacific Inulin Market Analysis, Insights and Forecast, 2019-2031
- 13.1. Market Analysis, Insights and Forecast - By Country/Sub-region
- 13.1.1 China
- 13.1.2 Japan
- 13.1.3 Australia
- 13.1.4 India
- 13.1.5 Rest of Asia Pacific
- 14. South America Inulin Market Analysis, Insights and Forecast, 2019-2031
- 14.1. Market Analysis, Insights and Forecast - By Country/Sub-region
- 14.1.1 Brazil
- 14.1.2 Argentina
- 14.1.3 Rest of South America
- 15. Middle East and Africa Inulin Market Analysis, Insights and Forecast, 2019-2031
- 15.1. Market Analysis, Insights and Forecast - By Country/Sub-region
- 15.1.1 South Africa
- 15.1.2 Saudi Arabia
- 15.1.3 Rest of Middle East and Africa
- 16. Competitive Analysis
- 16.1. Global Market Share Analysis 2024
- 16.2. Company Profiles
- 16.2.1 The Tierra Group
- 16.2.1.1. Overview
- 16.2.1.2. Products
- 16.2.1.3. SWOT Analysis
- 16.2.1.4. Recent Developments
- 16.2.1.5. Financials (Based on Availability)
- 16.2.2 Sensus NV
- 16.2.2.1. Overview
- 16.2.2.2. Products
- 16.2.2.3. SWOT Analysis
- 16.2.2.4. Recent Developments
- 16.2.2.5. Financials (Based on Availability)
- 16.2.3 Nova Green Inc
- 16.2.3.1. Overview
- 16.2.3.2. Products
- 16.2.3.3. SWOT Analysis
- 16.2.3.4. Recent Developments
- 16.2.3.5. Financials (Based on Availability)
- 16.2.4 Sudzucker AG (Beneo Remy NV)
- 16.2.4.1. Overview
- 16.2.4.2. Products
- 16.2.4.3. SWOT Analysis
- 16.2.4.4. Recent Developments
- 16.2.4.5. Financials (Based on Availability)
- 16.2.5 The Ingredient House (TIH)
- 16.2.5.1. Overview
- 16.2.5.2. Products
- 16.2.5.3. SWOT Analysis
- 16.2.5.4. Recent Developments
- 16.2.5.5. Financials (Based on Availability)
- 16.2.6 Ciranda Inc
- 16.2.6.1. Overview
- 16.2.6.2. Products
- 16.2.6.3. SWOT Analysis
- 16.2.6.4. Recent Developments
- 16.2.6.5. Financials (Based on Availability)
- 16.2.7 Adept Impex Private Limited
- 16.2.7.1. Overview
- 16.2.7.2. Products
- 16.2.7.3. SWOT Analysis
- 16.2.7.4. Recent Developments
- 16.2.7.5. Financials (Based on Availability)
- 16.2.8 Cosucra Groupe Warcoing SA
- 16.2.8.1. Overview
- 16.2.8.2. Products
- 16.2.8.3. SWOT Analysis
- 16.2.8.4. Recent Developments
- 16.2.8.5. Financials (Based on Availability)
- 16.2.9 Cargill Inc
- 16.2.9.1. Overview
- 16.2.9.2. Products
- 16.2.9.3. SWOT Analysis
- 16.2.9.4. Recent Developments
- 16.2.9.5. Financials (Based on Availability)
- 16.2.10 The Green Labs LLC*List Not Exhaustive
- 16.2.10.1. Overview
- 16.2.10.2. Products
- 16.2.10.3. SWOT Analysis
- 16.2.10.4. Recent Developments
- 16.2.10.5. Financials (Based on Availability)
- 16.2.1 The Tierra Group
List of Figures
- Figure 1: Global Inulin Market Revenue Breakdown (Million, %) by Region 2024 & 2032
- Figure 2: North America Inulin Market Revenue (Million), by Country 2024 & 2032
- Figure 3: North America Inulin Market Revenue Share (%), by Country 2024 & 2032
- Figure 4: Europe Inulin Market Revenue (Million), by Country 2024 & 2032
- Figure 5: Europe Inulin Market Revenue Share (%), by Country 2024 & 2032
- Figure 6: Asia Pacific Inulin Market Revenue (Million), by Country 2024 & 2032
- Figure 7: Asia Pacific Inulin Market Revenue Share (%), by Country 2024 & 2032
- Figure 8: South America Inulin Market Revenue (Million), by Country 2024 & 2032
- Figure 9: South America Inulin Market Revenue Share (%), by Country 2024 & 2032
- Figure 10: Middle East and Africa Inulin Market Revenue (Million), by Country 2024 & 2032
- Figure 11: Middle East and Africa Inulin Market Revenue Share (%), by Country 2024 & 2032
- Figure 12: North America Inulin Market Revenue (Million), by Application 2024 & 2032
- Figure 13: North America Inulin Market Revenue Share (%), by Application 2024 & 2032
- Figure 14: North America Inulin Market Revenue (Million), by Country 2024 & 2032
- Figure 15: North America Inulin Market Revenue Share (%), by Country 2024 & 2032
- Figure 16: Europe Inulin Market Revenue (Million), by Application 2024 & 2032
- Figure 17: Europe Inulin Market Revenue Share (%), by Application 2024 & 2032
- Figure 18: Europe Inulin Market Revenue (Million), by Country 2024 & 2032
- Figure 19: Europe Inulin Market Revenue Share (%), by Country 2024 & 2032
- Figure 20: Asia Pacific Inulin Market Revenue (Million), by Application 2024 & 2032
- Figure 21: Asia Pacific Inulin Market Revenue Share (%), by Application 2024 & 2032
- Figure 22: Asia Pacific Inulin Market Revenue (Million), by Country 2024 & 2032
- Figure 23: Asia Pacific Inulin Market Revenue Share (%), by Country 2024 & 2032
- Figure 24: South America Inulin Market Revenue (Million), by Application 2024 & 2032
- Figure 25: South America Inulin Market Revenue Share (%), by Application 2024 & 2032
- Figure 26: South America Inulin Market Revenue (Million), by Country 2024 & 2032
- Figure 27: South America Inulin Market Revenue Share (%), by Country 2024 & 2032
- Figure 28: Middle East and Africa Inulin Market Revenue (Million), by Application 2024 & 2032
- Figure 29: Middle East and Africa Inulin Market Revenue Share (%), by Application 2024 & 2032
- Figure 30: Middle East and Africa Inulin Market Revenue (Million), by Country 2024 & 2032
- Figure 31: Middle East and Africa Inulin Market Revenue Share (%), by Country 2024 & 2032
List of Tables
- Table 1: Global Inulin Market Revenue Million Forecast, by Region 2019 & 2032
- Table 2: Global Inulin Market Revenue Million Forecast, by Application 2019 & 2032
- Table 3: Global Inulin Market Revenue Million Forecast, by Region 2019 & 2032
- Table 4: Global Inulin Market Revenue Million Forecast, by Country 2019 & 2032
- Table 5: United States Inulin Market Revenue (Million) Forecast, by Application 2019 & 2032
- Table 6: Canada Inulin Market Revenue (Million) Forecast, by Application 2019 & 2032
- Table 7: Mexico Inulin Market Revenue (Million) Forecast, by Application 2019 & 2032
- Table 8: Rest of North America Inulin Market Revenue (Million) Forecast, by Application 2019 & 2032
- Table 9: Global Inulin Market Revenue Million Forecast, by Country 2019 & 2032
- Table 10: United Kindgom Inulin Market Revenue (Million) Forecast, by Application 2019 & 2032
- Table 11: France Inulin Market Revenue (Million) Forecast, by Application 2019 & 2032
- Table 12: Germany Inulin Market Revenue (Million) Forecast, by Application 2019 & 2032
- Table 13: Spain Inulin Market Revenue (Million) Forecast, by Application 2019 & 2032
- Table 14: Rest of Europe Inulin Market Revenue (Million) Forecast, by Application 2019 & 2032
- Table 15: Global Inulin Market Revenue Million Forecast, by Country 2019 & 2032
- Table 16: China Inulin Market Revenue (Million) Forecast, by Application 2019 & 2032
- Table 17: Japan Inulin Market Revenue (Million) Forecast, by Application 2019 & 2032
- Table 18: Australia Inulin Market Revenue (Million) Forecast, by Application 2019 & 2032
- Table 19: India Inulin Market Revenue (Million) Forecast, by Application 2019 & 2032
- Table 20: Rest of Asia Pacific Inulin Market Revenue (Million) Forecast, by Application 2019 & 2032
- Table 21: Global Inulin Market Revenue Million Forecast, by Country 2019 & 2032
- Table 22: Brazil Inulin Market Revenue (Million) Forecast, by Application 2019 & 2032
- Table 23: Argentina Inulin Market Revenue (Million) Forecast, by Application 2019 & 2032
- Table 24: Rest of South America Inulin Market Revenue (Million) Forecast, by Application 2019 & 2032
- Table 25: Global Inulin Market Revenue Million Forecast, by Country 2019 & 2032
- Table 26: South Africa Inulin Market Revenue (Million) Forecast, by Application 2019 & 2032
- Table 27: Saudi Arabia Inulin Market Revenue (Million) Forecast, by Application 2019 & 2032
- Table 28: Rest of Middle East and Africa Inulin Market Revenue (Million) Forecast, by Application 2019 & 2032
- Table 29: Global Inulin Market Revenue Million Forecast, by Application 2019 & 2032
- Table 30: Global Inulin Market Revenue Million Forecast, by Country 2019 & 2032
- Table 31: United States Inulin Market Revenue (Million) Forecast, by Application 2019 & 2032
- Table 32: Canada Inulin Market Revenue (Million) Forecast, by Application 2019 & 2032
- Table 33: Mexico Inulin Market Revenue (Million) Forecast, by Application 2019 & 2032
- Table 34: Rest of North America Inulin Market Revenue (Million) Forecast, by Application 2019 & 2032
- Table 35: Global Inulin Market Revenue Million Forecast, by Application 2019 & 2032
- Table 36: Global Inulin Market Revenue Million Forecast, by Country 2019 & 2032
- Table 37: United Kindgom Inulin Market Revenue (Million) Forecast, by Application 2019 & 2032
- Table 38: France Inulin Market Revenue (Million) Forecast, by Application 2019 & 2032
- Table 39: Germany Inulin Market Revenue (Million) Forecast, by Application 2019 & 2032
- Table 40: Spain Inulin Market Revenue (Million) Forecast, by Application 2019 & 2032
- Table 41: Rest of Europe Inulin Market Revenue (Million) Forecast, by Application 2019 & 2032
- Table 42: Global Inulin Market Revenue Million Forecast, by Application 2019 & 2032
- Table 43: Global Inulin Market Revenue Million Forecast, by Country 2019 & 2032
- Table 44: China Inulin Market Revenue (Million) Forecast, by Application 2019 & 2032
- Table 45: Japan Inulin Market Revenue (Million) Forecast, by Application 2019 & 2032
- Table 46: Australia Inulin Market Revenue (Million) Forecast, by Application 2019 & 2032
- Table 47: India Inulin Market Revenue (Million) Forecast, by Application 2019 & 2032
- Table 48: Rest of Asia Pacific Inulin Market Revenue (Million) Forecast, by Application 2019 & 2032
- Table 49: Global Inulin Market Revenue Million Forecast, by Application 2019 & 2032
- Table 50: Global Inulin Market Revenue Million Forecast, by Country 2019 & 2032
- Table 51: Brazil Inulin Market Revenue (Million) Forecast, by Application 2019 & 2032
- Table 52: Argentina Inulin Market Revenue (Million) Forecast, by Application 2019 & 2032
- Table 53: Rest of South America Inulin Market Revenue (Million) Forecast, by Application 2019 & 2032
- Table 54: Global Inulin Market Revenue Million Forecast, by Application 2019 & 2032
- Table 55: Global Inulin Market Revenue Million Forecast, by Country 2019 & 2032
- Table 56: South Africa Inulin Market Revenue (Million) Forecast, by Application 2019 & 2032
- Table 57: Saudi Arabia Inulin Market Revenue (Million) Forecast, by Application 2019 & 2032
- Table 58: Rest of Middle East and Africa Inulin Market Revenue (Million) Forecast, by Application 2019 & 2032
Frequently Asked Questions
1. What is the projected Compound Annual Growth Rate (CAGR) of the Inulin Market?
The projected CAGR is approximately 6.55%.
2. Which companies are prominent players in the Inulin Market?
Key companies in the market include The Tierra Group, Sensus NV, Nova Green Inc, Sudzucker AG (Beneo Remy NV), The Ingredient House (TIH), Ciranda Inc, Adept Impex Private Limited, Cosucra Groupe Warcoing SA, Cargill Inc, The Green Labs LLC*List Not Exhaustive.
3. What are the main segments of the Inulin Market?
The market segments include Application.
4. Can you provide details about the market size?
The market size is estimated to be USD 1.86 Million as of 2022.
5. What are some drivers contributing to market growth?
Wide Applications and Functionality; Demand For Gluten-Free Products.
6. What are the notable trends driving market growth?
Growing Consumers’ Interest in Prebiotics.
7. Are there any restraints impacting market growth?
Easy Availability of Economically Feasible Alternatives.
8. Can you provide examples of recent developments in the market?
March 2022: Sensus, a Dutch co-op member, announced its plans to expand the production of chicory root fiber (inulin) to meet the growing demand for natural prebiotics in plant-based foods and supplements.
9. What pricing options are available for accessing the report?
Pricing options include single-user, multi-user, and enterprise licenses priced at USD 4750, USD 5250, and USD 8750 respectively.
10. Is the market size provided in terms of value or volume?
The market size is provided in terms of value, measured in Million.
11. Are there any specific market keywords associated with the report?
Yes, the market keyword associated with the report is "Inulin Market," which aids in identifying and referencing the specific market segment covered.
12. How do I determine which pricing option suits my needs best?
The pricing options vary based on user requirements and access needs. Individual users may opt for single-user licenses, while businesses requiring broader access may choose multi-user or enterprise licenses for cost-effective access to the report.
13. Are there any additional resources or data provided in the Inulin Market report?
While the report offers comprehensive insights, it's advisable to review the specific contents or supplementary materials provided to ascertain if additional resources or data are available.
14. How can I stay updated on further developments or reports in the Inulin Market?
To stay informed about further developments, trends, and reports in the Inulin Market, consider subscribing to industry newsletters, following relevant companies and organizations, or regularly checking reputable industry news sources and publications.
Methodology
Step 1 - Identification of Relevant Samples Size from Population Database


Step 2 - Approaches for Defining Global Market Size (Value, Volume* & Price*)

Note*: In applicable scenarios
Step 3 - Data Sources
Primary Research
- Web Analytics
- Survey Reports
- Research Institute
- Latest Research Reports
- Opinion Leaders
Secondary Research
- Annual Reports
- White Paper
- Latest Press Release
- Industry Association
- Paid Database
- Investor Presentations

Step 4 - Data Triangulation
Involves using different sources of information in order to increase the validity of a study
These sources are likely to be stakeholders in a program - participants, other researchers, program staff, other community members, and so on.
Then we put all data in single framework & apply various statistical tools to find out the dynamic on the market.
During the analysis stage, feedback from the stakeholder groups would be compared to determine areas of agreement as well as areas of divergence


