


Key Insights
The Intelligent Radiotherapy Positioning Products market is experiencing robust expansion, projected to reach an estimated $115 million by 2025, with a significant Compound Annual Growth Rate (CAGR) of 16.4% during the forecast period of 2025-2033. This impressive growth is fueled by several key drivers, including the increasing incidence of cancer globally, necessitating advanced and precise radiation therapy techniques. The growing demand for highly accurate patient positioning systems to optimize treatment efficacy and minimize side effects is a primary catalyst. Furthermore, technological advancements in imaging, AI integration for enhanced accuracy, and the development of sophisticated tracking systems like respiratory gating and body surface tracking are propelling market adoption. Hospitals and specialized radiology centers are investing heavily in these innovative solutions to improve patient outcomes and streamline radiotherapy workflows, indicating a strong upward trajectory for this segment.

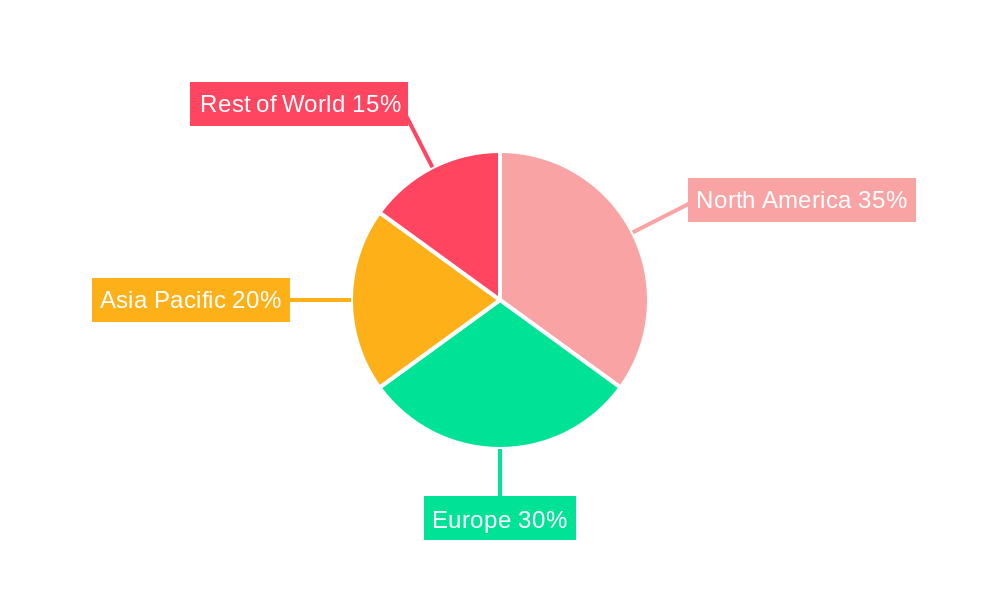
Intelligent Radiotherapy Positioning Products Market Size (In Million)

The market's growth trajectory is further supported by several emerging trends. The increasing adoption of image-guided radiation therapy (IGRT), which relies heavily on precise positioning, is a major trend. Laser light and respiratory gating systems are becoming standard components in modern radiotherapy departments, enhancing the precision of tumor targeting and reducing radiation exposure to healthy tissues. While the market is experiencing substantial growth, it also faces certain restraints. The high initial cost of these advanced systems can be a barrier to adoption, particularly for smaller healthcare facilities. Moreover, the need for specialized training for healthcare professionals to effectively operate and maintain these sophisticated technologies presents a challenge. However, the overarching benefits of improved treatment precision and patient safety are expected to outweigh these restraints, driving sustained market expansion and innovation in the coming years, particularly in regions with well-developed healthcare infrastructures and a high focus on advanced cancer care.

Intelligent Radiotherapy Positioning Products Company Market Share
Intelligent Radiotherapy Positioning Products Market Structure & Competitive Dynamics
The global Intelligent Radiotherapy Positioning Products market exhibits a moderately concentrated structure, with a few key players dominating innovation and market share, including Varian, Brainlab, and LAP. These companies, along with GAMMEX, C-rad, Vision RT, and ANZAI Medical, are instrumental in shaping the competitive landscape through continuous product development and strategic partnerships. The innovation ecosystem is driven by advancements in imaging, AI-powered analytics, and robotic precision, leading to a substantial investment in R&D, estimated to be in the hundreds of millions annually. Regulatory frameworks, particularly those governing medical device approvals, play a crucial role in market entry and product lifecycle management, with stringent compliance requirements. Product substitutes, though present in less advanced positioning techniques, are increasingly being rendered obsolete by the superior accuracy and efficiency offered by intelligent solutions. End-user trends highlight a growing demand for enhanced patient comfort, reduced treatment times, and improved oncological outcomes. Mergers and acquisitions (M&A) are a significant driver of market consolidation and strategic expansion, with deal values in the tens to hundreds of millions of dollars, facilitating technology integration and broader market reach. The market share distribution reflects a dynamic interplay between established giants and agile innovators.
Intelligent Radiotherapy Positioning Products Industry Trends & Insights
The Intelligent Radiotherapy Positioning Products market is poised for robust expansion, fueled by an escalating global cancer burden and the imperative for more precise and personalized radiation therapy. Market growth drivers are multifaceted, encompassing the increasing adoption of advanced radiotherapy techniques like SBRT and IMRT, which necessitate sub-millimeter accuracy in patient positioning. Technological disruptions are at the forefront, with the integration of artificial intelligence (AI) and machine learning (ML) revolutionizing treatment planning and real-time patient monitoring. AI algorithms are enhancing image registration, motion management, and adaptive radiotherapy, leading to more effective and safer treatment delivery. Consumer preferences are shifting towards minimally invasive procedures and improved patient experience, with intelligent positioning systems contributing significantly by reducing setup times and enhancing comfort. The competitive dynamics are characterized by intense R&D investment, strategic collaborations, and a race to secure intellectual property. Companies are focusing on developing solutions that offer superior accuracy, workflow efficiency, and seamless integration with existing oncology treatment platforms. The market penetration of advanced positioning systems is steadily increasing, driven by evidence-based clinical benefits and growing reimbursement policies. The Compound Annual Growth Rate (CAGR) is projected to be in the double digits, estimated between 12% and 18%, over the forecast period. This upward trajectory underscores the transformative impact of these intelligent solutions on modern cancer care. The estimated market size for intelligent radiotherapy positioning products is projected to reach several billion dollars by the end of the forecast period.
Dominant Markets & Segments in Intelligent Radiotherapy Positioning Products
The Hospital segment stands as the dominant force within the Intelligent Radiotherapy Positioning Products market, driven by the centralized nature of cancer treatment infrastructure and the substantial capital investment capabilities of these institutions. Hospitals are equipped with comprehensive radiotherapy departments, offering a full spectrum of cancer care services, from diagnosis to complex treatment protocols. Key drivers for hospital dominance include:
- Advanced Infrastructure: Hospitals invest heavily in cutting-edge radiotherapy equipment, including linear accelerators and CT simulators, which are seamlessly integrated with intelligent positioning systems for optimal patient setup.
- Clinical Expertise & Research: The presence of multidisciplinary oncology teams and research facilities within hospitals fosters the adoption and validation of new positioning technologies.
- Reimbursement Policies: Favorable reimbursement structures for advanced radiotherapy techniques, which rely on precise patient positioning, further incentivize hospital adoption.
- Patient Volume: Hospitals typically manage a higher volume of cancer patients, leading to greater demand for efficient and accurate positioning solutions to optimize treatment throughput.
Within the types of intelligent radiotherapy positioning products, the Respiratory Gating System segment is experiencing significant growth, directly linked to the increasing prevalence of thoracic and abdominal cancers where patient respiratory motion is a critical factor in treatment accuracy.
- Addressing Motion Artifacts: Respiratory gating systems are crucial for minimizing treatment uncertainties caused by involuntary patient breathing, ensuring that radiation is delivered precisely to the tumor target and sparing surrounding healthy tissues.
- Improved Treatment Efficacy: By accurately tracking and compensating for respiratory motion, these systems enable the delivery of higher radiation doses, leading to improved treatment efficacy and better patient outcomes.
- Technological Advancements: Continuous innovation in sensor technology and real-time motion tracking algorithms has made respiratory gating systems more sophisticated and reliable, further driving their adoption.
Regionally, North America, particularly the United States, currently holds the largest market share due to its advanced healthcare infrastructure, high cancer incidence rates, and substantial R&D investments in medical technology. However, the Asia-Pacific region is anticipated to witness the fastest growth, propelled by increasing healthcare expenditure, a rising cancer burden, and the growing adoption of advanced medical technologies in emerging economies.
Intelligent Radiotherapy Positioning Products Product Innovations
Product innovations in Intelligent Radiotherapy Positioning Products are centered on enhancing accuracy, automating workflows, and improving patient comfort. Advancements in body surface tracking systems, leveraging optical and infrared sensors, offer real-time, non-invasive patient monitoring with sub-millimeter precision. Laser light-based positioning systems are becoming more sophisticated, integrating machine vision and AI for automated patient setup verification, significantly reducing manual intervention and setup time. Respiratory gating systems are evolving with AI-driven predictive algorithms, anticipating breathing patterns for proactive motion management. These innovations collectively contribute to faster treatment delivery, reduced radiation exposure to healthy tissues, and improved patient outcomes, providing significant competitive advantages for manufacturers like Vision RT and Brainlab.
Report Segmentation & Scope
This report segments the Intelligent Radiotherapy Positioning Products market based on Application and Type. The Application segmentation includes:
- Hospital: This segment is projected to hold the largest market share, driven by the comprehensive cancer treatment infrastructure and high patient volumes in hospital settings. Growth is propelled by technological integration and the demand for advanced treatment modalities.
- Radiology Center: This segment, while smaller, is expected to exhibit robust growth as specialized centers increasingly adopt advanced radiotherapy techniques and seek efficient positioning solutions.
The Type segmentation comprises:
- Laser Light: This traditional yet evolving type is seeing integration with AI and machine vision for enhanced accuracy and automation.
- Respiratory Gating System: This segment is a key growth driver due to its critical role in managing motion for thoracic and abdominal treatments, with significant market size and projected growth.
- Body Surface Tracking: Leveraging advanced optical and infrared technologies, this segment offers non-invasive, high-precision monitoring and is a rapidly expanding market.
- Other: This category encompasses emerging technologies and niche positioning aids, contributing to the overall market diversification and innovation landscape.
Key Drivers of Intelligent Radiotherapy Positioning Products Growth
The growth of the Intelligent Radiotherapy Positioning Products market is primarily driven by the escalating global incidence of cancer, necessitating more effective and precise treatment modalities. Technological advancements, particularly in artificial intelligence, machine learning, and advanced imaging, are revolutionizing patient positioning, enabling sub-millimeter accuracy and reducing treatment times. The increasing adoption of advanced radiotherapy techniques like SBRT and IMRT, which demand exceptional precision, further propels market expansion. Furthermore, favorable reimbursement policies for complex radiotherapy procedures and a growing emphasis on patient safety and comfort are significant economic and regulatory factors contributing to market growth.
Challenges in the Intelligent Radiotherapy Positioning Products Sector
Despite its promising growth, the Intelligent Radiotherapy Positioning Products sector faces several challenges. High initial investment costs for advanced systems can be a barrier, especially for smaller clinics and in developing economies. Stringent regulatory approval processes for medical devices can lead to prolonged market entry timelines and increased development costs. Ensuring seamless integration of new positioning systems with existing radiotherapy workflows and diverse equipment manufacturers presents technical hurdles. Moreover, the need for continuous training and skill development for healthcare professionals to effectively utilize these sophisticated technologies adds to operational complexities. Supply chain disruptions and the sourcing of specialized components can also impact product availability and lead times.
Leading Players in the Intelligent Radiotherapy Positioning Products Market
- LAP
- GAMMEX
- C-rad
- Brainlab
- Vision RT
- Varian
- ANZAI Medical
Key Developments in Intelligent Radiotherapy Positioning Products Sector
- 2023: Vision RT launched a new generation of its AlignRT system, incorporating advanced AI for enhanced real-time patient positioning.
- 2023: Brainlab announced significant updates to its ExacTrac X-ray tumor tracking system, improving accuracy and workflow efficiency.
- 2023: Varian received FDA clearance for its Ethos therapy system with integrated adaptive radiotherapy capabilities, leveraging advanced positioning.
- 2022: LAP introduced a new laser alignment system with enhanced automation features for improved patient setup times.
- 2021: GAMMEX expanded its portfolio of patient positioning and immobilization devices, complementing intelligent positioning solutions.
- 2020: C-rad unveiled a novel respiratory gating solution designed for enhanced accuracy in complex cases.
- 2019: ANZAI Medical showcased advancements in its surface tracking technology for real-time patient monitoring.
Strategic Intelligent Radiotherapy Positioning Products Market Outlook
The strategic outlook for the Intelligent Radiotherapy Positioning Products market is exceptionally positive, driven by continuous innovation and the growing imperative for precision oncology. Future growth accelerators include the deeper integration of AI for predictive analytics and adaptive treatments, expanding the use of body surface tracking for more personalized patient management, and the development of more cost-effective solutions to enhance market penetration in emerging economies. Strategic opportunities lie in fostering greater interoperability between different oncology platforms, developing robust cybersecurity measures for connected devices, and forging strong partnerships with research institutions to validate the clinical and economic benefits of these advanced technologies. The market is on a trajectory to redefine cancer treatment delivery, offering significant potential for growth and impact.
Intelligent Radiotherapy Positioning Products Segmentation
-
1. Application
- 1.1. Hospital
- 1.2. Radiology Center
-
2. Types
- 2.1. Laser Light
- 2.2. Respiratory Gating System
- 2.3. Body Surface Tracking
- 2.4. Other
Intelligent Radiotherapy Positioning Products Segmentation By Geography
-
1. North America
- 1.1. United States
- 1.2. Canada
- 1.3. Mexico
-
2. South America
- 2.1. Brazil
- 2.2. Argentina
- 2.3. Rest of South America
-
3. Europe
- 3.1. United Kingdom
- 3.2. Germany
- 3.3. France
- 3.4. Italy
- 3.5. Spain
- 3.6. Russia
- 3.7. Benelux
- 3.8. Nordics
- 3.9. Rest of Europe
-
4. Middle East & Africa
- 4.1. Turkey
- 4.2. Israel
- 4.3. GCC
- 4.4. North Africa
- 4.5. South Africa
- 4.6. Rest of Middle East & Africa
-
5. Asia Pacific
- 5.1. China
- 5.2. India
- 5.3. Japan
- 5.4. South Korea
- 5.5. ASEAN
- 5.6. Oceania
- 5.7. Rest of Asia Pacific
Intelligent Radiotherapy Positioning Products Regional Market Share
Geographic Coverage of Intelligent Radiotherapy Positioning Products
Intelligent Radiotherapy Positioning Products REPORT HIGHLIGHTS
| Aspects | Details |
|---|---|
| Study Period | 2020-2034 |
| Base Year | 2025 |
| Estimated Year | 2026 |
| Forecast Period | 2026-2034 |
| Historical Period | 2020-2025 |
| Growth Rate | CAGR of 4.1% from 2020-2034 |
| Segmentation |
|
Table of Contents
- 1. Introduction
- 1.1. Research Scope
- 1.2. Market Segmentation
- 1.3. Research Methodology
- 1.4. Definitions and Assumptions
- 2. Executive Summary
- 2.1. Introduction
- 3. Market Dynamics
- 3.1. Introduction
- 3.2. Market Drivers
- 3.3. Market Restrains
- 3.4. Market Trends
- 4. Market Factor Analysis
- 4.1. Porters Five Forces
- 4.2. Supply/Value Chain
- 4.3. PESTEL analysis
- 4.4. Market Entropy
- 4.5. Patent/Trademark Analysis
- 5. Global Intelligent Radiotherapy Positioning Products Analysis, Insights and Forecast, 2020-2032
- 5.1. Market Analysis, Insights and Forecast - by Application
- 5.1.1. Hospital
- 5.1.2. Radiology Center
- 5.2. Market Analysis, Insights and Forecast - by Types
- 5.2.1. Laser Light
- 5.2.2. Respiratory Gating System
- 5.2.3. Body Surface Tracking
- 5.2.4. Other
- 5.3. Market Analysis, Insights and Forecast - by Region
- 5.3.1. North America
- 5.3.2. South America
- 5.3.3. Europe
- 5.3.4. Middle East & Africa
- 5.3.5. Asia Pacific
- 5.1. Market Analysis, Insights and Forecast - by Application
- 6. North America Intelligent Radiotherapy Positioning Products Analysis, Insights and Forecast, 2020-2032
- 6.1. Market Analysis, Insights and Forecast - by Application
- 6.1.1. Hospital
- 6.1.2. Radiology Center
- 6.2. Market Analysis, Insights and Forecast - by Types
- 6.2.1. Laser Light
- 6.2.2. Respiratory Gating System
- 6.2.3. Body Surface Tracking
- 6.2.4. Other
- 6.1. Market Analysis, Insights and Forecast - by Application
- 7. South America Intelligent Radiotherapy Positioning Products Analysis, Insights and Forecast, 2020-2032
- 7.1. Market Analysis, Insights and Forecast - by Application
- 7.1.1. Hospital
- 7.1.2. Radiology Center
- 7.2. Market Analysis, Insights and Forecast - by Types
- 7.2.1. Laser Light
- 7.2.2. Respiratory Gating System
- 7.2.3. Body Surface Tracking
- 7.2.4. Other
- 7.1. Market Analysis, Insights and Forecast - by Application
- 8. Europe Intelligent Radiotherapy Positioning Products Analysis, Insights and Forecast, 2020-2032
- 8.1. Market Analysis, Insights and Forecast - by Application
- 8.1.1. Hospital
- 8.1.2. Radiology Center
- 8.2. Market Analysis, Insights and Forecast - by Types
- 8.2.1. Laser Light
- 8.2.2. Respiratory Gating System
- 8.2.3. Body Surface Tracking
- 8.2.4. Other
- 8.1. Market Analysis, Insights and Forecast - by Application
- 9. Middle East & Africa Intelligent Radiotherapy Positioning Products Analysis, Insights and Forecast, 2020-2032
- 9.1. Market Analysis, Insights and Forecast - by Application
- 9.1.1. Hospital
- 9.1.2. Radiology Center
- 9.2. Market Analysis, Insights and Forecast - by Types
- 9.2.1. Laser Light
- 9.2.2. Respiratory Gating System
- 9.2.3. Body Surface Tracking
- 9.2.4. Other
- 9.1. Market Analysis, Insights and Forecast - by Application
- 10. Asia Pacific Intelligent Radiotherapy Positioning Products Analysis, Insights and Forecast, 2020-2032
- 10.1. Market Analysis, Insights and Forecast - by Application
- 10.1.1. Hospital
- 10.1.2. Radiology Center
- 10.2. Market Analysis, Insights and Forecast - by Types
- 10.2.1. Laser Light
- 10.2.2. Respiratory Gating System
- 10.2.3. Body Surface Tracking
- 10.2.4. Other
- 10.1. Market Analysis, Insights and Forecast - by Application
- 11. Competitive Analysis
- 11.1. Global Market Share Analysis 2025
- 11.2. Company Profiles
- 11.2.1 LAP
- 11.2.1.1. Overview
- 11.2.1.2. Products
- 11.2.1.3. SWOT Analysis
- 11.2.1.4. Recent Developments
- 11.2.1.5. Financials (Based on Availability)
- 11.2.2 GAMMEX
- 11.2.2.1. Overview
- 11.2.2.2. Products
- 11.2.2.3. SWOT Analysis
- 11.2.2.4. Recent Developments
- 11.2.2.5. Financials (Based on Availability)
- 11.2.3 C-rad
- 11.2.3.1. Overview
- 11.2.3.2. Products
- 11.2.3.3. SWOT Analysis
- 11.2.3.4. Recent Developments
- 11.2.3.5. Financials (Based on Availability)
- 11.2.4 Brainlab
- 11.2.4.1. Overview
- 11.2.4.2. Products
- 11.2.4.3. SWOT Analysis
- 11.2.4.4. Recent Developments
- 11.2.4.5. Financials (Based on Availability)
- 11.2.5 Vision RT
- 11.2.5.1. Overview
- 11.2.5.2. Products
- 11.2.5.3. SWOT Analysis
- 11.2.5.4. Recent Developments
- 11.2.5.5. Financials (Based on Availability)
- 11.2.6 Varian
- 11.2.6.1. Overview
- 11.2.6.2. Products
- 11.2.6.3. SWOT Analysis
- 11.2.6.4. Recent Developments
- 11.2.6.5. Financials (Based on Availability)
- 11.2.7 ANZAI Medical
- 11.2.7.1. Overview
- 11.2.7.2. Products
- 11.2.7.3. SWOT Analysis
- 11.2.7.4. Recent Developments
- 11.2.7.5. Financials (Based on Availability)
- 11.2.1 LAP
List of Figures
- Figure 1: Global Intelligent Radiotherapy Positioning Products Revenue Breakdown (undefined, %) by Region 2025 & 2033
- Figure 2: Global Intelligent Radiotherapy Positioning Products Volume Breakdown (K, %) by Region 2025 & 2033
- Figure 3: North America Intelligent Radiotherapy Positioning Products Revenue (undefined), by Application 2025 & 2033
- Figure 4: North America Intelligent Radiotherapy Positioning Products Volume (K), by Application 2025 & 2033
- Figure 5: North America Intelligent Radiotherapy Positioning Products Revenue Share (%), by Application 2025 & 2033
- Figure 6: North America Intelligent Radiotherapy Positioning Products Volume Share (%), by Application 2025 & 2033
- Figure 7: North America Intelligent Radiotherapy Positioning Products Revenue (undefined), by Types 2025 & 2033
- Figure 8: North America Intelligent Radiotherapy Positioning Products Volume (K), by Types 2025 & 2033
- Figure 9: North America Intelligent Radiotherapy Positioning Products Revenue Share (%), by Types 2025 & 2033
- Figure 10: North America Intelligent Radiotherapy Positioning Products Volume Share (%), by Types 2025 & 2033
- Figure 11: North America Intelligent Radiotherapy Positioning Products Revenue (undefined), by Country 2025 & 2033
- Figure 12: North America Intelligent Radiotherapy Positioning Products Volume (K), by Country 2025 & 2033
- Figure 13: North America Intelligent Radiotherapy Positioning Products Revenue Share (%), by Country 2025 & 2033
- Figure 14: North America Intelligent Radiotherapy Positioning Products Volume Share (%), by Country 2025 & 2033
- Figure 15: South America Intelligent Radiotherapy Positioning Products Revenue (undefined), by Application 2025 & 2033
- Figure 16: South America Intelligent Radiotherapy Positioning Products Volume (K), by Application 2025 & 2033
- Figure 17: South America Intelligent Radiotherapy Positioning Products Revenue Share (%), by Application 2025 & 2033
- Figure 18: South America Intelligent Radiotherapy Positioning Products Volume Share (%), by Application 2025 & 2033
- Figure 19: South America Intelligent Radiotherapy Positioning Products Revenue (undefined), by Types 2025 & 2033
- Figure 20: South America Intelligent Radiotherapy Positioning Products Volume (K), by Types 2025 & 2033
- Figure 21: South America Intelligent Radiotherapy Positioning Products Revenue Share (%), by Types 2025 & 2033
- Figure 22: South America Intelligent Radiotherapy Positioning Products Volume Share (%), by Types 2025 & 2033
- Figure 23: South America Intelligent Radiotherapy Positioning Products Revenue (undefined), by Country 2025 & 2033
- Figure 24: South America Intelligent Radiotherapy Positioning Products Volume (K), by Country 2025 & 2033
- Figure 25: South America Intelligent Radiotherapy Positioning Products Revenue Share (%), by Country 2025 & 2033
- Figure 26: South America Intelligent Radiotherapy Positioning Products Volume Share (%), by Country 2025 & 2033
- Figure 27: Europe Intelligent Radiotherapy Positioning Products Revenue (undefined), by Application 2025 & 2033
- Figure 28: Europe Intelligent Radiotherapy Positioning Products Volume (K), by Application 2025 & 2033
- Figure 29: Europe Intelligent Radiotherapy Positioning Products Revenue Share (%), by Application 2025 & 2033
- Figure 30: Europe Intelligent Radiotherapy Positioning Products Volume Share (%), by Application 2025 & 2033
- Figure 31: Europe Intelligent Radiotherapy Positioning Products Revenue (undefined), by Types 2025 & 2033
- Figure 32: Europe Intelligent Radiotherapy Positioning Products Volume (K), by Types 2025 & 2033
- Figure 33: Europe Intelligent Radiotherapy Positioning Products Revenue Share (%), by Types 2025 & 2033
- Figure 34: Europe Intelligent Radiotherapy Positioning Products Volume Share (%), by Types 2025 & 2033
- Figure 35: Europe Intelligent Radiotherapy Positioning Products Revenue (undefined), by Country 2025 & 2033
- Figure 36: Europe Intelligent Radiotherapy Positioning Products Volume (K), by Country 2025 & 2033
- Figure 37: Europe Intelligent Radiotherapy Positioning Products Revenue Share (%), by Country 2025 & 2033
- Figure 38: Europe Intelligent Radiotherapy Positioning Products Volume Share (%), by Country 2025 & 2033
- Figure 39: Middle East & Africa Intelligent Radiotherapy Positioning Products Revenue (undefined), by Application 2025 & 2033
- Figure 40: Middle East & Africa Intelligent Radiotherapy Positioning Products Volume (K), by Application 2025 & 2033
- Figure 41: Middle East & Africa Intelligent Radiotherapy Positioning Products Revenue Share (%), by Application 2025 & 2033
- Figure 42: Middle East & Africa Intelligent Radiotherapy Positioning Products Volume Share (%), by Application 2025 & 2033
- Figure 43: Middle East & Africa Intelligent Radiotherapy Positioning Products Revenue (undefined), by Types 2025 & 2033
- Figure 44: Middle East & Africa Intelligent Radiotherapy Positioning Products Volume (K), by Types 2025 & 2033
- Figure 45: Middle East & Africa Intelligent Radiotherapy Positioning Products Revenue Share (%), by Types 2025 & 2033
- Figure 46: Middle East & Africa Intelligent Radiotherapy Positioning Products Volume Share (%), by Types 2025 & 2033
- Figure 47: Middle East & Africa Intelligent Radiotherapy Positioning Products Revenue (undefined), by Country 2025 & 2033
- Figure 48: Middle East & Africa Intelligent Radiotherapy Positioning Products Volume (K), by Country 2025 & 2033
- Figure 49: Middle East & Africa Intelligent Radiotherapy Positioning Products Revenue Share (%), by Country 2025 & 2033
- Figure 50: Middle East & Africa Intelligent Radiotherapy Positioning Products Volume Share (%), by Country 2025 & 2033
- Figure 51: Asia Pacific Intelligent Radiotherapy Positioning Products Revenue (undefined), by Application 2025 & 2033
- Figure 52: Asia Pacific Intelligent Radiotherapy Positioning Products Volume (K), by Application 2025 & 2033
- Figure 53: Asia Pacific Intelligent Radiotherapy Positioning Products Revenue Share (%), by Application 2025 & 2033
- Figure 54: Asia Pacific Intelligent Radiotherapy Positioning Products Volume Share (%), by Application 2025 & 2033
- Figure 55: Asia Pacific Intelligent Radiotherapy Positioning Products Revenue (undefined), by Types 2025 & 2033
- Figure 56: Asia Pacific Intelligent Radiotherapy Positioning Products Volume (K), by Types 2025 & 2033
- Figure 57: Asia Pacific Intelligent Radiotherapy Positioning Products Revenue Share (%), by Types 2025 & 2033
- Figure 58: Asia Pacific Intelligent Radiotherapy Positioning Products Volume Share (%), by Types 2025 & 2033
- Figure 59: Asia Pacific Intelligent Radiotherapy Positioning Products Revenue (undefined), by Country 2025 & 2033
- Figure 60: Asia Pacific Intelligent Radiotherapy Positioning Products Volume (K), by Country 2025 & 2033
- Figure 61: Asia Pacific Intelligent Radiotherapy Positioning Products Revenue Share (%), by Country 2025 & 2033
- Figure 62: Asia Pacific Intelligent Radiotherapy Positioning Products Volume Share (%), by Country 2025 & 2033
List of Tables
- Table 1: Global Intelligent Radiotherapy Positioning Products Revenue undefined Forecast, by Application 2020 & 2033
- Table 2: Global Intelligent Radiotherapy Positioning Products Volume K Forecast, by Application 2020 & 2033
- Table 3: Global Intelligent Radiotherapy Positioning Products Revenue undefined Forecast, by Types 2020 & 2033
- Table 4: Global Intelligent Radiotherapy Positioning Products Volume K Forecast, by Types 2020 & 2033
- Table 5: Global Intelligent Radiotherapy Positioning Products Revenue undefined Forecast, by Region 2020 & 2033
- Table 6: Global Intelligent Radiotherapy Positioning Products Volume K Forecast, by Region 2020 & 2033
- Table 7: Global Intelligent Radiotherapy Positioning Products Revenue undefined Forecast, by Application 2020 & 2033
- Table 8: Global Intelligent Radiotherapy Positioning Products Volume K Forecast, by Application 2020 & 2033
- Table 9: Global Intelligent Radiotherapy Positioning Products Revenue undefined Forecast, by Types 2020 & 2033
- Table 10: Global Intelligent Radiotherapy Positioning Products Volume K Forecast, by Types 2020 & 2033
- Table 11: Global Intelligent Radiotherapy Positioning Products Revenue undefined Forecast, by Country 2020 & 2033
- Table 12: Global Intelligent Radiotherapy Positioning Products Volume K Forecast, by Country 2020 & 2033
- Table 13: United States Intelligent Radiotherapy Positioning Products Revenue (undefined) Forecast, by Application 2020 & 2033
- Table 14: United States Intelligent Radiotherapy Positioning Products Volume (K) Forecast, by Application 2020 & 2033
- Table 15: Canada Intelligent Radiotherapy Positioning Products Revenue (undefined) Forecast, by Application 2020 & 2033
- Table 16: Canada Intelligent Radiotherapy Positioning Products Volume (K) Forecast, by Application 2020 & 2033
- Table 17: Mexico Intelligent Radiotherapy Positioning Products Revenue (undefined) Forecast, by Application 2020 & 2033
- Table 18: Mexico Intelligent Radiotherapy Positioning Products Volume (K) Forecast, by Application 2020 & 2033
- Table 19: Global Intelligent Radiotherapy Positioning Products Revenue undefined Forecast, by Application 2020 & 2033
- Table 20: Global Intelligent Radiotherapy Positioning Products Volume K Forecast, by Application 2020 & 2033
- Table 21: Global Intelligent Radiotherapy Positioning Products Revenue undefined Forecast, by Types 2020 & 2033
- Table 22: Global Intelligent Radiotherapy Positioning Products Volume K Forecast, by Types 2020 & 2033
- Table 23: Global Intelligent Radiotherapy Positioning Products Revenue undefined Forecast, by Country 2020 & 2033
- Table 24: Global Intelligent Radiotherapy Positioning Products Volume K Forecast, by Country 2020 & 2033
- Table 25: Brazil Intelligent Radiotherapy Positioning Products Revenue (undefined) Forecast, by Application 2020 & 2033
- Table 26: Brazil Intelligent Radiotherapy Positioning Products Volume (K) Forecast, by Application 2020 & 2033
- Table 27: Argentina Intelligent Radiotherapy Positioning Products Revenue (undefined) Forecast, by Application 2020 & 2033
- Table 28: Argentina Intelligent Radiotherapy Positioning Products Volume (K) Forecast, by Application 2020 & 2033
- Table 29: Rest of South America Intelligent Radiotherapy Positioning Products Revenue (undefined) Forecast, by Application 2020 & 2033
- Table 30: Rest of South America Intelligent Radiotherapy Positioning Products Volume (K) Forecast, by Application 2020 & 2033
- Table 31: Global Intelligent Radiotherapy Positioning Products Revenue undefined Forecast, by Application 2020 & 2033
- Table 32: Global Intelligent Radiotherapy Positioning Products Volume K Forecast, by Application 2020 & 2033
- Table 33: Global Intelligent Radiotherapy Positioning Products Revenue undefined Forecast, by Types 2020 & 2033
- Table 34: Global Intelligent Radiotherapy Positioning Products Volume K Forecast, by Types 2020 & 2033
- Table 35: Global Intelligent Radiotherapy Positioning Products Revenue undefined Forecast, by Country 2020 & 2033
- Table 36: Global Intelligent Radiotherapy Positioning Products Volume K Forecast, by Country 2020 & 2033
- Table 37: United Kingdom Intelligent Radiotherapy Positioning Products Revenue (undefined) Forecast, by Application 2020 & 2033
- Table 38: United Kingdom Intelligent Radiotherapy Positioning Products Volume (K) Forecast, by Application 2020 & 2033
- Table 39: Germany Intelligent Radiotherapy Positioning Products Revenue (undefined) Forecast, by Application 2020 & 2033
- Table 40: Germany Intelligent Radiotherapy Positioning Products Volume (K) Forecast, by Application 2020 & 2033
- Table 41: France Intelligent Radiotherapy Positioning Products Revenue (undefined) Forecast, by Application 2020 & 2033
- Table 42: France Intelligent Radiotherapy Positioning Products Volume (K) Forecast, by Application 2020 & 2033
- Table 43: Italy Intelligent Radiotherapy Positioning Products Revenue (undefined) Forecast, by Application 2020 & 2033
- Table 44: Italy Intelligent Radiotherapy Positioning Products Volume (K) Forecast, by Application 2020 & 2033
- Table 45: Spain Intelligent Radiotherapy Positioning Products Revenue (undefined) Forecast, by Application 2020 & 2033
- Table 46: Spain Intelligent Radiotherapy Positioning Products Volume (K) Forecast, by Application 2020 & 2033
- Table 47: Russia Intelligent Radiotherapy Positioning Products Revenue (undefined) Forecast, by Application 2020 & 2033
- Table 48: Russia Intelligent Radiotherapy Positioning Products Volume (K) Forecast, by Application 2020 & 2033
- Table 49: Benelux Intelligent Radiotherapy Positioning Products Revenue (undefined) Forecast, by Application 2020 & 2033
- Table 50: Benelux Intelligent Radiotherapy Positioning Products Volume (K) Forecast, by Application 2020 & 2033
- Table 51: Nordics Intelligent Radiotherapy Positioning Products Revenue (undefined) Forecast, by Application 2020 & 2033
- Table 52: Nordics Intelligent Radiotherapy Positioning Products Volume (K) Forecast, by Application 2020 & 2033
- Table 53: Rest of Europe Intelligent Radiotherapy Positioning Products Revenue (undefined) Forecast, by Application 2020 & 2033
- Table 54: Rest of Europe Intelligent Radiotherapy Positioning Products Volume (K) Forecast, by Application 2020 & 2033
- Table 55: Global Intelligent Radiotherapy Positioning Products Revenue undefined Forecast, by Application 2020 & 2033
- Table 56: Global Intelligent Radiotherapy Positioning Products Volume K Forecast, by Application 2020 & 2033
- Table 57: Global Intelligent Radiotherapy Positioning Products Revenue undefined Forecast, by Types 2020 & 2033
- Table 58: Global Intelligent Radiotherapy Positioning Products Volume K Forecast, by Types 2020 & 2033
- Table 59: Global Intelligent Radiotherapy Positioning Products Revenue undefined Forecast, by Country 2020 & 2033
- Table 60: Global Intelligent Radiotherapy Positioning Products Volume K Forecast, by Country 2020 & 2033
- Table 61: Turkey Intelligent Radiotherapy Positioning Products Revenue (undefined) Forecast, by Application 2020 & 2033
- Table 62: Turkey Intelligent Radiotherapy Positioning Products Volume (K) Forecast, by Application 2020 & 2033
- Table 63: Israel Intelligent Radiotherapy Positioning Products Revenue (undefined) Forecast, by Application 2020 & 2033
- Table 64: Israel Intelligent Radiotherapy Positioning Products Volume (K) Forecast, by Application 2020 & 2033
- Table 65: GCC Intelligent Radiotherapy Positioning Products Revenue (undefined) Forecast, by Application 2020 & 2033
- Table 66: GCC Intelligent Radiotherapy Positioning Products Volume (K) Forecast, by Application 2020 & 2033
- Table 67: North Africa Intelligent Radiotherapy Positioning Products Revenue (undefined) Forecast, by Application 2020 & 2033
- Table 68: North Africa Intelligent Radiotherapy Positioning Products Volume (K) Forecast, by Application 2020 & 2033
- Table 69: South Africa Intelligent Radiotherapy Positioning Products Revenue (undefined) Forecast, by Application 2020 & 2033
- Table 70: South Africa Intelligent Radiotherapy Positioning Products Volume (K) Forecast, by Application 2020 & 2033
- Table 71: Rest of Middle East & Africa Intelligent Radiotherapy Positioning Products Revenue (undefined) Forecast, by Application 2020 & 2033
- Table 72: Rest of Middle East & Africa Intelligent Radiotherapy Positioning Products Volume (K) Forecast, by Application 2020 & 2033
- Table 73: Global Intelligent Radiotherapy Positioning Products Revenue undefined Forecast, by Application 2020 & 2033
- Table 74: Global Intelligent Radiotherapy Positioning Products Volume K Forecast, by Application 2020 & 2033
- Table 75: Global Intelligent Radiotherapy Positioning Products Revenue undefined Forecast, by Types 2020 & 2033
- Table 76: Global Intelligent Radiotherapy Positioning Products Volume K Forecast, by Types 2020 & 2033
- Table 77: Global Intelligent Radiotherapy Positioning Products Revenue undefined Forecast, by Country 2020 & 2033
- Table 78: Global Intelligent Radiotherapy Positioning Products Volume K Forecast, by Country 2020 & 2033
- Table 79: China Intelligent Radiotherapy Positioning Products Revenue (undefined) Forecast, by Application 2020 & 2033
- Table 80: China Intelligent Radiotherapy Positioning Products Volume (K) Forecast, by Application 2020 & 2033
- Table 81: India Intelligent Radiotherapy Positioning Products Revenue (undefined) Forecast, by Application 2020 & 2033
- Table 82: India Intelligent Radiotherapy Positioning Products Volume (K) Forecast, by Application 2020 & 2033
- Table 83: Japan Intelligent Radiotherapy Positioning Products Revenue (undefined) Forecast, by Application 2020 & 2033
- Table 84: Japan Intelligent Radiotherapy Positioning Products Volume (K) Forecast, by Application 2020 & 2033
- Table 85: South Korea Intelligent Radiotherapy Positioning Products Revenue (undefined) Forecast, by Application 2020 & 2033
- Table 86: South Korea Intelligent Radiotherapy Positioning Products Volume (K) Forecast, by Application 2020 & 2033
- Table 87: ASEAN Intelligent Radiotherapy Positioning Products Revenue (undefined) Forecast, by Application 2020 & 2033
- Table 88: ASEAN Intelligent Radiotherapy Positioning Products Volume (K) Forecast, by Application 2020 & 2033
- Table 89: Oceania Intelligent Radiotherapy Positioning Products Revenue (undefined) Forecast, by Application 2020 & 2033
- Table 90: Oceania Intelligent Radiotherapy Positioning Products Volume (K) Forecast, by Application 2020 & 2033
- Table 91: Rest of Asia Pacific Intelligent Radiotherapy Positioning Products Revenue (undefined) Forecast, by Application 2020 & 2033
- Table 92: Rest of Asia Pacific Intelligent Radiotherapy Positioning Products Volume (K) Forecast, by Application 2020 & 2033
Frequently Asked Questions
1. What is the projected Compound Annual Growth Rate (CAGR) of the Intelligent Radiotherapy Positioning Products?
The projected CAGR is approximately 4.1%.
2. Which companies are prominent players in the Intelligent Radiotherapy Positioning Products?
Key companies in the market include LAP, GAMMEX, C-rad, Brainlab, Vision RT, Varian, ANZAI Medical.
3. What are the main segments of the Intelligent Radiotherapy Positioning Products?
The market segments include Application, Types.
4. Can you provide details about the market size?
The market size is estimated to be USD XXX N/A as of 2022.
5. What are some drivers contributing to market growth?
N/A
6. What are the notable trends driving market growth?
N/A
7. Are there any restraints impacting market growth?
N/A
8. Can you provide examples of recent developments in the market?
N/A
9. What pricing options are available for accessing the report?
Pricing options include single-user, multi-user, and enterprise licenses priced at USD 4350.00, USD 6525.00, and USD 8700.00 respectively.
10. Is the market size provided in terms of value or volume?
The market size is provided in terms of value, measured in N/A and volume, measured in K.
11. Are there any specific market keywords associated with the report?
Yes, the market keyword associated with the report is "Intelligent Radiotherapy Positioning Products," which aids in identifying and referencing the specific market segment covered.
12. How do I determine which pricing option suits my needs best?
The pricing options vary based on user requirements and access needs. Individual users may opt for single-user licenses, while businesses requiring broader access may choose multi-user or enterprise licenses for cost-effective access to the report.
13. Are there any additional resources or data provided in the Intelligent Radiotherapy Positioning Products report?
While the report offers comprehensive insights, it's advisable to review the specific contents or supplementary materials provided to ascertain if additional resources or data are available.
14. How can I stay updated on further developments or reports in the Intelligent Radiotherapy Positioning Products?
To stay informed about further developments, trends, and reports in the Intelligent Radiotherapy Positioning Products, consider subscribing to industry newsletters, following relevant companies and organizations, or regularly checking reputable industry news sources and publications.
Methodology
Step 1 - Identification of Relevant Samples Size from Population Database


Step 2 - Approaches for Defining Global Market Size (Value, Volume* & Price*)

Note*: In applicable scenarios
Step 3 - Data Sources
Primary Research
- Web Analytics
- Survey Reports
- Research Institute
- Latest Research Reports
- Opinion Leaders
Secondary Research
- Annual Reports
- White Paper
- Latest Press Release
- Industry Association
- Paid Database
- Investor Presentations

Step 4 - Data Triangulation
Involves using different sources of information in order to increase the validity of a study
These sources are likely to be stakeholders in a program - participants, other researchers, program staff, other community members, and so on.
Then we put all data in single framework & apply various statistical tools to find out the dynamic on the market.
During the analysis stage, feedback from the stakeholder groups would be compared to determine areas of agreement as well as areas of divergence