Key Insights
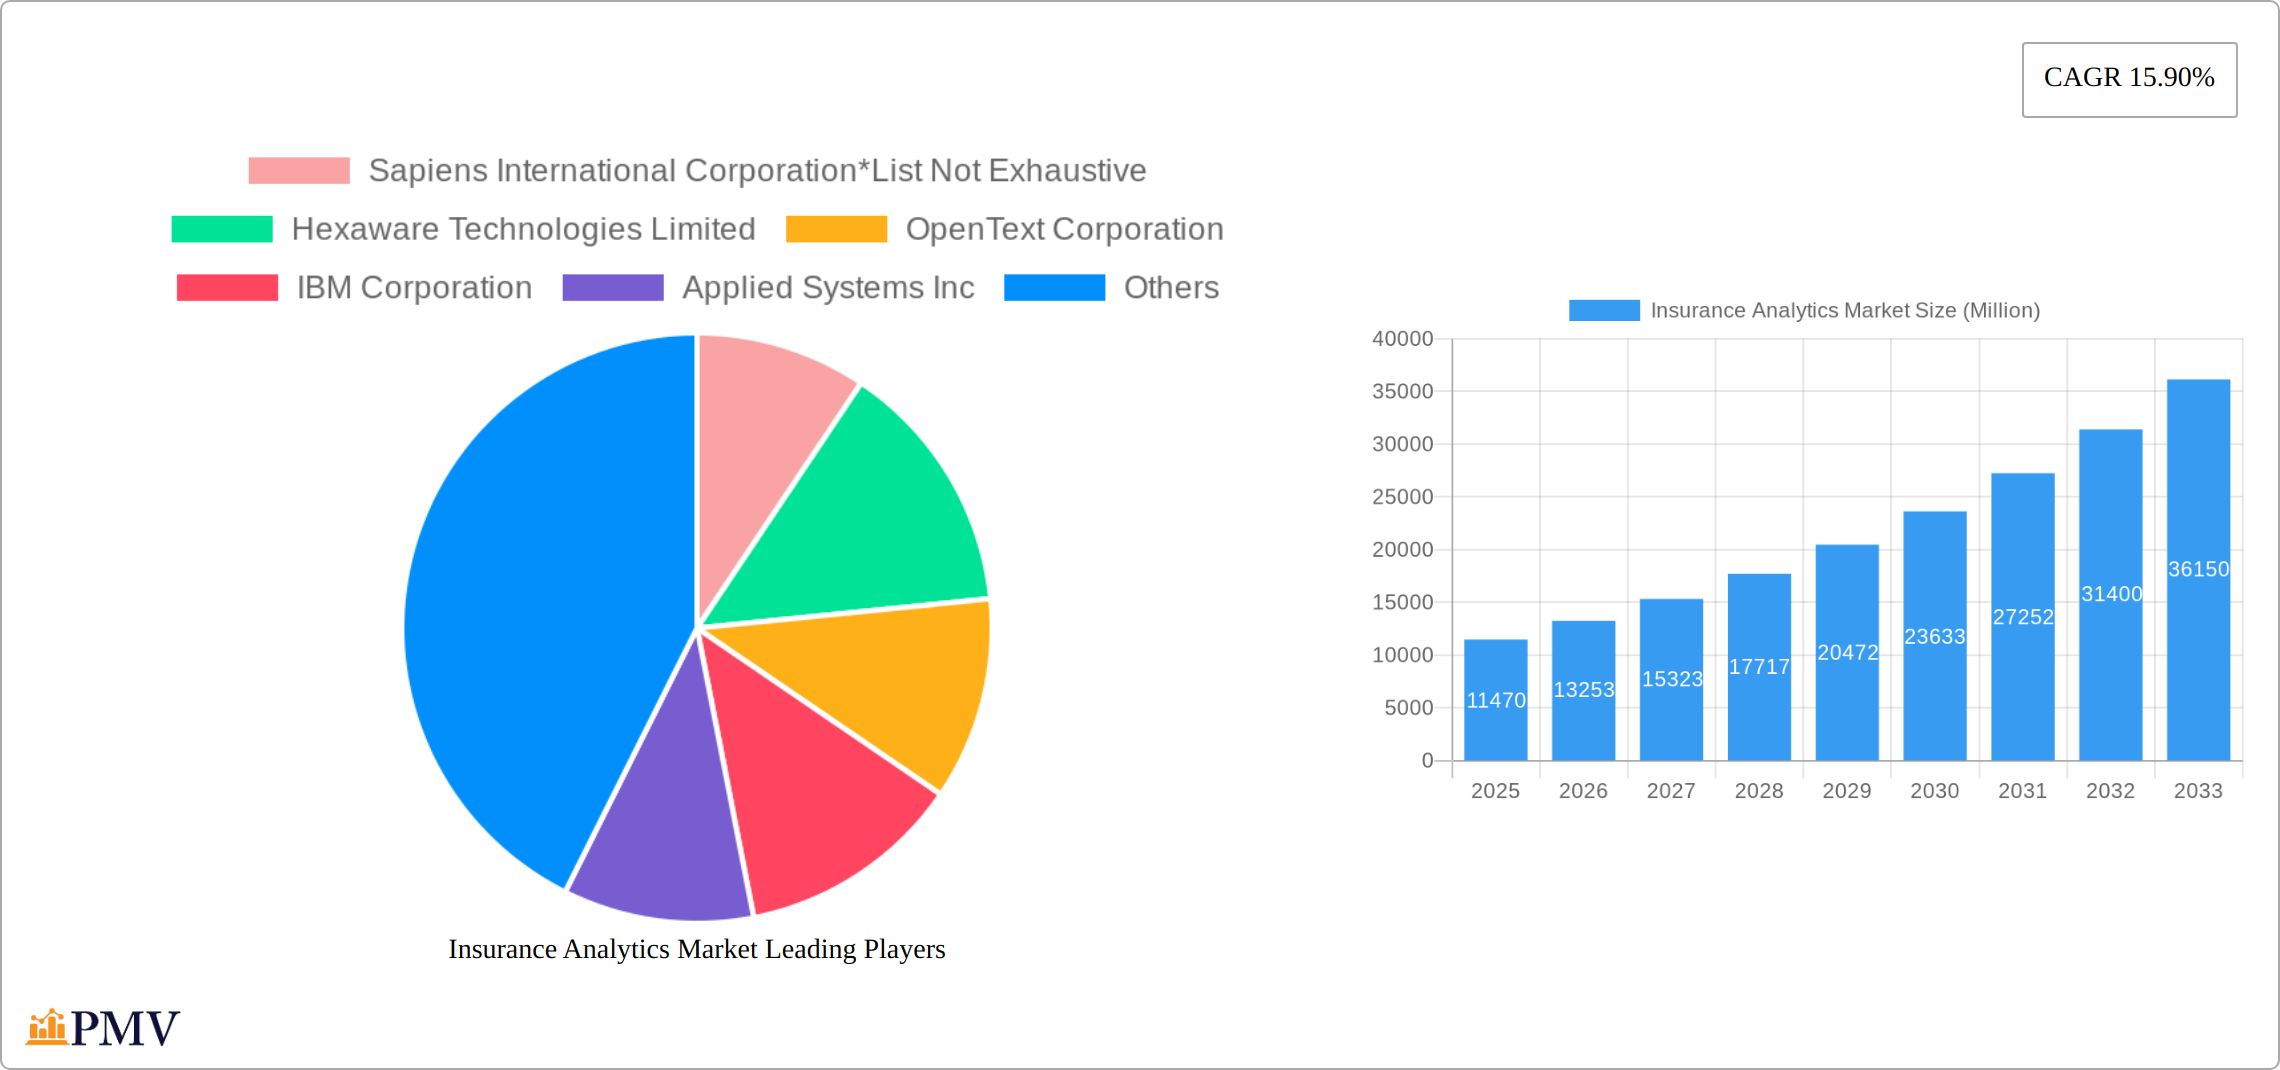
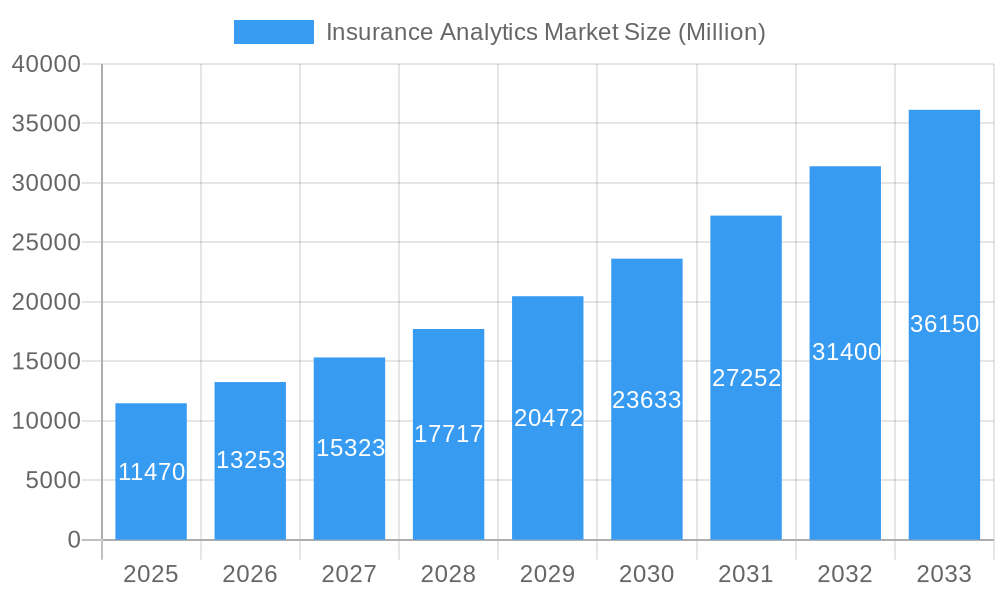
The Insurance Analytics market is experiencing robust growth, projected to reach \$11.47 billion in 2025 and exhibiting a Compound Annual Growth Rate (CAGR) of 15.90% from 2025 to 2033. This expansion is driven by several key factors. Increasing regulatory scrutiny necessitates robust risk management and compliance, fueling demand for advanced analytics solutions. Simultaneously, the insurance industry is undergoing a digital transformation, with insurers leveraging data-driven insights for improved claims management, personalized customer experiences, and streamlined operational processes. The shift towards cloud-based deployments further accelerates market growth, offering scalability, cost-effectiveness, and enhanced accessibility. Specific applications like fraud detection, predictive modeling for underwriting, and customer segmentation are significant drivers. While data security and integration complexities present some challenges, the overall market trajectory remains strongly positive.
Insurance Analytics Market Market Size (In Billion)
The market segmentation reveals a diverse landscape. The cloud-based deployment model is expected to capture a significant market share due to its inherent advantages. Within business applications, claims management and risk management currently dominate, reflecting the immediate needs of insurers. However, the increasing focus on personalized customer experiences is driving growth in customer management and personalization segments. Leading vendors such as Sapiens, Hexaware, OpenText, IBM, and Guidewire are actively shaping the market through continuous innovation and strategic partnerships. Geographically, North America is currently the largest market, but the Asia-Pacific region is projected to witness the fastest growth, fueled by rapid digitalization and increasing insurance penetration. This dynamic interplay of technological advancements, regulatory pressures, and evolving customer expectations ensures sustained expansion in the Insurance Analytics market throughout the forecast period.
Insurance Analytics Market Company Market Share
Insurance Analytics Market: A Comprehensive Report (2019-2033)
This in-depth report provides a comprehensive analysis of the Insurance Analytics Market, offering invaluable insights for stakeholders across the insurance ecosystem. Covering the period from 2019 to 2033, with a focus on 2025, this report unveils market dynamics, growth drivers, competitive landscapes, and future projections. The report is meticulously structured to deliver actionable intelligence, encompassing market segmentation, key player analysis, and emerging trends. The projected market size by 2033 is estimated at xx Million.
Insurance Analytics Market Structure & Competitive Dynamics
The Insurance Analytics market exhibits a moderately concentrated structure, with several large players commanding significant market share. However, the presence of numerous smaller, specialized firms fosters a dynamic competitive landscape. Innovation ecosystems are robust, driven by advancements in AI, machine learning, and big data technologies. Regulatory frameworks, such as GDPR and CCPA, significantly impact data privacy and security practices, shaping the market's operational dynamics. Product substitutes are limited, with the core value proposition centered on data-driven decision-making and risk mitigation. End-user trends reflect a growing preference for cloud-based solutions and integrated platforms offering comprehensive analytical capabilities. Mergers and acquisitions (M&A) activities are frequent, with deal values averaging xx Million in recent years, reflecting consolidation and expansion efforts. Key M&A activities include [Insert details of specific M&A activities if data is available, otherwise remove this sentence and the subsequent bullet point].
- Market Share: Top 5 players collectively hold an estimated xx% market share in 2025.
- M&A Deal Values (Avg.): xx Million (2021-2024)
- Innovation Focus: AI-powered claims processing, predictive modeling, and personalized customer experiences.
Insurance Analytics Market Industry Trends & Insights
The Insurance Analytics market is experiencing robust growth, driven by several key factors. The increasing volume and complexity of insurance data necessitate sophisticated analytical tools to manage risk, improve operational efficiency, and enhance customer experience. The rising adoption of cloud computing is enabling scalable and cost-effective deployment of analytics solutions, fueling market expansion. Technological advancements, such as AI and machine learning, are enhancing the predictive capabilities of insurance analytics, enabling more accurate risk assessment and personalized offerings. Consumer preferences are shifting towards personalized insurance products and seamless digital experiences, further driving demand for sophisticated analytics solutions. The market is witnessing a significant shift towards proactive risk management, leveraging predictive analytics to mitigate potential losses. This trend is contributing to a Compound Annual Growth Rate (CAGR) of xx% during the forecast period (2025-2033). Market penetration is high in developed economies, but significant growth potential remains in emerging markets.
Dominant Markets & Segments in Insurance Analytics Market
The North American insurance analytics market currently holds a leading position, fueled by high technological adoption rates, robust data infrastructure, and a well-established insurance sector. However, the Asia-Pacific region exhibits substantial growth potential, driven by accelerating digitalization and a surge in demand for sophisticated insurance solutions. This dynamic landscape is further shaped by the increasing adoption of advanced technologies like artificial intelligence (AI) and machine learning (ML) to enhance efficiency and decision-making.
By Component:
- Tools: This segment commands a significant market share due to the considerable demand for specialized software and applications designed for advanced data analysis, predictive modeling, and insightful data visualization. The availability of user-friendly, scalable tools is a key factor driving growth.
- Services: The services segment is experiencing robust growth, driven by the increasing outsourcing of analytics functions to specialized firms. This trend is fueled by the need for expert consulting, implementation support, and ongoing maintenance of analytics solutions, allowing insurance companies to focus on their core business operations.
By Business Application:
- Claims Management: This segment witnesses rapid growth as insurers leverage analytics to automate and streamline claims processing, leading to significant cost reductions, faster claim resolutions, and improved customer satisfaction. Fraud detection and prevention are also key drivers within this segment.
- Risk Management: The ever-increasing complexity of risk profiles, including climate change and evolving societal trends, necessitates sophisticated risk management solutions. Insurance analytics empowers insurers to better assess, quantify, and mitigate risks, leading to more accurate pricing and improved underwriting decisions.
- Process Optimization: Insurers are aggressively seeking to optimize operational efficiency across all aspects of their business. Analytics helps identify bottlenecks, streamline workflows, and automate repetitive tasks, leading to significant cost savings and enhanced productivity.
- Customer Management and Personalization: The demand for personalized customer experiences continues to rise. Insurance analytics enables insurers to create tailored product offerings, improve customer communication, and enhance customer retention through data-driven insights into individual customer needs and preferences.
By Deployment Mode:
- Cloud: Cloud-based solutions are rapidly gaining traction due to their inherent scalability, flexibility, cost-effectiveness, and ease of access to advanced analytics capabilities. The pay-as-you-go model also appeals to insurers of varying sizes.
- On-premise: On-premise deployments retain a substantial market share, particularly among insurers with stringent data security and compliance requirements, or those dealing with highly sensitive data.
By End-User:
- Insurance Companies: This segment constitutes the primary market driver, with a high demand for cutting-edge analytics capabilities to enhance operational efficiency, manage risks effectively, and improve decision-making across all business functions.
- Government Agencies: Government agencies utilize insurance analytics for regulatory oversight, risk assessment, fraud detection, and the development of effective public policy related to insurance markets.
- Third-party Administrators (TPAs): TPAs leverage analytics to optimize their services, enhance efficiency, improve claims processing, and provide better value to their insurance clients.
- Brokers and Consultancies: These intermediaries play a vital role in the insurance ecosystem, often incorporating analytical tools and insights into their client solutions, advising on strategic technology adoption and helping insurers make data-driven decisions.
Insurance Analytics Market Product Innovations
Recent advancements in AI, machine learning, and cloud computing have spurred significant product innovations in the Insurance Analytics market. New solutions offer enhanced predictive capabilities, automated workflows, and seamless data integration, improving efficiency and decision-making. These innovations are tailored to address specific market needs, offering competitive advantages through improved accuracy, speed, and cost-effectiveness.
Report Segmentation & Scope
This report segments the Insurance Analytics market across various dimensions: By Component (Tool, Services), By Business Application (Claims Management, Risk Management, Process Optimization, Customer Management and Personalization), By Deployment Mode (On-premise, Cloud), and By End-User (Insurance Companies, Government Agencies, Third-party Administrators, Brokers, and Consultancies). Each segment's growth projections, market sizes, and competitive dynamics are thoroughly analyzed, providing a comprehensive understanding of the market landscape.
Key Drivers of Insurance Analytics Market Growth
The Insurance Analytics market is experiencing robust growth driven by several key factors: the exponential increase in data volumes generated by various sources, the accelerating adoption of cloud-based solutions, rapid advancements in AI and machine learning, and the growing demand for hyper-personalized insurance products tailored to individual customer needs. Stringent regulatory compliance requirements, including GDPR and CCPA, are also compelling insurers to adopt data privacy-focused analytics solutions, thereby fueling market expansion. The need for improved risk management, in the face of increasing complexity and uncertainty, is another crucial driver.
Challenges in the Insurance Analytics Market Sector
Despite its significant growth potential, the Insurance Analytics market faces several challenges. Data security and privacy concerns remain paramount, requiring robust security measures and compliance with evolving regulations. The need for skilled professionals with expertise in data science, analytics, and insurance domain knowledge is a persistent hurdle. Integrating disparate data sources from various legacy systems remains a significant technological challenge, requiring innovative solutions for data harmonization and interoperability. High implementation costs, organizational resistance to change, and the complexity of regulatory compliance further hinder wider adoption. The lack of standardization across analytical platforms and the absence of interoperability between different systems create obstacles to efficient data exchange and analysis. Addressing these challenges through strategic investments in technology, talent development, and collaborative industry initiatives is crucial for unlocking the full potential of the Insurance Analytics market.
Leading Players in the Insurance Analytics Market
- Sapiens International Corporation
- Hexaware Technologies Limited
- OpenText Corporation
- IBM Corporation
- Applied Systems Inc
- MicroStrategy Incorporated
- Guidewire Software Inc
- Microsoft Corporation
- Oracle Corporation
- LexisNexis Risk Solutions
Key Developments in Insurance Analytics Market Sector
- April 2023: Guidewire launched the Garmisch solution, enhancing developer self-service tools on the Guidewire Cloud Console, enabling faster digital claims experiences.
- February 2023: MS Amlin Insurance S.E. adopted Sapiens IDITSuite, an end-to-end insurance platform, enhancing risk selection and lowering claim expense ratios.
Strategic Insurance Analytics Market Outlook
The Insurance Analytics market presents significant growth potential, driven by ongoing technological advancements, increasing data volumes, and evolving customer expectations. Strategic opportunities exist for companies focusing on AI-powered solutions, cloud-based platforms, and specialized analytical services. The future of the market hinges on companies' ability to adapt to changing regulatory landscapes, address data security and privacy concerns, and deliver innovative solutions that meet the evolving needs of the insurance industry.
Insurance Analytics Market Segmentation
-
1. Component
- 1.1. Tool
- 1.2. Services
-
2. Business Application (Qualitative Analysis)
- 2.1. Claims Management
- 2.2. Risk Management
- 2.3. Process Optimization
- 2.4. Customer Management and Personalization
-
3. Deployment Mode
- 3.1. On-premise
- 3.2. Cloud
-
4. End-User
- 4.1. Insurance Companies
- 4.2. Government Agencies
- 4.3. Third-pa
Insurance Analytics Market Segmentation By Geography
- 1. North America
- 2. Europe
- 3. Asia Pacific
- 4. Rest of the World
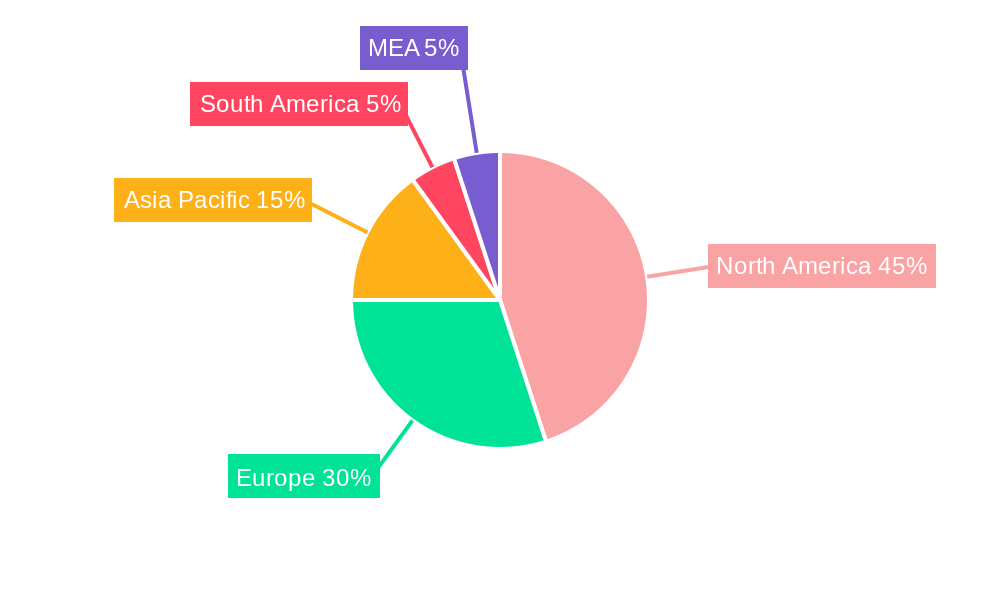
Insurance Analytics Market Regional Market Share
Geographic Coverage of Insurance Analytics Market
Insurance Analytics Market REPORT HIGHLIGHTS
| Aspects | Details |
|---|---|
| Study Period | 2020-2034 |
| Base Year | 2025 |
| Estimated Year | 2026 |
| Forecast Period | 2026-2034 |
| Historical Period | 2020-2025 |
| Growth Rate | CAGR of 15.90% from 2020-2034 |
| Segmentation |
|
Table of Contents
- 1. Introduction
- 1.1. Research Scope
- 1.2. Market Segmentation
- 1.3. Research Objective
- 1.4. Definitions and Assumptions
- 2. Executive Summary
- 2.1. Market Snapshot
- 3. Market Dynamics
- 3.1. Market Drivers
- 3.2. Market Restrains
- 3.3. Market Trends
- 3.4. Market Opportunities
- 4. Market Factor Analysis
- 4.1. Porters Five Forces
- 4.1.1. Bargaining Power of Suppliers
- 4.1.2. Bargaining Power of Buyers
- 4.1.3. Threat of New Entrants
- 4.1.4. Threat of Substitutes
- 4.1.5. Competitive Rivalry
- 4.2. PESTEL analysis
- 4.3. BCG Analysis
- 4.3.1. Stars (High Growth, High Market Share)
- 4.3.2. Cash Cows (Low Growth, High Market Share)
- 4.3.3. Question Mark (High Growth, Low Market Share)
- 4.3.4. Dogs (Low Growth, Low Market Share)
- 4.4. Ansoff Matrix Analysis
- 4.5. Supply Chain Analysis
- 4.6. Regulatory Landscape
- 4.7. Current Market Potential and Opportunity Assessment (TAM–SAM–SOM Framework)
- 4.8. PMV Analyst Note
- 4.1. Porters Five Forces
- 5. Market Analysis, Insights and Forecast 2021-2033
- 5.1. Market Analysis, Insights and Forecast - by Component
- 5.1.1. Tool
- 5.1.2. Services
- 5.2. Market Analysis, Insights and Forecast - by Business Application (Qualitative Analysis)
- 5.2.1. Claims Management
- 5.2.2. Risk Management
- 5.2.3. Process Optimization
- 5.2.4. Customer Management and Personalization
- 5.3. Market Analysis, Insights and Forecast - by Deployment Mode
- 5.3.1. On-premise
- 5.3.2. Cloud
- 5.4. Market Analysis, Insights and Forecast - by End-User
- 5.4.1. Insurance Companies
- 5.4.2. Government Agencies
- 5.4.3. Third-pa
- 5.5. Market Analysis, Insights and Forecast - by Region
- 5.5.1. North America
- 5.5.2. Europe
- 5.5.3. Asia Pacific
- 5.5.4. Rest of the World
- 5.1. Market Analysis, Insights and Forecast - by Component
- 6. Global Insurance Analytics Market Analysis, Insights and Forecast, 2021-2033
- 6.1. Market Analysis, Insights and Forecast - by Component
- 6.1.1. Tool
- 6.1.2. Services
- 6.2. Market Analysis, Insights and Forecast - by Business Application (Qualitative Analysis)
- 6.2.1. Claims Management
- 6.2.2. Risk Management
- 6.2.3. Process Optimization
- 6.2.4. Customer Management and Personalization
- 6.3. Market Analysis, Insights and Forecast - by Deployment Mode
- 6.3.1. On-premise
- 6.3.2. Cloud
- 6.4. Market Analysis, Insights and Forecast - by End-User
- 6.4.1. Insurance Companies
- 6.4.2. Government Agencies
- 6.4.3. Third-pa
- 6.1. Market Analysis, Insights and Forecast - by Component
- 7. North America Insurance Analytics Market Analysis, Insights and Forecast, 2020-2032
- 7.1. Market Analysis, Insights and Forecast - by Component
- 7.1.1. Tool
- 7.1.2. Services
- 7.2. Market Analysis, Insights and Forecast - by Business Application (Qualitative Analysis)
- 7.2.1. Claims Management
- 7.2.2. Risk Management
- 7.2.3. Process Optimization
- 7.2.4. Customer Management and Personalization
- 7.3. Market Analysis, Insights and Forecast - by Deployment Mode
- 7.3.1. On-premise
- 7.3.2. Cloud
- 7.4. Market Analysis, Insights and Forecast - by End-User
- 7.4.1. Insurance Companies
- 7.4.2. Government Agencies
- 7.4.3. Third-pa
- 7.1. Market Analysis, Insights and Forecast - by Component
- 8. Europe Insurance Analytics Market Analysis, Insights and Forecast, 2020-2032
- 8.1. Market Analysis, Insights and Forecast - by Component
- 8.1.1. Tool
- 8.1.2. Services
- 8.2. Market Analysis, Insights and Forecast - by Business Application (Qualitative Analysis)
- 8.2.1. Claims Management
- 8.2.2. Risk Management
- 8.2.3. Process Optimization
- 8.2.4. Customer Management and Personalization
- 8.3. Market Analysis, Insights and Forecast - by Deployment Mode
- 8.3.1. On-premise
- 8.3.2. Cloud
- 8.4. Market Analysis, Insights and Forecast - by End-User
- 8.4.1. Insurance Companies
- 8.4.2. Government Agencies
- 8.4.3. Third-pa
- 8.1. Market Analysis, Insights and Forecast - by Component
- 9. Asia Pacific Insurance Analytics Market Analysis, Insights and Forecast, 2020-2032
- 9.1. Market Analysis, Insights and Forecast - by Component
- 9.1.1. Tool
- 9.1.2. Services
- 9.2. Market Analysis, Insights and Forecast - by Business Application (Qualitative Analysis)
- 9.2.1. Claims Management
- 9.2.2. Risk Management
- 9.2.3. Process Optimization
- 9.2.4. Customer Management and Personalization
- 9.3. Market Analysis, Insights and Forecast - by Deployment Mode
- 9.3.1. On-premise
- 9.3.2. Cloud
- 9.4. Market Analysis, Insights and Forecast - by End-User
- 9.4.1. Insurance Companies
- 9.4.2. Government Agencies
- 9.4.3. Third-pa
- 9.1. Market Analysis, Insights and Forecast - by Component
- 10. Rest of the World Insurance Analytics Market Analysis, Insights and Forecast, 2020-2032
- 10.1. Market Analysis, Insights and Forecast - by Component
- 10.1.1. Tool
- 10.1.2. Services
- 10.2. Market Analysis, Insights and Forecast - by Business Application (Qualitative Analysis)
- 10.2.1. Claims Management
- 10.2.2. Risk Management
- 10.2.3. Process Optimization
- 10.2.4. Customer Management and Personalization
- 10.3. Market Analysis, Insights and Forecast - by Deployment Mode
- 10.3.1. On-premise
- 10.3.2. Cloud
- 10.4. Market Analysis, Insights and Forecast - by End-User
- 10.4.1. Insurance Companies
- 10.4.2. Government Agencies
- 10.4.3. Third-pa
- 10.1. Market Analysis, Insights and Forecast - by Component
- 11. Competitive Analysis
- 11.1. Company Profiles
- 11.1.1 Sapiens International Corporation*List Not Exhaustive
- 11.1.1.1. Company Overview
- 11.1.1.2. Products
- 11.1.1.3. Company Financials
- 11.1.1.4. SWOT Analysis
- 11.1.2 Hexaware Technologies Limited
- 11.1.2.1. Company Overview
- 11.1.2.2. Products
- 11.1.2.3. Company Financials
- 11.1.2.4. SWOT Analysis
- 11.1.3 OpenText Corporation
- 11.1.3.1. Company Overview
- 11.1.3.2. Products
- 11.1.3.3. Company Financials
- 11.1.3.4. SWOT Analysis
- 11.1.4 IBM Corporation
- 11.1.4.1. Company Overview
- 11.1.4.2. Products
- 11.1.4.3. Company Financials
- 11.1.4.4. SWOT Analysis
- 11.1.5 Applied Systems Inc
- 11.1.5.1. Company Overview
- 11.1.5.2. Products
- 11.1.5.3. Company Financials
- 11.1.5.4. SWOT Analysis
- 11.1.6 MicroStrategy Incorporated
- 11.1.6.1. Company Overview
- 11.1.6.2. Products
- 11.1.6.3. Company Financials
- 11.1.6.4. SWOT Analysis
- 11.1.7 Guidewire Software Inc
- 11.1.7.1. Company Overview
- 11.1.7.2. Products
- 11.1.7.3. Company Financials
- 11.1.7.4. SWOT Analysis
- 11.1.8 Microsoft Corporation
- 11.1.8.1. Company Overview
- 11.1.8.2. Products
- 11.1.8.3. Company Financials
- 11.1.8.4. SWOT Analysis
- 11.1.9 Oracle Corporation
- 11.1.9.1. Company Overview
- 11.1.9.2. Products
- 11.1.9.3. Company Financials
- 11.1.9.4. SWOT Analysis
- 11.1.10 LexisNexis Risk Solutions
- 11.1.10.1. Company Overview
- 11.1.10.2. Products
- 11.1.10.3. Company Financials
- 11.1.10.4. SWOT Analysis
- 11.1.1 Sapiens International Corporation*List Not Exhaustive
- 11.2. Market Entropy
- 11.2.1 Company's Key Areas Served
- 11.2.2 Recent Developments
- 11.3. Company Market Share Analysis 2025
- 11.3.1 Top 5 Companies Market Share Analysis
- 11.3.2 Top 3 Companies Market Share Analysis
- 11.4. List of Potential Customers
- 12. Research Methodology
List of Figures
- Figure 1: Global Insurance Analytics Market Revenue Breakdown (Million, %) by Region 2025 & 2033
- Figure 2: North America Insurance Analytics Market Revenue (Million), by Component 2025 & 2033
- Figure 3: North America Insurance Analytics Market Revenue Share (%), by Component 2025 & 2033
- Figure 4: North America Insurance Analytics Market Revenue (Million), by Business Application (Qualitative Analysis) 2025 & 2033
- Figure 5: North America Insurance Analytics Market Revenue Share (%), by Business Application (Qualitative Analysis) 2025 & 2033
- Figure 6: North America Insurance Analytics Market Revenue (Million), by Deployment Mode 2025 & 2033
- Figure 7: North America Insurance Analytics Market Revenue Share (%), by Deployment Mode 2025 & 2033
- Figure 8: North America Insurance Analytics Market Revenue (Million), by End-User 2025 & 2033
- Figure 9: North America Insurance Analytics Market Revenue Share (%), by End-User 2025 & 2033
- Figure 10: North America Insurance Analytics Market Revenue (Million), by Country 2025 & 2033
- Figure 11: North America Insurance Analytics Market Revenue Share (%), by Country 2025 & 2033
- Figure 12: Europe Insurance Analytics Market Revenue (Million), by Component 2025 & 2033
- Figure 13: Europe Insurance Analytics Market Revenue Share (%), by Component 2025 & 2033
- Figure 14: Europe Insurance Analytics Market Revenue (Million), by Business Application (Qualitative Analysis) 2025 & 2033
- Figure 15: Europe Insurance Analytics Market Revenue Share (%), by Business Application (Qualitative Analysis) 2025 & 2033
- Figure 16: Europe Insurance Analytics Market Revenue (Million), by Deployment Mode 2025 & 2033
- Figure 17: Europe Insurance Analytics Market Revenue Share (%), by Deployment Mode 2025 & 2033
- Figure 18: Europe Insurance Analytics Market Revenue (Million), by End-User 2025 & 2033
- Figure 19: Europe Insurance Analytics Market Revenue Share (%), by End-User 2025 & 2033
- Figure 20: Europe Insurance Analytics Market Revenue (Million), by Country 2025 & 2033
- Figure 21: Europe Insurance Analytics Market Revenue Share (%), by Country 2025 & 2033
- Figure 22: Asia Pacific Insurance Analytics Market Revenue (Million), by Component 2025 & 2033
- Figure 23: Asia Pacific Insurance Analytics Market Revenue Share (%), by Component 2025 & 2033
- Figure 24: Asia Pacific Insurance Analytics Market Revenue (Million), by Business Application (Qualitative Analysis) 2025 & 2033
- Figure 25: Asia Pacific Insurance Analytics Market Revenue Share (%), by Business Application (Qualitative Analysis) 2025 & 2033
- Figure 26: Asia Pacific Insurance Analytics Market Revenue (Million), by Deployment Mode 2025 & 2033
- Figure 27: Asia Pacific Insurance Analytics Market Revenue Share (%), by Deployment Mode 2025 & 2033
- Figure 28: Asia Pacific Insurance Analytics Market Revenue (Million), by End-User 2025 & 2033
- Figure 29: Asia Pacific Insurance Analytics Market Revenue Share (%), by End-User 2025 & 2033
- Figure 30: Asia Pacific Insurance Analytics Market Revenue (Million), by Country 2025 & 2033
- Figure 31: Asia Pacific Insurance Analytics Market Revenue Share (%), by Country 2025 & 2033
- Figure 32: Rest of the World Insurance Analytics Market Revenue (Million), by Component 2025 & 2033
- Figure 33: Rest of the World Insurance Analytics Market Revenue Share (%), by Component 2025 & 2033
- Figure 34: Rest of the World Insurance Analytics Market Revenue (Million), by Business Application (Qualitative Analysis) 2025 & 2033
- Figure 35: Rest of the World Insurance Analytics Market Revenue Share (%), by Business Application (Qualitative Analysis) 2025 & 2033
- Figure 36: Rest of the World Insurance Analytics Market Revenue (Million), by Deployment Mode 2025 & 2033
- Figure 37: Rest of the World Insurance Analytics Market Revenue Share (%), by Deployment Mode 2025 & 2033
- Figure 38: Rest of the World Insurance Analytics Market Revenue (Million), by End-User 2025 & 2033
- Figure 39: Rest of the World Insurance Analytics Market Revenue Share (%), by End-User 2025 & 2033
- Figure 40: Rest of the World Insurance Analytics Market Revenue (Million), by Country 2025 & 2033
- Figure 41: Rest of the World Insurance Analytics Market Revenue Share (%), by Country 2025 & 2033
List of Tables
- Table 1: Global Insurance Analytics Market Revenue Million Forecast, by Component 2020 & 2033
- Table 2: Global Insurance Analytics Market Revenue Million Forecast, by Business Application (Qualitative Analysis) 2020 & 2033
- Table 3: Global Insurance Analytics Market Revenue Million Forecast, by Deployment Mode 2020 & 2033
- Table 4: Global Insurance Analytics Market Revenue Million Forecast, by End-User 2020 & 2033
- Table 5: Global Insurance Analytics Market Revenue Million Forecast, by Region 2020 & 2033
- Table 6: Global Insurance Analytics Market Revenue Million Forecast, by Component 2020 & 2033
- Table 7: Global Insurance Analytics Market Revenue Million Forecast, by Business Application (Qualitative Analysis) 2020 & 2033
- Table 8: Global Insurance Analytics Market Revenue Million Forecast, by Deployment Mode 2020 & 2033
- Table 9: Global Insurance Analytics Market Revenue Million Forecast, by End-User 2020 & 2033
- Table 10: Global Insurance Analytics Market Revenue Million Forecast, by Country 2020 & 2033
- Table 11: Global Insurance Analytics Market Revenue Million Forecast, by Component 2020 & 2033
- Table 12: Global Insurance Analytics Market Revenue Million Forecast, by Business Application (Qualitative Analysis) 2020 & 2033
- Table 13: Global Insurance Analytics Market Revenue Million Forecast, by Deployment Mode 2020 & 2033
- Table 14: Global Insurance Analytics Market Revenue Million Forecast, by End-User 2020 & 2033
- Table 15: Global Insurance Analytics Market Revenue Million Forecast, by Country 2020 & 2033
- Table 16: Global Insurance Analytics Market Revenue Million Forecast, by Component 2020 & 2033
- Table 17: Global Insurance Analytics Market Revenue Million Forecast, by Business Application (Qualitative Analysis) 2020 & 2033
- Table 18: Global Insurance Analytics Market Revenue Million Forecast, by Deployment Mode 2020 & 2033
- Table 19: Global Insurance Analytics Market Revenue Million Forecast, by End-User 2020 & 2033
- Table 20: Global Insurance Analytics Market Revenue Million Forecast, by Country 2020 & 2033
- Table 21: Global Insurance Analytics Market Revenue Million Forecast, by Component 2020 & 2033
- Table 22: Global Insurance Analytics Market Revenue Million Forecast, by Business Application (Qualitative Analysis) 2020 & 2033
- Table 23: Global Insurance Analytics Market Revenue Million Forecast, by Deployment Mode 2020 & 2033
- Table 24: Global Insurance Analytics Market Revenue Million Forecast, by End-User 2020 & 2033
- Table 25: Global Insurance Analytics Market Revenue Million Forecast, by Country 2020 & 2033
Frequently Asked Questions
1. What is the projected Compound Annual Growth Rate (CAGR) of the Insurance Analytics Market?
The projected CAGR is approximately 15.90%.
2. Which companies are prominent players in the Insurance Analytics Market?
Key companies in the market include Sapiens International Corporation*List Not Exhaustive, Hexaware Technologies Limited, OpenText Corporation, IBM Corporation, Applied Systems Inc, MicroStrategy Incorporated, Guidewire Software Inc, Microsoft Corporation, Oracle Corporation, LexisNexis Risk Solutions.
3. What are the main segments of the Insurance Analytics Market?
The market segments include Component, Business Application (Qualitative Analysis), Deployment Mode, End-User.
4. Can you provide details about the market size?
The market size is estimated to be USD 11.47 Million as of 2022.
5. What are some drivers contributing to market growth?
Increased Adoption of Advanced Technologies; Rise in Competition among the Insurance Sector.
6. What are the notable trends driving market growth?
Increasing Risks And Fraudulent Activities Are Boosting the Adoption Of Insurance Analytics..
7. Are there any restraints impacting market growth?
Stringent Government Regulations; Privacy and Security Concern.
8. Can you provide examples of recent developments in the market?
April 2023 - Guidewire launched the Garmisch solution to provide developers with more self-service tools on the Guidewire Cloud Console. Insurance companies can easily create and implement seamless, digital claims experiences using this solution. With ready-to-use bulk data connectors from top global data platforms, Garmisch reduces the time it takes for an organization to gain insight.
9. What pricing options are available for accessing the report?
Pricing options include single-user, multi-user, and enterprise licenses priced at USD 4750, USD 5250, and USD 8750 respectively.
10. Is the market size provided in terms of value or volume?
The market size is provided in terms of value, measured in Million.
11. Are there any specific market keywords associated with the report?
Yes, the market keyword associated with the report is "Insurance Analytics Market," which aids in identifying and referencing the specific market segment covered.
12. How do I determine which pricing option suits my needs best?
The pricing options vary based on user requirements and access needs. Individual users may opt for single-user licenses, while businesses requiring broader access may choose multi-user or enterprise licenses for cost-effective access to the report.
13. Are there any additional resources or data provided in the Insurance Analytics Market report?
While the report offers comprehensive insights, it's advisable to review the specific contents or supplementary materials provided to ascertain if additional resources or data are available.
14. How can I stay updated on further developments or reports in the Insurance Analytics Market?
To stay informed about further developments, trends, and reports in the Insurance Analytics Market, consider subscribing to industry newsletters, following relevant companies and organizations, or regularly checking reputable industry news sources and publications.
Methodology
Step 1 - Identification of Relevant Samples Size from Population Database


Step 2 - Approaches for Defining Global Market Size (Value, Volume* & Price*)

Note*: In applicable scenarios
Step 3 - Data Sources
Primary Research
- Web Analytics
- Survey Reports
- Research Institute
- Latest Research Reports
- Opinion Leaders
Secondary Research
- Annual Reports
- White Paper
- Latest Press Release
- Industry Association
- Paid Database
- Investor Presentations

Step 4 - Data Triangulation
Involves using different sources of information in order to increase the validity of a study
These sources are likely to be stakeholders in a program - participants, other researchers, program staff, other community members, and so on.
Then we put all data in single framework & apply various statistical tools to find out the dynamic on the market.
During the analysis stage, feedback from the stakeholder groups would be compared to determine areas of agreement as well as areas of divergence

