
Key Insights
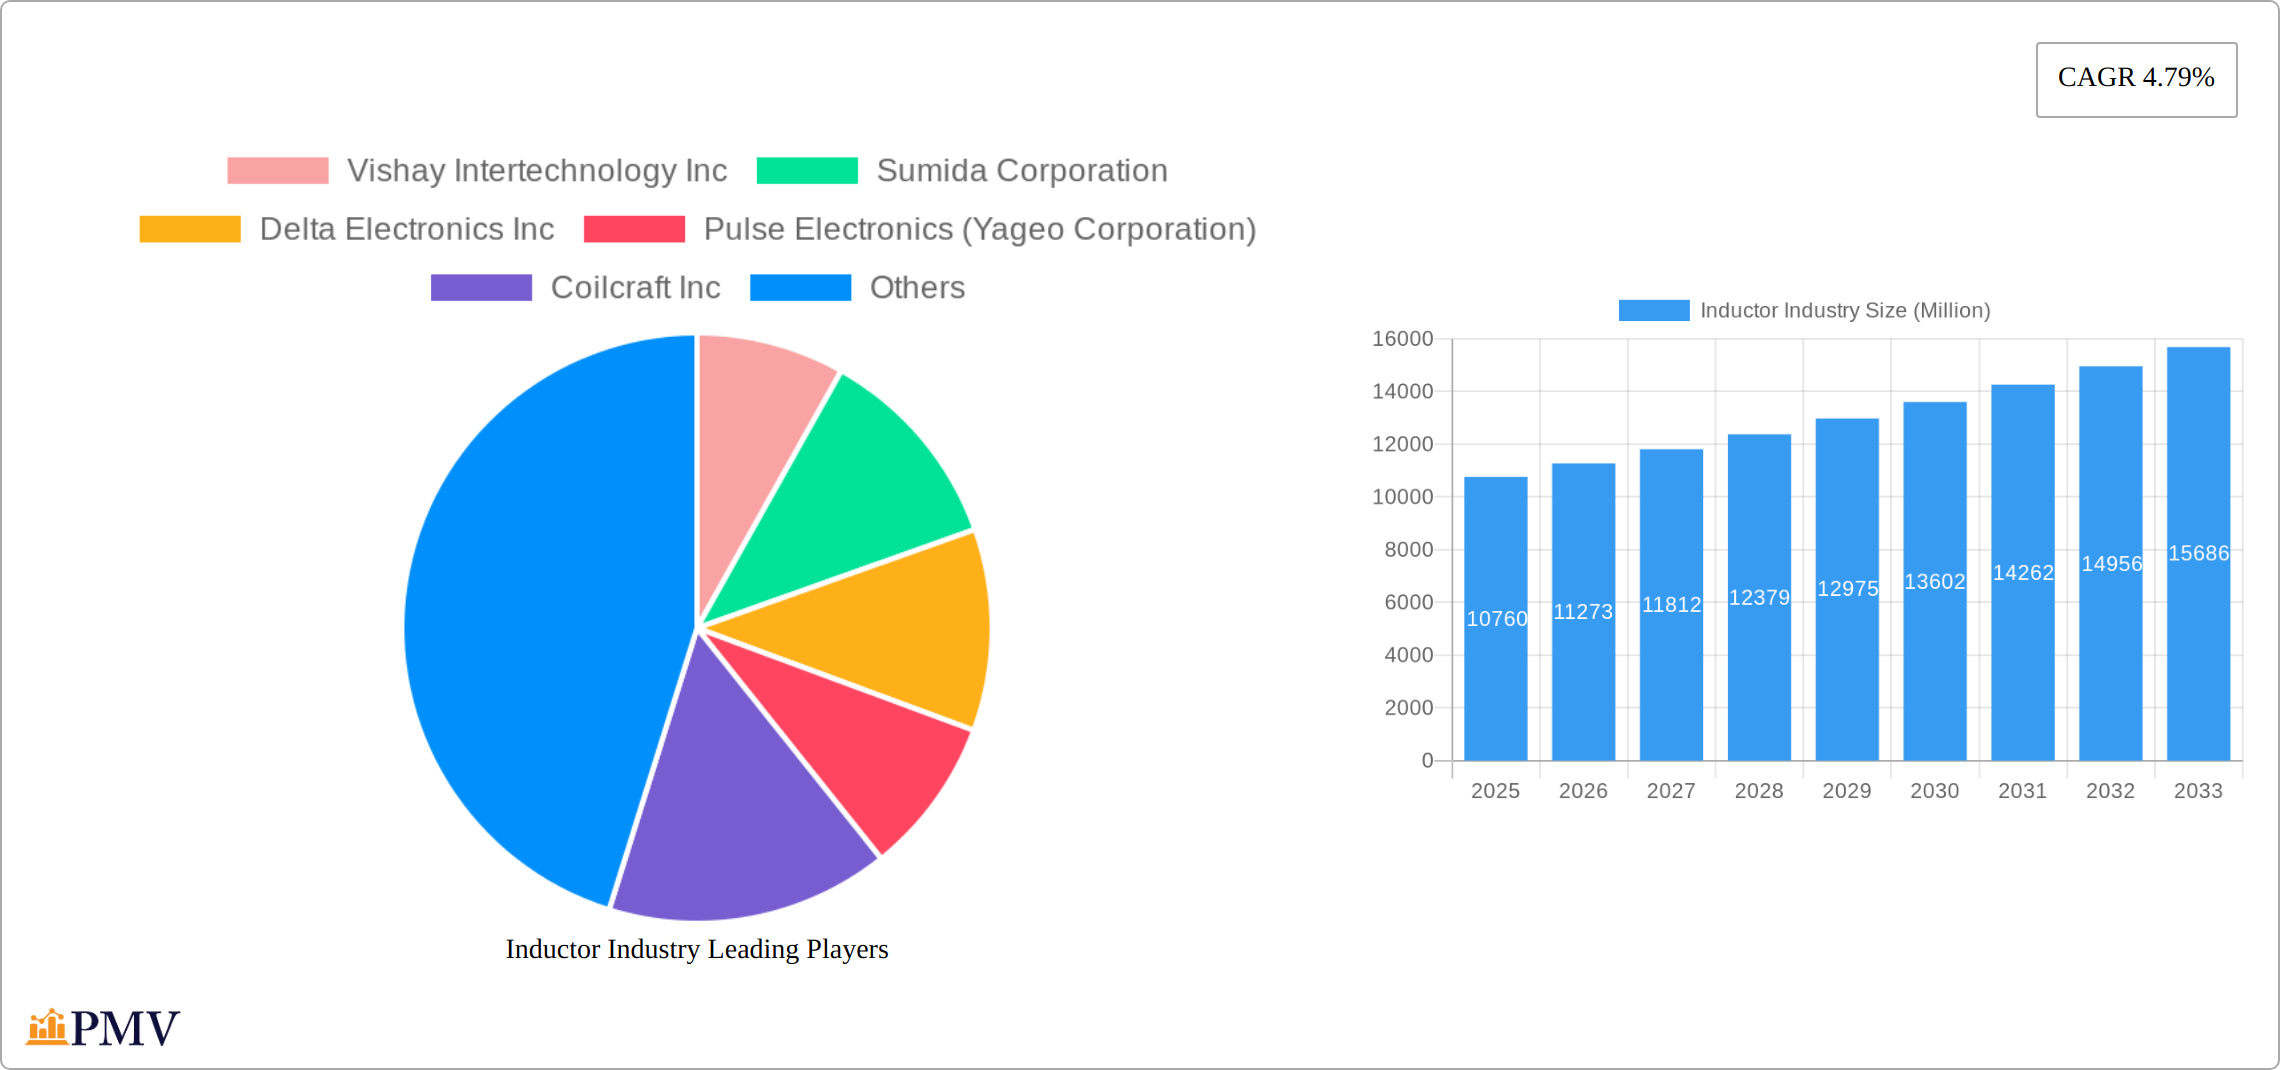
The inductor market, valued at $10.76 billion in 2025, is projected to experience robust growth, driven by the increasing demand for electronic components in diverse sectors. A Compound Annual Growth Rate (CAGR) of 4.79% from 2025 to 2033 indicates a significant expansion, primarily fueled by the proliferation of electric vehicles (EVs) in the automotive industry, the ongoing development of 5G infrastructure within the communications sector, and the miniaturization trends in consumer electronics. The rising adoption of advanced power management systems, necessitating high-efficiency inductors, further bolsters market growth. Segmentation reveals a strong presence of power inductors, followed by frequency inductors, with ferrite cores dominating the core material segment due to their cost-effectiveness and performance characteristics. The automotive sector is expected to remain the largest end-user vertical, given the increasing electronic content in modern vehicles. However, the aerospace and defense, and consumer electronics and computing sectors are projected to experience considerable growth as well, contributing significantly to the overall market expansion. Potential restraints include the price fluctuations of raw materials, particularly rare earth elements used in some inductor types, and the increasing complexity of inductor design for next-generation applications.
The competitive landscape is characterized by a mix of established players and emerging companies. Key industry participants such as Vishay Intertechnology, Murata Manufacturing, TDK Corporation, and others, are focusing on innovation and strategic partnerships to maintain their market share and capitalize on emerging opportunities. Furthermore, ongoing research and development in materials science and manufacturing processes are expected to lead to more efficient and cost-effective inductor solutions, driving further market growth. Regional analysis suggests strong market penetration in North America and Asia, attributed to the significant presence of major electronics manufacturers and robust technological advancements in these regions. Europe and other regions are also poised for growth due to increasing adoption of electronic devices across various applications. The forecast period (2025-2033) promises continued expansion, with particular emphasis on higher-performance and miniaturized inductors catering to the demands of advanced electronic systems.
Inductor Industry Market Report: 2019-2033
This comprehensive report provides a detailed analysis of the global inductor industry, encompassing market size, segmentation, competitive landscape, and future growth prospects. The study period covers 2019-2033, with 2025 as the base and estimated year. We project a robust market expansion during the forecast period (2025-2033), driven by technological advancements and increasing demand across diverse end-user verticals. This report is crucial for industry stakeholders, investors, and researchers seeking insights into this dynamic market.
Inductor Industry Market Structure & Competitive Dynamics
The global inductor market is characterized by a moderately concentrated structure, with several major players commanding significant market share. Key companies include Vishay Intertechnology Inc, Sumida Corporation, Delta Electronics Inc, Pulse Electronics (Yageo Corporation), Coilcraft Inc, TE Connectivity Ltd, Taiyo Yuden Co Ltd, TDK Corporation, Murata Manufacturing Co Ltd, Sagami Elec Co Ltd, and Panasonic Corporation. These companies compete based on factors such as product innovation, technological advancements, pricing strategies, and distribution networks. The market is witnessing increased innovation, driven by the need for higher efficiency, miniaturization, and improved performance in diverse applications.
Market concentration is moderate, with the top 5 players holding approximately xx% of the market share in 2024. The industry is subject to stringent regulatory frameworks related to material safety and environmental standards. Product substitutes, such as transformers and other passive components, pose some competition, although inductors maintain a strong position due to their unique functionalities. End-user trends, particularly in the automotive and electronics sectors, are major growth drivers. Mergers and acquisitions (M&A) activity has been moderate, with deal values totaling approximately $XX Million in the past five years. These M&A activities have mostly focused on expanding product portfolios and geographic reach.
Inductor Industry Industry Trends & Insights
The global inductor market is experiencing significant growth, driven by the increasing demand for electronics across various sectors. The Compound Annual Growth Rate (CAGR) is projected to be xx% during the forecast period (2025-2033), reaching a market size of $XX Million by 2033. Key growth drivers include the proliferation of smartphones, wearables, and other consumer electronics; the expansion of the automotive industry, particularly electric vehicles; and the growth of data centers and cloud computing.
Technological disruptions, such as the development of advanced materials and manufacturing processes, are contributing to the improved performance and miniaturization of inductors. Consumer preferences are shifting towards smaller, more efficient, and reliable components, driving innovation in inductor design. The competitive dynamics are intense, with companies continuously striving to differentiate their products through technological advancements, cost optimization, and strategic partnerships. Market penetration in emerging economies is increasing, fueled by rising disposable incomes and increased adoption of electronic devices.

Dominant Markets & Segments in Inductor Industry
The Asia-Pacific region is currently the dominant market for inductors, driven by rapid economic growth, a large and expanding electronics manufacturing base, and increasing consumer demand. China, Japan, and South Korea are key markets within this region.
- By Type: The power inductor segment holds the largest market share, followed by the frequency inductor segment. This is primarily due to the extensive application of power inductors in power supply units and other power electronics applications.
- By Core: Ferrite core inductors dominate the market due to their cost-effectiveness and excellent magnetic properties. However, the air/ceramic core segment is gaining traction due to its high-frequency performance.
- By End-user Vertical: The automotive industry is currently the largest end-user segment for inductors, followed by consumer electronics and computing. The increasing adoption of advanced driver-assistance systems (ADAS) and electric vehicles is driving strong growth in the automotive sector. Other key end-user verticals include aerospace & defense, and communications. Growth in these sectors is fueled by factors such as increased government spending on defense and the expansion of 5G and other wireless communication networks.
Inductor Industry Product Innovations
Recent innovations in the inductor industry are focusing on miniaturization, improved efficiency, and the development of inductors suitable for high-frequency applications. The introduction of new materials and advanced manufacturing techniques is leading to smaller, lighter, and more energy-efficient inductors. These innovations are improving the performance of various electronic devices and systems, enabling the development of more compact and efficient products across diverse applications. Companies are focusing on providing customized solutions to meet specific customer requirements. The integration of inductors with other components, such as capacitors and resistors, is also gaining momentum, leading to the development of more integrated and compact circuits.
Report Segmentation & Scope
This report segments the inductor market based on type (power, frequency), core material (air/ceramic core, ferrite core, other cores), and end-user vertical (automotive, aerospace and defense, communications, consumer electronics and computing, other end-user verticals). Each segment's growth projections, market size, and competitive dynamics are analyzed in detail. The power inductor segment is projected to grow at a CAGR of xx% during the forecast period, driven by the increasing demand for power management solutions. The ferrite core segment dominates the market due to its cost-effectiveness. The automotive industry is the fastest-growing end-user segment.
Key Drivers of Inductor Industry Growth
Several factors drive the growth of the inductor industry. The increasing demand for electronic devices across various sectors, fueled by rising disposable incomes and technological advancements, is a key driver. The miniaturization trend in electronics is also boosting demand for smaller and more efficient inductors. Government initiatives promoting the adoption of electric vehicles and renewable energy sources are further driving market growth. Technological innovations in materials science and manufacturing processes continue to enhance inductor performance and reduce costs.
Challenges in the Inductor Industry Sector
The inductor industry faces several challenges. Fluctuations in raw material prices, particularly for rare earth elements used in some inductor types, can impact profitability. Supply chain disruptions can also lead to production delays and increased costs. Intense competition from established players and new entrants necessitates continuous innovation and cost optimization. Stringent environmental regulations require manufacturers to adopt sustainable practices, potentially increasing production costs.
Leading Players in the Inductor Industry Market
- Vishay Intertechnology Inc
- Sumida Corporation
- Delta Electronics Inc
- Pulse Electronics (Yageo Corporation)
- Coilcraft Inc
- TE Connectivity Ltd
- Taiyo Yuden Co Ltd
- TDK Corporation
- Murata Manufacturing Co Ltd
- Sagami Elec Co Ltd
- Panasonic Corporation
Key Developments in Inductor Industry Sector
- February 2024: Abracon launched its ATL-series Trans-Inductor Voltage Regulator (TLVR) Inductors, designed for high-performance power delivery in data centers, electric vehicles, and AI servers. This reflects the industry's focus on higher power efficiency and reliability.
- January 2024: TDK Corporation launched the KLZ2012-A series multilayer inductors for automotive audio bus (A2B) applications. This highlights the growing demand for specialized inductors in the automotive sector.
Strategic Inductor Industry Market Outlook
The inductor market is poised for continued growth, driven by the ongoing expansion of electronics across various sectors. Strategic opportunities exist in developing high-frequency inductors, miniaturized components, and customized solutions to meet specific customer requirements. Investment in research and development, along with strategic partnerships and acquisitions, will be crucial for companies seeking to capitalize on the market's growth potential. The focus on sustainable manufacturing practices and supply chain resilience will also be vital for long-term success.
Inductor Industry Segmentation
-
1. Type
- 1.1. Power
- 1.2. Frequency
-
2. Core
- 2.1. Air/Ceramic Core
- 2.2. Ferrite Core
- 2.3. Other Cores
-
3. End-user Vertical
- 3.1. Automotive
- 3.2. Aerospace and Defense
- 3.3. Communications
- 3.4. Consumer Electronics and Computing
- 3.5. Other End-user Verticals
Inductor Industry Segmentation By Geography
- 1. North America
- 2. Europe
- 3. Asia
- 4. Australia and New Zealand
- 5. Latin America
- 6. Middle East and Africa

Inductor Industry REPORT HIGHLIGHTS
| Aspects | Details |
|---|---|
| Study Period | 2019-2033 |
| Base Year | 2024 |
| Estimated Year | 2025 |
| Forecast Period | 2025-2033 |
| Historical Period | 2019-2024 |
| Growth Rate | CAGR of 4.79% from 2019-2033 |
| Segmentation |
|
Table of Contents
- 1. Introduction
- 1.1. Research Scope
- 1.2. Market Segmentation
- 1.3. Research Methodology
- 1.4. Definitions and Assumptions
- 2. Executive Summary
- 2.1. Introduction
- 3. Market Dynamics
- 3.1. Introduction
- 3.2. Market Drivers
- 3.2.1. Rise In Innovations in Consumer Electronics Products; Growing Demand for Energy-efficient Electrical and Electronic Systems
- 3.3. Market Restrains
- 3.3.1 Rising Cost of Raw Materials
- 3.3.2 Especially Copper
- 3.4. Market Trends
- 3.4.1. Frequency Inductor Expected to Witness Significant Growth
- 4. Market Factor Analysis
- 4.1. Porters Five Forces
- 4.2. Supply/Value Chain
- 4.3. PESTEL analysis
- 4.4. Market Entropy
- 4.5. Patent/Trademark Analysis
- 5. Global Inductor Industry Analysis, Insights and Forecast, 2019-2031
- 5.1. Market Analysis, Insights and Forecast - by Type
- 5.1.1. Power
- 5.1.2. Frequency
- 5.2. Market Analysis, Insights and Forecast - by Core
- 5.2.1. Air/Ceramic Core
- 5.2.2. Ferrite Core
- 5.2.3. Other Cores
- 5.3. Market Analysis, Insights and Forecast - by End-user Vertical
- 5.3.1. Automotive
- 5.3.2. Aerospace and Defense
- 5.3.3. Communications
- 5.3.4. Consumer Electronics and Computing
- 5.3.5. Other End-user Verticals
- 5.4. Market Analysis, Insights and Forecast - by Region
- 5.4.1. North America
- 5.4.2. Europe
- 5.4.3. Asia
- 5.4.4. Australia and New Zealand
- 5.4.5. Latin America
- 5.4.6. Middle East and Africa
- 5.1. Market Analysis, Insights and Forecast - by Type
- 6. North America Inductor Industry Analysis, Insights and Forecast, 2019-2031
- 6.1. Market Analysis, Insights and Forecast - by Type
- 6.1.1. Power
- 6.1.2. Frequency
- 6.2. Market Analysis, Insights and Forecast - by Core
- 6.2.1. Air/Ceramic Core
- 6.2.2. Ferrite Core
- 6.2.3. Other Cores
- 6.3. Market Analysis, Insights and Forecast - by End-user Vertical
- 6.3.1. Automotive
- 6.3.2. Aerospace and Defense
- 6.3.3. Communications
- 6.3.4. Consumer Electronics and Computing
- 6.3.5. Other End-user Verticals
- 6.1. Market Analysis, Insights and Forecast - by Type
- 7. Europe Inductor Industry Analysis, Insights and Forecast, 2019-2031
- 7.1. Market Analysis, Insights and Forecast - by Type
- 7.1.1. Power
- 7.1.2. Frequency
- 7.2. Market Analysis, Insights and Forecast - by Core
- 7.2.1. Air/Ceramic Core
- 7.2.2. Ferrite Core
- 7.2.3. Other Cores
- 7.3. Market Analysis, Insights and Forecast - by End-user Vertical
- 7.3.1. Automotive
- 7.3.2. Aerospace and Defense
- 7.3.3. Communications
- 7.3.4. Consumer Electronics and Computing
- 7.3.5. Other End-user Verticals
- 7.1. Market Analysis, Insights and Forecast - by Type
- 8. Asia Inductor Industry Analysis, Insights and Forecast, 2019-2031
- 8.1. Market Analysis, Insights and Forecast - by Type
- 8.1.1. Power
- 8.1.2. Frequency
- 8.2. Market Analysis, Insights and Forecast - by Core
- 8.2.1. Air/Ceramic Core
- 8.2.2. Ferrite Core
- 8.2.3. Other Cores
- 8.3. Market Analysis, Insights and Forecast - by End-user Vertical
- 8.3.1. Automotive
- 8.3.2. Aerospace and Defense
- 8.3.3. Communications
- 8.3.4. Consumer Electronics and Computing
- 8.3.5. Other End-user Verticals
- 8.1. Market Analysis, Insights and Forecast - by Type
- 9. Australia and New Zealand Inductor Industry Analysis, Insights and Forecast, 2019-2031
- 9.1. Market Analysis, Insights and Forecast - by Type
- 9.1.1. Power
- 9.1.2. Frequency
- 9.2. Market Analysis, Insights and Forecast - by Core
- 9.2.1. Air/Ceramic Core
- 9.2.2. Ferrite Core
- 9.2.3. Other Cores
- 9.3. Market Analysis, Insights and Forecast - by End-user Vertical
- 9.3.1. Automotive
- 9.3.2. Aerospace and Defense
- 9.3.3. Communications
- 9.3.4. Consumer Electronics and Computing
- 9.3.5. Other End-user Verticals
- 9.1. Market Analysis, Insights and Forecast - by Type
- 10. Latin America Inductor Industry Analysis, Insights and Forecast, 2019-2031
- 10.1. Market Analysis, Insights and Forecast - by Type
- 10.1.1. Power
- 10.1.2. Frequency
- 10.2. Market Analysis, Insights and Forecast - by Core
- 10.2.1. Air/Ceramic Core
- 10.2.2. Ferrite Core
- 10.2.3. Other Cores
- 10.3. Market Analysis, Insights and Forecast - by End-user Vertical
- 10.3.1. Automotive
- 10.3.2. Aerospace and Defense
- 10.3.3. Communications
- 10.3.4. Consumer Electronics and Computing
- 10.3.5. Other End-user Verticals
- 10.1. Market Analysis, Insights and Forecast - by Type
- 11. Middle East and Africa Inductor Industry Analysis, Insights and Forecast, 2019-2031
- 11.1. Market Analysis, Insights and Forecast - by Type
- 11.1.1. Power
- 11.1.2. Frequency
- 11.2. Market Analysis, Insights and Forecast - by Core
- 11.2.1. Air/Ceramic Core
- 11.2.2. Ferrite Core
- 11.2.3. Other Cores
- 11.3. Market Analysis, Insights and Forecast - by End-user Vertical
- 11.3.1. Automotive
- 11.3.2. Aerospace and Defense
- 11.3.3. Communications
- 11.3.4. Consumer Electronics and Computing
- 11.3.5. Other End-user Verticals
- 11.1. Market Analysis, Insights and Forecast - by Type
- 12. North America Inductor Industry Analysis, Insights and Forecast, 2019-2031
- 12.1. Market Analysis, Insights and Forecast - By Country/Sub-region
- 12.1.1.
- 13. Europe Inductor Industry Analysis, Insights and Forecast, 2019-2031
- 13.1. Market Analysis, Insights and Forecast - By Country/Sub-region
- 13.1.1.
- 14. Asia Inductor Industry Analysis, Insights and Forecast, 2019-2031
- 14.1. Market Analysis, Insights and Forecast - By Country/Sub-region
- 14.1.1.
- 15. Australia and New Zealand Inductor Industry Analysis, Insights and Forecast, 2019-2031
- 15.1. Market Analysis, Insights and Forecast - By Country/Sub-region
- 15.1.1.
- 16. Latin America Inductor Industry Analysis, Insights and Forecast, 2019-2031
- 16.1. Market Analysis, Insights and Forecast - By Country/Sub-region
- 16.1.1.
- 17. Middle East and Africa Inductor Industry Analysis, Insights and Forecast, 2019-2031
- 17.1. Market Analysis, Insights and Forecast - By Country/Sub-region
- 17.1.1.
- 18. Competitive Analysis
- 18.1. Global Market Share Analysis 2024
- 18.2. Company Profiles
- 18.2.1 Vishay Intertechnology Inc
- 18.2.1.1. Overview
- 18.2.1.2. Products
- 18.2.1.3. SWOT Analysis
- 18.2.1.4. Recent Developments
- 18.2.1.5. Financials (Based on Availability)
- 18.2.2 Sumida Corporation
- 18.2.2.1. Overview
- 18.2.2.2. Products
- 18.2.2.3. SWOT Analysis
- 18.2.2.4. Recent Developments
- 18.2.2.5. Financials (Based on Availability)
- 18.2.3 Delta Electronics Inc
- 18.2.3.1. Overview
- 18.2.3.2. Products
- 18.2.3.3. SWOT Analysis
- 18.2.3.4. Recent Developments
- 18.2.3.5. Financials (Based on Availability)
- 18.2.4 Pulse Electronics (Yageo Corporation)
- 18.2.4.1. Overview
- 18.2.4.2. Products
- 18.2.4.3. SWOT Analysis
- 18.2.4.4. Recent Developments
- 18.2.4.5. Financials (Based on Availability)
- 18.2.5 Coilcraft Inc
- 18.2.5.1. Overview
- 18.2.5.2. Products
- 18.2.5.3. SWOT Analysis
- 18.2.5.4. Recent Developments
- 18.2.5.5. Financials (Based on Availability)
- 18.2.6 TE Connectivity Ltd
- 18.2.6.1. Overview
- 18.2.6.2. Products
- 18.2.6.3. SWOT Analysis
- 18.2.6.4. Recent Developments
- 18.2.6.5. Financials (Based on Availability)
- 18.2.7 Taiyo Yuden Co Ltd
- 18.2.7.1. Overview
- 18.2.7.2. Products
- 18.2.7.3. SWOT Analysis
- 18.2.7.4. Recent Developments
- 18.2.7.5. Financials (Based on Availability)
- 18.2.8 TDK Corporation
- 18.2.8.1. Overview
- 18.2.8.2. Products
- 18.2.8.3. SWOT Analysis
- 18.2.8.4. Recent Developments
- 18.2.8.5. Financials (Based on Availability)
- 18.2.9 Murata Manufacturing Co Ltd
- 18.2.9.1. Overview
- 18.2.9.2. Products
- 18.2.9.3. SWOT Analysis
- 18.2.9.4. Recent Developments
- 18.2.9.5. Financials (Based on Availability)
- 18.2.10 Sagami Elec Co Ltd
- 18.2.10.1. Overview
- 18.2.10.2. Products
- 18.2.10.3. SWOT Analysis
- 18.2.10.4. Recent Developments
- 18.2.10.5. Financials (Based on Availability)
- 18.2.11 Panasonic Corporation
- 18.2.11.1. Overview
- 18.2.11.2. Products
- 18.2.11.3. SWOT Analysis
- 18.2.11.4. Recent Developments
- 18.2.11.5. Financials (Based on Availability)
- 18.2.1 Vishay Intertechnology Inc
List of Figures
- Figure 1: Global Inductor Industry Revenue Breakdown (Million, %) by Region 2024 & 2032
- Figure 2: North America Inductor Industry Revenue (Million), by Country 2024 & 2032
- Figure 3: North America Inductor Industry Revenue Share (%), by Country 2024 & 2032
- Figure 4: Europe Inductor Industry Revenue (Million), by Country 2024 & 2032
- Figure 5: Europe Inductor Industry Revenue Share (%), by Country 2024 & 2032
- Figure 6: Asia Inductor Industry Revenue (Million), by Country 2024 & 2032
- Figure 7: Asia Inductor Industry Revenue Share (%), by Country 2024 & 2032
- Figure 8: Australia and New Zealand Inductor Industry Revenue (Million), by Country 2024 & 2032
- Figure 9: Australia and New Zealand Inductor Industry Revenue Share (%), by Country 2024 & 2032
- Figure 10: Latin America Inductor Industry Revenue (Million), by Country 2024 & 2032
- Figure 11: Latin America Inductor Industry Revenue Share (%), by Country 2024 & 2032
- Figure 12: Middle East and Africa Inductor Industry Revenue (Million), by Country 2024 & 2032
- Figure 13: Middle East and Africa Inductor Industry Revenue Share (%), by Country 2024 & 2032
- Figure 14: North America Inductor Industry Revenue (Million), by Type 2024 & 2032
- Figure 15: North America Inductor Industry Revenue Share (%), by Type 2024 & 2032
- Figure 16: North America Inductor Industry Revenue (Million), by Core 2024 & 2032
- Figure 17: North America Inductor Industry Revenue Share (%), by Core 2024 & 2032
- Figure 18: North America Inductor Industry Revenue (Million), by End-user Vertical 2024 & 2032
- Figure 19: North America Inductor Industry Revenue Share (%), by End-user Vertical 2024 & 2032
- Figure 20: North America Inductor Industry Revenue (Million), by Country 2024 & 2032
- Figure 21: North America Inductor Industry Revenue Share (%), by Country 2024 & 2032
- Figure 22: Europe Inductor Industry Revenue (Million), by Type 2024 & 2032
- Figure 23: Europe Inductor Industry Revenue Share (%), by Type 2024 & 2032
- Figure 24: Europe Inductor Industry Revenue (Million), by Core 2024 & 2032
- Figure 25: Europe Inductor Industry Revenue Share (%), by Core 2024 & 2032
- Figure 26: Europe Inductor Industry Revenue (Million), by End-user Vertical 2024 & 2032
- Figure 27: Europe Inductor Industry Revenue Share (%), by End-user Vertical 2024 & 2032
- Figure 28: Europe Inductor Industry Revenue (Million), by Country 2024 & 2032
- Figure 29: Europe Inductor Industry Revenue Share (%), by Country 2024 & 2032
- Figure 30: Asia Inductor Industry Revenue (Million), by Type 2024 & 2032
- Figure 31: Asia Inductor Industry Revenue Share (%), by Type 2024 & 2032
- Figure 32: Asia Inductor Industry Revenue (Million), by Core 2024 & 2032
- Figure 33: Asia Inductor Industry Revenue Share (%), by Core 2024 & 2032
- Figure 34: Asia Inductor Industry Revenue (Million), by End-user Vertical 2024 & 2032
- Figure 35: Asia Inductor Industry Revenue Share (%), by End-user Vertical 2024 & 2032
- Figure 36: Asia Inductor Industry Revenue (Million), by Country 2024 & 2032
- Figure 37: Asia Inductor Industry Revenue Share (%), by Country 2024 & 2032
- Figure 38: Australia and New Zealand Inductor Industry Revenue (Million), by Type 2024 & 2032
- Figure 39: Australia and New Zealand Inductor Industry Revenue Share (%), by Type 2024 & 2032
- Figure 40: Australia and New Zealand Inductor Industry Revenue (Million), by Core 2024 & 2032
- Figure 41: Australia and New Zealand Inductor Industry Revenue Share (%), by Core 2024 & 2032
- Figure 42: Australia and New Zealand Inductor Industry Revenue (Million), by End-user Vertical 2024 & 2032
- Figure 43: Australia and New Zealand Inductor Industry Revenue Share (%), by End-user Vertical 2024 & 2032
- Figure 44: Australia and New Zealand Inductor Industry Revenue (Million), by Country 2024 & 2032
- Figure 45: Australia and New Zealand Inductor Industry Revenue Share (%), by Country 2024 & 2032
- Figure 46: Latin America Inductor Industry Revenue (Million), by Type 2024 & 2032
- Figure 47: Latin America Inductor Industry Revenue Share (%), by Type 2024 & 2032
- Figure 48: Latin America Inductor Industry Revenue (Million), by Core 2024 & 2032
- Figure 49: Latin America Inductor Industry Revenue Share (%), by Core 2024 & 2032
- Figure 50: Latin America Inductor Industry Revenue (Million), by End-user Vertical 2024 & 2032
- Figure 51: Latin America Inductor Industry Revenue Share (%), by End-user Vertical 2024 & 2032
- Figure 52: Latin America Inductor Industry Revenue (Million), by Country 2024 & 2032
- Figure 53: Latin America Inductor Industry Revenue Share (%), by Country 2024 & 2032
- Figure 54: Middle East and Africa Inductor Industry Revenue (Million), by Type 2024 & 2032
- Figure 55: Middle East and Africa Inductor Industry Revenue Share (%), by Type 2024 & 2032
- Figure 56: Middle East and Africa Inductor Industry Revenue (Million), by Core 2024 & 2032
- Figure 57: Middle East and Africa Inductor Industry Revenue Share (%), by Core 2024 & 2032
- Figure 58: Middle East and Africa Inductor Industry Revenue (Million), by End-user Vertical 2024 & 2032
- Figure 59: Middle East and Africa Inductor Industry Revenue Share (%), by End-user Vertical 2024 & 2032
- Figure 60: Middle East and Africa Inductor Industry Revenue (Million), by Country 2024 & 2032
- Figure 61: Middle East and Africa Inductor Industry Revenue Share (%), by Country 2024 & 2032
List of Tables
- Table 1: Global Inductor Industry Revenue Million Forecast, by Region 2019 & 2032
- Table 2: Global Inductor Industry Revenue Million Forecast, by Type 2019 & 2032
- Table 3: Global Inductor Industry Revenue Million Forecast, by Core 2019 & 2032
- Table 4: Global Inductor Industry Revenue Million Forecast, by End-user Vertical 2019 & 2032
- Table 5: Global Inductor Industry Revenue Million Forecast, by Region 2019 & 2032
- Table 6: Global Inductor Industry Revenue Million Forecast, by Country 2019 & 2032
- Table 7: Inductor Industry Revenue (Million) Forecast, by Application 2019 & 2032
- Table 8: Global Inductor Industry Revenue Million Forecast, by Country 2019 & 2032
- Table 9: Inductor Industry Revenue (Million) Forecast, by Application 2019 & 2032
- Table 10: Global Inductor Industry Revenue Million Forecast, by Country 2019 & 2032
- Table 11: Inductor Industry Revenue (Million) Forecast, by Application 2019 & 2032
- Table 12: Global Inductor Industry Revenue Million Forecast, by Country 2019 & 2032
- Table 13: Inductor Industry Revenue (Million) Forecast, by Application 2019 & 2032
- Table 14: Global Inductor Industry Revenue Million Forecast, by Country 2019 & 2032
- Table 15: Inductor Industry Revenue (Million) Forecast, by Application 2019 & 2032
- Table 16: Global Inductor Industry Revenue Million Forecast, by Country 2019 & 2032
- Table 17: Inductor Industry Revenue (Million) Forecast, by Application 2019 & 2032
- Table 18: Global Inductor Industry Revenue Million Forecast, by Type 2019 & 2032
- Table 19: Global Inductor Industry Revenue Million Forecast, by Core 2019 & 2032
- Table 20: Global Inductor Industry Revenue Million Forecast, by End-user Vertical 2019 & 2032
- Table 21: Global Inductor Industry Revenue Million Forecast, by Country 2019 & 2032
- Table 22: Global Inductor Industry Revenue Million Forecast, by Type 2019 & 2032
- Table 23: Global Inductor Industry Revenue Million Forecast, by Core 2019 & 2032
- Table 24: Global Inductor Industry Revenue Million Forecast, by End-user Vertical 2019 & 2032
- Table 25: Global Inductor Industry Revenue Million Forecast, by Country 2019 & 2032
- Table 26: Global Inductor Industry Revenue Million Forecast, by Type 2019 & 2032
- Table 27: Global Inductor Industry Revenue Million Forecast, by Core 2019 & 2032
- Table 28: Global Inductor Industry Revenue Million Forecast, by End-user Vertical 2019 & 2032
- Table 29: Global Inductor Industry Revenue Million Forecast, by Country 2019 & 2032
- Table 30: Global Inductor Industry Revenue Million Forecast, by Type 2019 & 2032
- Table 31: Global Inductor Industry Revenue Million Forecast, by Core 2019 & 2032
- Table 32: Global Inductor Industry Revenue Million Forecast, by End-user Vertical 2019 & 2032
- Table 33: Global Inductor Industry Revenue Million Forecast, by Country 2019 & 2032
- Table 34: Global Inductor Industry Revenue Million Forecast, by Type 2019 & 2032
- Table 35: Global Inductor Industry Revenue Million Forecast, by Core 2019 & 2032
- Table 36: Global Inductor Industry Revenue Million Forecast, by End-user Vertical 2019 & 2032
- Table 37: Global Inductor Industry Revenue Million Forecast, by Country 2019 & 2032
- Table 38: Global Inductor Industry Revenue Million Forecast, by Type 2019 & 2032
- Table 39: Global Inductor Industry Revenue Million Forecast, by Core 2019 & 2032
- Table 40: Global Inductor Industry Revenue Million Forecast, by End-user Vertical 2019 & 2032
- Table 41: Global Inductor Industry Revenue Million Forecast, by Country 2019 & 2032
Frequently Asked Questions
1. What is the projected Compound Annual Growth Rate (CAGR) of the Inductor Industry?
The projected CAGR is approximately 4.79%.
2. Which companies are prominent players in the Inductor Industry?
Key companies in the market include Vishay Intertechnology Inc, Sumida Corporation, Delta Electronics Inc, Pulse Electronics (Yageo Corporation), Coilcraft Inc, TE Connectivity Ltd, Taiyo Yuden Co Ltd, TDK Corporation, Murata Manufacturing Co Ltd, Sagami Elec Co Ltd, Panasonic Corporation.
3. What are the main segments of the Inductor Industry?
The market segments include Type, Core, End-user Vertical.
4. Can you provide details about the market size?
The market size is estimated to be USD 10.76 Million as of 2022.
5. What are some drivers contributing to market growth?
Rise In Innovations in Consumer Electronics Products; Growing Demand for Energy-efficient Electrical and Electronic Systems.
6. What are the notable trends driving market growth?
Frequency Inductor Expected to Witness Significant Growth.
7. Are there any restraints impacting market growth?
Rising Cost of Raw Materials. Especially Copper.
8. Can you provide examples of recent developments in the market?
February 2024 - Abracon, a provider of RF and Antenna solutions, introduced its new "ATL-series" Trans-Inductor Voltage Regulator (TLVR) Inductors with the potential to transform the landscape of power delivery with high performance and reliability. The company's Trans-Inductor Voltage Regulators are designed to meet the escalating need for products that deliver rapid and efficient responses to power fluctuations across diverse applications. These include data centers, electric vehicles, cloud computing, and artificial intelligence (AI) servers. The company is investing in its product portfolio expansion to address the requirements of complex systems and work closely with customers to change the landscape of power supply design.
9. What pricing options are available for accessing the report?
Pricing options include single-user, multi-user, and enterprise licenses priced at USD 4750, USD 5250, and USD 8750 respectively.
10. Is the market size provided in terms of value or volume?
The market size is provided in terms of value, measured in Million.
11. Are there any specific market keywords associated with the report?
Yes, the market keyword associated with the report is "Inductor Industry," which aids in identifying and referencing the specific market segment covered.
12. How do I determine which pricing option suits my needs best?
The pricing options vary based on user requirements and access needs. Individual users may opt for single-user licenses, while businesses requiring broader access may choose multi-user or enterprise licenses for cost-effective access to the report.
13. Are there any additional resources or data provided in the Inductor Industry report?
While the report offers comprehensive insights, it's advisable to review the specific contents or supplementary materials provided to ascertain if additional resources or data are available.
14. How can I stay updated on further developments or reports in the Inductor Industry?
To stay informed about further developments, trends, and reports in the Inductor Industry, consider subscribing to industry newsletters, following relevant companies and organizations, or regularly checking reputable industry news sources and publications.
Methodology
Step 1 - Identification of Relevant Samples Size from Population Database


Step 2 - Approaches for Defining Global Market Size (Value, Volume* & Price*)

Note*: In applicable scenarios
Step 3 - Data Sources
Primary Research
- Web Analytics
- Survey Reports
- Research Institute
- Latest Research Reports
- Opinion Leaders
Secondary Research
- Annual Reports
- White Paper
- Latest Press Release
- Industry Association
- Paid Database
- Investor Presentations

Step 4 - Data Triangulation
Involves using different sources of information in order to increase the validity of a study
These sources are likely to be stakeholders in a program - participants, other researchers, program staff, other community members, and so on.
Then we put all data in single framework & apply various statistical tools to find out the dynamic on the market.
During the analysis stage, feedback from the stakeholder groups would be compared to determine areas of agreement as well as areas of divergence


