
Key Insights
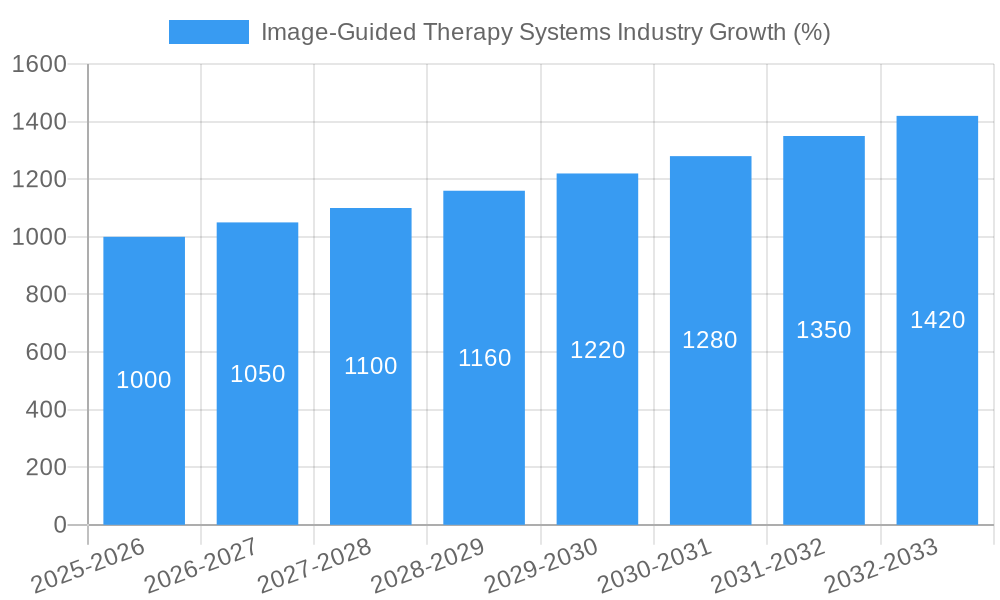
The Image-Guided Therapy Systems market is experiencing robust growth, projected at a Compound Annual Growth Rate (CAGR) of 6.50% from 2025 to 2033. This expansion is fueled by several key factors. Technological advancements in areas such as minimally invasive surgery, improved imaging resolution, and the development of sophisticated software for image processing and analysis are driving increased adoption. The aging global population, coupled with a rising prevalence of chronic diseases requiring surgical intervention, further contributes to market growth. Furthermore, the increasing demand for efficient and precise surgical procedures, leading to shorter hospital stays and faster patient recovery, is a significant driver. Neurosurgery, cardiac surgery, and orthopedics represent major application segments, while hospitals and ambulatory surgery centers are key end-users. Competition is intense, with established players like Siemens Healthineers, Philips, and GE Healthcare vying for market share alongside specialized companies like KARL STORZ and Brainlab. While the market faces some restraints, including high initial investment costs for advanced systems and the need for specialized training, the overall growth trajectory remains positive. North America currently holds a substantial market share due to advanced healthcare infrastructure and high adoption rates. However, emerging economies in Asia-Pacific and other regions are exhibiting rapid growth, driven by increasing healthcare spending and rising awareness of image-guided therapy benefits.
The forecast period of 2025-2033 indicates continued expansion across all segments. Specific growth in regions like Asia-Pacific is expected to outpace North America and Europe, albeit from a smaller base. Product segments, such as ultrasound systems and CT scanners, are expected to remain dominant due to their widespread availability and affordability relative to MRI and PET systems. The market will likely witness continued innovation in areas like AI-powered image analysis and robotics integration within image-guided therapy systems, further enhancing precision and efficiency. Strategic partnerships, mergers, and acquisitions will likely continue shaping the competitive landscape, with companies focusing on expanding their product portfolios and geographical reach. This signifies ongoing consolidation and growth within the industry.
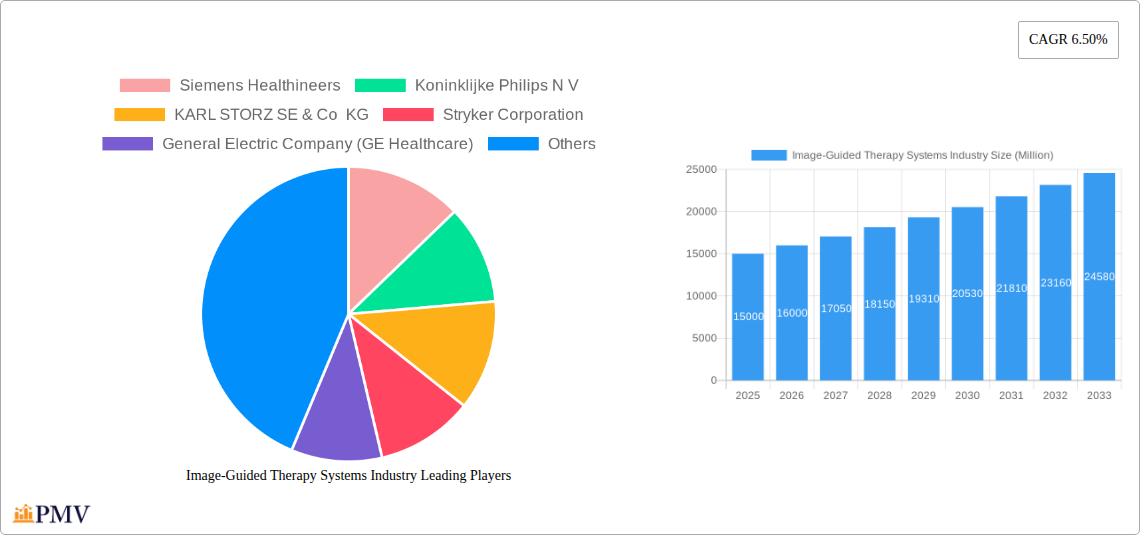
Image-Guided Therapy Systems Market Report: 2019-2033
This comprehensive report provides a detailed analysis of the Image-Guided Therapy Systems market, offering actionable insights for stakeholders across the industry. The report covers the period 2019-2033, with a focus on the forecast period 2025-2033 and a base year of 2025. The market is segmented by application, end-user, and product type, providing a granular understanding of market dynamics and growth opportunities. Key players like Siemens Healthineers, Philips, and others are profiled, offering a competitive landscape analysis. The report's value lies in its detailed market sizing, growth projections, and identification of key trends and challenges within this rapidly evolving sector. The expected market size in 2025 is estimated at xx Million, projecting a significant growth to xx Million by 2033, representing a CAGR of xx%.
Image-Guided Therapy Systems Industry Market Structure & Competitive Dynamics
The Image-Guided Therapy Systems market is moderately concentrated, with several major players holding significant market share. Siemens Healthineers, Koninklijke Philips N.V., and General Electric Company (GE Healthcare) are among the leading companies, collectively accounting for an estimated xx% of the global market share in 2024. However, smaller, specialized companies are also contributing significantly through innovation and niche market penetration. The industry exhibits a dynamic innovation ecosystem, driven by ongoing advancements in medical imaging technologies, such as AI-powered image analysis and minimally invasive surgical techniques. Stringent regulatory frameworks, particularly in regions like North America and Europe, influence market entry and product approvals. The market also experiences competitive pressures from substitute technologies, although image-guided therapy remains crucial for many procedures. End-user trends indicate a preference for technologically advanced systems that enhance efficiency, improve patient outcomes, and minimize risks. Mergers and acquisitions (M&A) activity is a common strategic tool, with recent deals valued at approximately xx Million in 2024, primarily focused on expanding product portfolios and geographical reach. Examples include [Insert example M&A activity if available. If not, state "Data unavailable."].
Image-Guided Therapy Systems Industry Industry Trends & Insights
The Image-Guided Therapy Systems market is experiencing robust growth, driven by several key factors. The rising prevalence of chronic diseases necessitating minimally invasive procedures fuels demand for advanced image-guided systems. Technological advancements, such as the integration of AI and machine learning, are enhancing the accuracy and efficiency of procedures. This contributes to improved patient outcomes and reduced recovery times, further stimulating market expansion. Consumer preferences are shifting towards personalized medicine, and image-guided therapy aligns perfectly with this trend by allowing for precise targeting and tailored treatments. The competitive landscape is characterized by continuous innovation and strategic partnerships, with companies actively investing in R&D to develop cutting-edge technologies. The market is witnessing a significant increase in the adoption of advanced imaging modalities, like PET and MRI, in various surgical applications. This trend reflects the increasing preference for highly accurate and detailed imaging during procedures. Market penetration of image-guided therapy is steadily increasing across various healthcare settings, particularly in developed nations with well-established healthcare infrastructure. However, high initial investment costs and the need for specialized training remain challenges to wider adoption in certain regions. The market is anticipated to reach xx Million by 2033, at a CAGR of xx% between 2025 and 2033.
Dominant Markets & Segments in Image-Guided Therapy Systems Industry
The North American region dominates the Image-Guided Therapy Systems market, driven by factors including high healthcare expenditure, advanced medical infrastructure, and early adoption of new technologies. Within applications, Neurosurgery and Cardiac Surgery represent the largest segments, owing to the high prevalence of related conditions and the complexity of procedures demanding precise image guidance. Hospitals remain the primary end-users, followed by ambulatory surgery centers. In terms of product types, Ultrasound Systems and Computed Tomography (CT) Scanners currently hold the largest market share.
Key Drivers in North America:
- High healthcare expenditure
- Advanced medical infrastructure
- Early adoption of new technologies
- Strong regulatory environment supporting innovation
Key Drivers in Neurosurgery and Cardiac Surgery:
- High prevalence of related conditions
- Complex procedures requiring precise guidance
- High success rates with image-guided interventions
Key Drivers for Hospitals and Ultrasound Systems:
- Established infrastructure and expertise
- Wide applicability and cost-effectiveness of ultrasound.
The market’s dominance in these segments is reinforced by the continued advancements in these specific areas, resulting in increased procedural accuracy and improved patient outcomes. The strong preference for these segments showcases the significant potential for growth and further innovation in the future.
Image-Guided Therapy Systems Industry Product Innovations
Recent advancements in image-guided therapy systems include the integration of artificial intelligence for enhanced image analysis, improved visualization, and robotic-assisted surgery. This leads to increased accuracy, reduced invasiveness, and better patient outcomes. Miniaturization of imaging devices and improved sensor technologies are enabling less-invasive procedures, and the introduction of advanced software improves image processing and navigation. These innovations not only improve therapeutic effectiveness but also streamline workflow and reduce procedural time. The trend towards personalized medicine further drives innovation by emphasizing tailored treatments and precise targeting based on individual patient characteristics.
Report Segmentation & Scope
This report segments the Image-Guided Therapy Systems market comprehensively across three key dimensions:
Application: Neurosurgery, Cardiac Surgery, Urology, Orthopedic Surgery, and Others. Each segment shows distinct growth projections, driven by specific technological advancements and disease prevalence.
End-user: Hospitals, Ambulatory Surgery Centers, and Clinics. Market size and competitive dynamics vary across these end-users based on their infrastructure and technological capabilities.
Product Type: Ultrasound Systems, Computed Tomography (CT) Scanners, Magnetic Resonance Imaging (MRI), Endoscopes, Positron Emission Tomography (PET), and Others. Each product type exhibits its own market dynamics related to technological complexity, cost, and clinical applications. Each segment's growth is influenced by specific technological advancements, regulatory changes, and reimbursement policies.
Key Drivers of Image-Guided Therapy Systems Industry Growth
Several factors drive the growth of the Image-Guided Therapy Systems market. Firstly, technological advancements like AI-driven image processing and robotic assistance are improving procedural accuracy and minimizing invasiveness. Secondly, the rising prevalence of chronic diseases necessitates more minimally invasive procedures, boosting demand. Finally, favorable reimbursement policies and increasing healthcare expenditure in developed and emerging economies support market expansion. Examples of this include the increasing adoption of minimally invasive cardiac procedures and the rise in neuro-interventional techniques.
Challenges in the Image-Guided Therapy Systems Industry Sector
The Image-Guided Therapy Systems market faces several challenges. Stringent regulatory approvals and high development costs can hinder market entry for new players. Supply chain disruptions can impact the availability and cost of components, impacting profitability. Furthermore, intense competition among established players and the emergence of new technologies necessitate continuous innovation and adaptation to maintain market share. The high cost of equipment and training can also limit wider adoption in resource-constrained settings. These challenges, if not addressed effectively, can impede the overall growth and expansion of the market.
Leading Players in the Image-Guided Therapy Systems Industry Market
- Siemens Healthineers
- Koninklijke Philips N.V.
- KARL STORZ SE & Co KG
- Stryker Corporation
- General Electric Company (GE Healthcare)
- Medtronic Plc
- Brainlab
- Altaris Capital Partners LLC (Analogic Corporation)
- Olympus Corporation
Key Developments in Image-Guided Therapy Systems Industry Sector
May 2022: Philips launched EchoNavigator 4.0, enhancing its image-guided therapy solution for structural heart disease, improving live fusion imaging on its Azurion platform. This development strengthens Philips' position in the cardiac surgery segment.
March 2022: Philips introduced the Azurion System with an ambient experience using FlexVision, creating a calming atmosphere for patients during procedures. This enhances the patient experience and potentially improves procedural efficiency.
Strategic Image-Guided Therapy Systems Industry Market Outlook
The Image-Guided Therapy Systems market exhibits substantial future growth potential. Continued technological advancements, particularly in AI and robotics, will drive market expansion. Strategic collaborations between imaging device manufacturers and surgical instrument companies will create integrated solutions. Expansion into emerging markets with increasing healthcare expenditure and a growing need for minimally invasive procedures presents significant opportunities. The focus on personalized medicine and the development of data-driven treatment strategies further strengthens the growth outlook.
Image-Guided Therapy Systems Industry Segmentation
-
1. Product Type
- 1.1. Ultrasound Systems
- 1.2. Computed Tomography (CT) Scanners
- 1.3. Magnetic Resonance Imaging (MRI)
- 1.4. Endoscopes
- 1.5. Positron Emission Tomography (PET)
- 1.6. Others
-
2. Application
- 2.1. Neurosurgery
- 2.2. Cardiac Surgery
- 2.3. Urology
- 2.4. Orthopedic Surgery
- 2.5. Others
-
3. End-user
- 3.1. Hospitals
- 3.2. Ambulatory Surgery Centers
- 3.3. Clinics
Image-Guided Therapy Systems Industry Segmentation By Geography
-
1. North America
- 1.1. United States
- 1.2. Canada
- 1.3. Mexico
-
2. Europe
- 2.1. Germany
- 2.2. United Kingdom
- 2.3. France
- 2.4. Italy
- 2.5. Spain
- 2.6. Rest of Europe
-
3. Asia Pacific
- 3.1. China
- 3.2. Japan
- 3.3. India
- 3.4. Australia
- 3.5. South Korea
- 3.6. Rest of Asia Pacific
-
4. Middle East and Africa
- 4.1. GCC
- 4.2. South Africa
- 4.3. Rest of Middle East and Africa
-
5. South America
- 5.1. Brazil
- 5.2. Argentina
- 5.3. Rest of South America
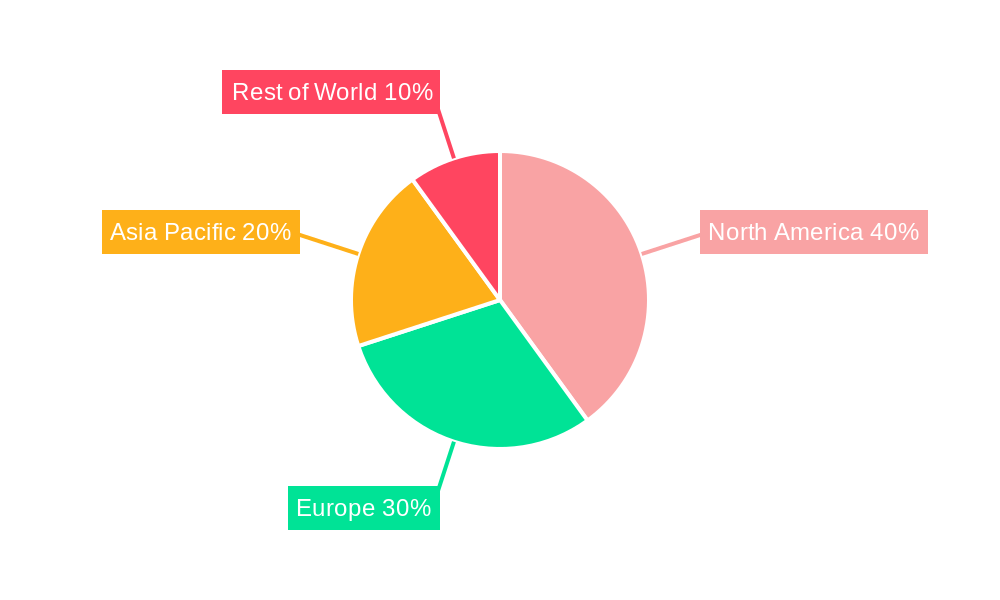
Image-Guided Therapy Systems Industry REPORT HIGHLIGHTS
| Aspects | Details |
|---|---|
| Study Period | 2019-2033 |
| Base Year | 2024 |
| Estimated Year | 2025 |
| Forecast Period | 2025-2033 |
| Historical Period | 2019-2024 |
| Growth Rate | CAGR of 6.50% from 2019-2033 |
| Segmentation |
|
Table of Contents
- 1. Introduction
- 1.1. Research Scope
- 1.2. Market Segmentation
- 1.3. Research Methodology
- 1.4. Definitions and Assumptions
- 2. Executive Summary
- 2.1. Introduction
- 3. Market Dynamics
- 3.1. Introduction
- 3.2. Market Drivers
- 3.2.1. Increase in the Geriatric Population; Rising Burden of Chronic Diseases; Increase in the Number of Initiatives for Cancer Radiotherapy
- 3.3. Market Restrains
- 3.3.1. High Price of Image-Guided Therapy Systems
- 3.4. Market Trends
- 3.4.1. Endoscopes Segment is Expected to Hold a Significant Market Share in the Image Guided Therapy System Market
- 4. Market Factor Analysis
- 4.1. Porters Five Forces
- 4.2. Supply/Value Chain
- 4.3. PESTEL analysis
- 4.4. Market Entropy
- 4.5. Patent/Trademark Analysis
- 5. Global Image-Guided Therapy Systems Industry Analysis, Insights and Forecast, 2019-2031
- 5.1. Market Analysis, Insights and Forecast - by Product Type
- 5.1.1. Ultrasound Systems
- 5.1.2. Computed Tomography (CT) Scanners
- 5.1.3. Magnetic Resonance Imaging (MRI)
- 5.1.4. Endoscopes
- 5.1.5. Positron Emission Tomography (PET)
- 5.1.6. Others
- 5.2. Market Analysis, Insights and Forecast - by Application
- 5.2.1. Neurosurgery
- 5.2.2. Cardiac Surgery
- 5.2.3. Urology
- 5.2.4. Orthopedic Surgery
- 5.2.5. Others
- 5.3. Market Analysis, Insights and Forecast - by End-user
- 5.3.1. Hospitals
- 5.3.2. Ambulatory Surgery Centers
- 5.3.3. Clinics
- 5.4. Market Analysis, Insights and Forecast - by Region
- 5.4.1. North America
- 5.4.2. Europe
- 5.4.3. Asia Pacific
- 5.4.4. Middle East and Africa
- 5.4.5. South America
- 5.1. Market Analysis, Insights and Forecast - by Product Type
- 6. North America Image-Guided Therapy Systems Industry Analysis, Insights and Forecast, 2019-2031
- 6.1. Market Analysis, Insights and Forecast - by Product Type
- 6.1.1. Ultrasound Systems
- 6.1.2. Computed Tomography (CT) Scanners
- 6.1.3. Magnetic Resonance Imaging (MRI)
- 6.1.4. Endoscopes
- 6.1.5. Positron Emission Tomography (PET)
- 6.1.6. Others
- 6.2. Market Analysis, Insights and Forecast - by Application
- 6.2.1. Neurosurgery
- 6.2.2. Cardiac Surgery
- 6.2.3. Urology
- 6.2.4. Orthopedic Surgery
- 6.2.5. Others
- 6.3. Market Analysis, Insights and Forecast - by End-user
- 6.3.1. Hospitals
- 6.3.2. Ambulatory Surgery Centers
- 6.3.3. Clinics
- 6.1. Market Analysis, Insights and Forecast - by Product Type
- 7. Europe Image-Guided Therapy Systems Industry Analysis, Insights and Forecast, 2019-2031
- 7.1. Market Analysis, Insights and Forecast - by Product Type
- 7.1.1. Ultrasound Systems
- 7.1.2. Computed Tomography (CT) Scanners
- 7.1.3. Magnetic Resonance Imaging (MRI)
- 7.1.4. Endoscopes
- 7.1.5. Positron Emission Tomography (PET)
- 7.1.6. Others
- 7.2. Market Analysis, Insights and Forecast - by Application
- 7.2.1. Neurosurgery
- 7.2.2. Cardiac Surgery
- 7.2.3. Urology
- 7.2.4. Orthopedic Surgery
- 7.2.5. Others
- 7.3. Market Analysis, Insights and Forecast - by End-user
- 7.3.1. Hospitals
- 7.3.2. Ambulatory Surgery Centers
- 7.3.3. Clinics
- 7.1. Market Analysis, Insights and Forecast - by Product Type
- 8. Asia Pacific Image-Guided Therapy Systems Industry Analysis, Insights and Forecast, 2019-2031
- 8.1. Market Analysis, Insights and Forecast - by Product Type
- 8.1.1. Ultrasound Systems
- 8.1.2. Computed Tomography (CT) Scanners
- 8.1.3. Magnetic Resonance Imaging (MRI)
- 8.1.4. Endoscopes
- 8.1.5. Positron Emission Tomography (PET)
- 8.1.6. Others
- 8.2. Market Analysis, Insights and Forecast - by Application
- 8.2.1. Neurosurgery
- 8.2.2. Cardiac Surgery
- 8.2.3. Urology
- 8.2.4. Orthopedic Surgery
- 8.2.5. Others
- 8.3. Market Analysis, Insights and Forecast - by End-user
- 8.3.1. Hospitals
- 8.3.2. Ambulatory Surgery Centers
- 8.3.3. Clinics
- 8.1. Market Analysis, Insights and Forecast - by Product Type
- 9. Middle East and Africa Image-Guided Therapy Systems Industry Analysis, Insights and Forecast, 2019-2031
- 9.1. Market Analysis, Insights and Forecast - by Product Type
- 9.1.1. Ultrasound Systems
- 9.1.2. Computed Tomography (CT) Scanners
- 9.1.3. Magnetic Resonance Imaging (MRI)
- 9.1.4. Endoscopes
- 9.1.5. Positron Emission Tomography (PET)
- 9.1.6. Others
- 9.2. Market Analysis, Insights and Forecast - by Application
- 9.2.1. Neurosurgery
- 9.2.2. Cardiac Surgery
- 9.2.3. Urology
- 9.2.4. Orthopedic Surgery
- 9.2.5. Others
- 9.3. Market Analysis, Insights and Forecast - by End-user
- 9.3.1. Hospitals
- 9.3.2. Ambulatory Surgery Centers
- 9.3.3. Clinics
- 9.1. Market Analysis, Insights and Forecast - by Product Type
- 10. South America Image-Guided Therapy Systems Industry Analysis, Insights and Forecast, 2019-2031
- 10.1. Market Analysis, Insights and Forecast - by Product Type
- 10.1.1. Ultrasound Systems
- 10.1.2. Computed Tomography (CT) Scanners
- 10.1.3. Magnetic Resonance Imaging (MRI)
- 10.1.4. Endoscopes
- 10.1.5. Positron Emission Tomography (PET)
- 10.1.6. Others
- 10.2. Market Analysis, Insights and Forecast - by Application
- 10.2.1. Neurosurgery
- 10.2.2. Cardiac Surgery
- 10.2.3. Urology
- 10.2.4. Orthopedic Surgery
- 10.2.5. Others
- 10.3. Market Analysis, Insights and Forecast - by End-user
- 10.3.1. Hospitals
- 10.3.2. Ambulatory Surgery Centers
- 10.3.3. Clinics
- 10.1. Market Analysis, Insights and Forecast - by Product Type
- 11. North America Image-Guided Therapy Systems Industry Analysis, Insights and Forecast, 2019-2031
- 11.1. Market Analysis, Insights and Forecast - By Country/Sub-region
- 11.1.1 United States
- 11.1.2 Canada
- 11.1.3 Mexico
- 12. Europe Image-Guided Therapy Systems Industry Analysis, Insights and Forecast, 2019-2031
- 12.1. Market Analysis, Insights and Forecast - By Country/Sub-region
- 12.1.1 Germany
- 12.1.2 United Kingdom
- 12.1.3 France
- 12.1.4 Italy
- 12.1.5 Spain
- 12.1.6 Rest of Europe
- 13. Asia Pacific Image-Guided Therapy Systems Industry Analysis, Insights and Forecast, 2019-2031
- 13.1. Market Analysis, Insights and Forecast - By Country/Sub-region
- 13.1.1 China
- 13.1.2 Japan
- 13.1.3 India
- 13.1.4 Australia
- 13.1.5 South Korea
- 13.1.6 Rest of Asia Pacific
- 14. Middle East and Africa Image-Guided Therapy Systems Industry Analysis, Insights and Forecast, 2019-2031
- 14.1. Market Analysis, Insights and Forecast - By Country/Sub-region
- 14.1.1 GCC
- 14.1.2 South Africa
- 14.1.3 Rest of Middle East and Africa
- 15. South America Image-Guided Therapy Systems Industry Analysis, Insights and Forecast, 2019-2031
- 15.1. Market Analysis, Insights and Forecast - By Country/Sub-region
- 15.1.1 Brazil
- 15.1.2 Argentina
- 15.1.3 Rest of South America
- 16. Competitive Analysis
- 16.1. Global Market Share Analysis 2024
- 16.2. Company Profiles
- 16.2.1 Siemens Healthineers
- 16.2.1.1. Overview
- 16.2.1.2. Products
- 16.2.1.3. SWOT Analysis
- 16.2.1.4. Recent Developments
- 16.2.1.5. Financials (Based on Availability)
- 16.2.2 Koninklijke Philips N V
- 16.2.2.1. Overview
- 16.2.2.2. Products
- 16.2.2.3. SWOT Analysis
- 16.2.2.4. Recent Developments
- 16.2.2.5. Financials (Based on Availability)
- 16.2.3 KARL STORZ SE & Co KG
- 16.2.3.1. Overview
- 16.2.3.2. Products
- 16.2.3.3. SWOT Analysis
- 16.2.3.4. Recent Developments
- 16.2.3.5. Financials (Based on Availability)
- 16.2.4 Stryker Corporation
- 16.2.4.1. Overview
- 16.2.4.2. Products
- 16.2.4.3. SWOT Analysis
- 16.2.4.4. Recent Developments
- 16.2.4.5. Financials (Based on Availability)
- 16.2.5 General Electric Company (GE Healthcare)
- 16.2.5.1. Overview
- 16.2.5.2. Products
- 16.2.5.3. SWOT Analysis
- 16.2.5.4. Recent Developments
- 16.2.5.5. Financials (Based on Availability)
- 16.2.6 Medtronic Plc
- 16.2.6.1. Overview
- 16.2.6.2. Products
- 16.2.6.3. SWOT Analysis
- 16.2.6.4. Recent Developments
- 16.2.6.5. Financials (Based on Availability)
- 16.2.7 Brainlab
- 16.2.7.1. Overview
- 16.2.7.2. Products
- 16.2.7.3. SWOT Analysis
- 16.2.7.4. Recent Developments
- 16.2.7.5. Financials (Based on Availability)
- 16.2.8 Altaris Capital Partners LLC (Analogic Corporation)
- 16.2.8.1. Overview
- 16.2.8.2. Products
- 16.2.8.3. SWOT Analysis
- 16.2.8.4. Recent Developments
- 16.2.8.5. Financials (Based on Availability)
- 16.2.9 Olympus Corporation
- 16.2.9.1. Overview
- 16.2.9.2. Products
- 16.2.9.3. SWOT Analysis
- 16.2.9.4. Recent Developments
- 16.2.9.5. Financials (Based on Availability)
- 16.2.1 Siemens Healthineers
List of Figures
- Figure 1: Global Image-Guided Therapy Systems Industry Revenue Breakdown (Million, %) by Region 2024 & 2032
- Figure 2: North America Image-Guided Therapy Systems Industry Revenue (Million), by Country 2024 & 2032
- Figure 3: North America Image-Guided Therapy Systems Industry Revenue Share (%), by Country 2024 & 2032
- Figure 4: Europe Image-Guided Therapy Systems Industry Revenue (Million), by Country 2024 & 2032
- Figure 5: Europe Image-Guided Therapy Systems Industry Revenue Share (%), by Country 2024 & 2032
- Figure 6: Asia Pacific Image-Guided Therapy Systems Industry Revenue (Million), by Country 2024 & 2032
- Figure 7: Asia Pacific Image-Guided Therapy Systems Industry Revenue Share (%), by Country 2024 & 2032
- Figure 8: Middle East and Africa Image-Guided Therapy Systems Industry Revenue (Million), by Country 2024 & 2032
- Figure 9: Middle East and Africa Image-Guided Therapy Systems Industry Revenue Share (%), by Country 2024 & 2032
- Figure 10: South America Image-Guided Therapy Systems Industry Revenue (Million), by Country 2024 & 2032
- Figure 11: South America Image-Guided Therapy Systems Industry Revenue Share (%), by Country 2024 & 2032
- Figure 12: North America Image-Guided Therapy Systems Industry Revenue (Million), by Product Type 2024 & 2032
- Figure 13: North America Image-Guided Therapy Systems Industry Revenue Share (%), by Product Type 2024 & 2032
- Figure 14: North America Image-Guided Therapy Systems Industry Revenue (Million), by Application 2024 & 2032
- Figure 15: North America Image-Guided Therapy Systems Industry Revenue Share (%), by Application 2024 & 2032
- Figure 16: North America Image-Guided Therapy Systems Industry Revenue (Million), by End-user 2024 & 2032
- Figure 17: North America Image-Guided Therapy Systems Industry Revenue Share (%), by End-user 2024 & 2032
- Figure 18: North America Image-Guided Therapy Systems Industry Revenue (Million), by Country 2024 & 2032
- Figure 19: North America Image-Guided Therapy Systems Industry Revenue Share (%), by Country 2024 & 2032
- Figure 20: Europe Image-Guided Therapy Systems Industry Revenue (Million), by Product Type 2024 & 2032
- Figure 21: Europe Image-Guided Therapy Systems Industry Revenue Share (%), by Product Type 2024 & 2032
- Figure 22: Europe Image-Guided Therapy Systems Industry Revenue (Million), by Application 2024 & 2032
- Figure 23: Europe Image-Guided Therapy Systems Industry Revenue Share (%), by Application 2024 & 2032
- Figure 24: Europe Image-Guided Therapy Systems Industry Revenue (Million), by End-user 2024 & 2032
- Figure 25: Europe Image-Guided Therapy Systems Industry Revenue Share (%), by End-user 2024 & 2032
- Figure 26: Europe Image-Guided Therapy Systems Industry Revenue (Million), by Country 2024 & 2032
- Figure 27: Europe Image-Guided Therapy Systems Industry Revenue Share (%), by Country 2024 & 2032
- Figure 28: Asia Pacific Image-Guided Therapy Systems Industry Revenue (Million), by Product Type 2024 & 2032
- Figure 29: Asia Pacific Image-Guided Therapy Systems Industry Revenue Share (%), by Product Type 2024 & 2032
- Figure 30: Asia Pacific Image-Guided Therapy Systems Industry Revenue (Million), by Application 2024 & 2032
- Figure 31: Asia Pacific Image-Guided Therapy Systems Industry Revenue Share (%), by Application 2024 & 2032
- Figure 32: Asia Pacific Image-Guided Therapy Systems Industry Revenue (Million), by End-user 2024 & 2032
- Figure 33: Asia Pacific Image-Guided Therapy Systems Industry Revenue Share (%), by End-user 2024 & 2032
- Figure 34: Asia Pacific Image-Guided Therapy Systems Industry Revenue (Million), by Country 2024 & 2032
- Figure 35: Asia Pacific Image-Guided Therapy Systems Industry Revenue Share (%), by Country 2024 & 2032
- Figure 36: Middle East and Africa Image-Guided Therapy Systems Industry Revenue (Million), by Product Type 2024 & 2032
- Figure 37: Middle East and Africa Image-Guided Therapy Systems Industry Revenue Share (%), by Product Type 2024 & 2032
- Figure 38: Middle East and Africa Image-Guided Therapy Systems Industry Revenue (Million), by Application 2024 & 2032
- Figure 39: Middle East and Africa Image-Guided Therapy Systems Industry Revenue Share (%), by Application 2024 & 2032
- Figure 40: Middle East and Africa Image-Guided Therapy Systems Industry Revenue (Million), by End-user 2024 & 2032
- Figure 41: Middle East and Africa Image-Guided Therapy Systems Industry Revenue Share (%), by End-user 2024 & 2032
- Figure 42: Middle East and Africa Image-Guided Therapy Systems Industry Revenue (Million), by Country 2024 & 2032
- Figure 43: Middle East and Africa Image-Guided Therapy Systems Industry Revenue Share (%), by Country 2024 & 2032
- Figure 44: South America Image-Guided Therapy Systems Industry Revenue (Million), by Product Type 2024 & 2032
- Figure 45: South America Image-Guided Therapy Systems Industry Revenue Share (%), by Product Type 2024 & 2032
- Figure 46: South America Image-Guided Therapy Systems Industry Revenue (Million), by Application 2024 & 2032
- Figure 47: South America Image-Guided Therapy Systems Industry Revenue Share (%), by Application 2024 & 2032
- Figure 48: South America Image-Guided Therapy Systems Industry Revenue (Million), by End-user 2024 & 2032
- Figure 49: South America Image-Guided Therapy Systems Industry Revenue Share (%), by End-user 2024 & 2032
- Figure 50: South America Image-Guided Therapy Systems Industry Revenue (Million), by Country 2024 & 2032
- Figure 51: South America Image-Guided Therapy Systems Industry Revenue Share (%), by Country 2024 & 2032
List of Tables
- Table 1: Global Image-Guided Therapy Systems Industry Revenue Million Forecast, by Region 2019 & 2032
- Table 2: Global Image-Guided Therapy Systems Industry Revenue Million Forecast, by Product Type 2019 & 2032
- Table 3: Global Image-Guided Therapy Systems Industry Revenue Million Forecast, by Application 2019 & 2032
- Table 4: Global Image-Guided Therapy Systems Industry Revenue Million Forecast, by End-user 2019 & 2032
- Table 5: Global Image-Guided Therapy Systems Industry Revenue Million Forecast, by Region 2019 & 2032
- Table 6: Global Image-Guided Therapy Systems Industry Revenue Million Forecast, by Country 2019 & 2032
- Table 7: United States Image-Guided Therapy Systems Industry Revenue (Million) Forecast, by Application 2019 & 2032
- Table 8: Canada Image-Guided Therapy Systems Industry Revenue (Million) Forecast, by Application 2019 & 2032
- Table 9: Mexico Image-Guided Therapy Systems Industry Revenue (Million) Forecast, by Application 2019 & 2032
- Table 10: Global Image-Guided Therapy Systems Industry Revenue Million Forecast, by Country 2019 & 2032
- Table 11: Germany Image-Guided Therapy Systems Industry Revenue (Million) Forecast, by Application 2019 & 2032
- Table 12: United Kingdom Image-Guided Therapy Systems Industry Revenue (Million) Forecast, by Application 2019 & 2032
- Table 13: France Image-Guided Therapy Systems Industry Revenue (Million) Forecast, by Application 2019 & 2032
- Table 14: Italy Image-Guided Therapy Systems Industry Revenue (Million) Forecast, by Application 2019 & 2032
- Table 15: Spain Image-Guided Therapy Systems Industry Revenue (Million) Forecast, by Application 2019 & 2032
- Table 16: Rest of Europe Image-Guided Therapy Systems Industry Revenue (Million) Forecast, by Application 2019 & 2032
- Table 17: Global Image-Guided Therapy Systems Industry Revenue Million Forecast, by Country 2019 & 2032
- Table 18: China Image-Guided Therapy Systems Industry Revenue (Million) Forecast, by Application 2019 & 2032
- Table 19: Japan Image-Guided Therapy Systems Industry Revenue (Million) Forecast, by Application 2019 & 2032
- Table 20: India Image-Guided Therapy Systems Industry Revenue (Million) Forecast, by Application 2019 & 2032
- Table 21: Australia Image-Guided Therapy Systems Industry Revenue (Million) Forecast, by Application 2019 & 2032
- Table 22: South Korea Image-Guided Therapy Systems Industry Revenue (Million) Forecast, by Application 2019 & 2032
- Table 23: Rest of Asia Pacific Image-Guided Therapy Systems Industry Revenue (Million) Forecast, by Application 2019 & 2032
- Table 24: Global Image-Guided Therapy Systems Industry Revenue Million Forecast, by Country 2019 & 2032
- Table 25: GCC Image-Guided Therapy Systems Industry Revenue (Million) Forecast, by Application 2019 & 2032
- Table 26: South Africa Image-Guided Therapy Systems Industry Revenue (Million) Forecast, by Application 2019 & 2032
- Table 27: Rest of Middle East and Africa Image-Guided Therapy Systems Industry Revenue (Million) Forecast, by Application 2019 & 2032
- Table 28: Global Image-Guided Therapy Systems Industry Revenue Million Forecast, by Country 2019 & 2032
- Table 29: Brazil Image-Guided Therapy Systems Industry Revenue (Million) Forecast, by Application 2019 & 2032
- Table 30: Argentina Image-Guided Therapy Systems Industry Revenue (Million) Forecast, by Application 2019 & 2032
- Table 31: Rest of South America Image-Guided Therapy Systems Industry Revenue (Million) Forecast, by Application 2019 & 2032
- Table 32: Global Image-Guided Therapy Systems Industry Revenue Million Forecast, by Product Type 2019 & 2032
- Table 33: Global Image-Guided Therapy Systems Industry Revenue Million Forecast, by Application 2019 & 2032
- Table 34: Global Image-Guided Therapy Systems Industry Revenue Million Forecast, by End-user 2019 & 2032
- Table 35: Global Image-Guided Therapy Systems Industry Revenue Million Forecast, by Country 2019 & 2032
- Table 36: United States Image-Guided Therapy Systems Industry Revenue (Million) Forecast, by Application 2019 & 2032
- Table 37: Canada Image-Guided Therapy Systems Industry Revenue (Million) Forecast, by Application 2019 & 2032
- Table 38: Mexico Image-Guided Therapy Systems Industry Revenue (Million) Forecast, by Application 2019 & 2032
- Table 39: Global Image-Guided Therapy Systems Industry Revenue Million Forecast, by Product Type 2019 & 2032
- Table 40: Global Image-Guided Therapy Systems Industry Revenue Million Forecast, by Application 2019 & 2032
- Table 41: Global Image-Guided Therapy Systems Industry Revenue Million Forecast, by End-user 2019 & 2032
- Table 42: Global Image-Guided Therapy Systems Industry Revenue Million Forecast, by Country 2019 & 2032
- Table 43: Germany Image-Guided Therapy Systems Industry Revenue (Million) Forecast, by Application 2019 & 2032
- Table 44: United Kingdom Image-Guided Therapy Systems Industry Revenue (Million) Forecast, by Application 2019 & 2032
- Table 45: France Image-Guided Therapy Systems Industry Revenue (Million) Forecast, by Application 2019 & 2032
- Table 46: Italy Image-Guided Therapy Systems Industry Revenue (Million) Forecast, by Application 2019 & 2032
- Table 47: Spain Image-Guided Therapy Systems Industry Revenue (Million) Forecast, by Application 2019 & 2032
- Table 48: Rest of Europe Image-Guided Therapy Systems Industry Revenue (Million) Forecast, by Application 2019 & 2032
- Table 49: Global Image-Guided Therapy Systems Industry Revenue Million Forecast, by Product Type 2019 & 2032
- Table 50: Global Image-Guided Therapy Systems Industry Revenue Million Forecast, by Application 2019 & 2032
- Table 51: Global Image-Guided Therapy Systems Industry Revenue Million Forecast, by End-user 2019 & 2032
- Table 52: Global Image-Guided Therapy Systems Industry Revenue Million Forecast, by Country 2019 & 2032
- Table 53: China Image-Guided Therapy Systems Industry Revenue (Million) Forecast, by Application 2019 & 2032
- Table 54: Japan Image-Guided Therapy Systems Industry Revenue (Million) Forecast, by Application 2019 & 2032
- Table 55: India Image-Guided Therapy Systems Industry Revenue (Million) Forecast, by Application 2019 & 2032
- Table 56: Australia Image-Guided Therapy Systems Industry Revenue (Million) Forecast, by Application 2019 & 2032
- Table 57: South Korea Image-Guided Therapy Systems Industry Revenue (Million) Forecast, by Application 2019 & 2032
- Table 58: Rest of Asia Pacific Image-Guided Therapy Systems Industry Revenue (Million) Forecast, by Application 2019 & 2032
- Table 59: Global Image-Guided Therapy Systems Industry Revenue Million Forecast, by Product Type 2019 & 2032
- Table 60: Global Image-Guided Therapy Systems Industry Revenue Million Forecast, by Application 2019 & 2032
- Table 61: Global Image-Guided Therapy Systems Industry Revenue Million Forecast, by End-user 2019 & 2032
- Table 62: Global Image-Guided Therapy Systems Industry Revenue Million Forecast, by Country 2019 & 2032
- Table 63: GCC Image-Guided Therapy Systems Industry Revenue (Million) Forecast, by Application 2019 & 2032
- Table 64: South Africa Image-Guided Therapy Systems Industry Revenue (Million) Forecast, by Application 2019 & 2032
- Table 65: Rest of Middle East and Africa Image-Guided Therapy Systems Industry Revenue (Million) Forecast, by Application 2019 & 2032
- Table 66: Global Image-Guided Therapy Systems Industry Revenue Million Forecast, by Product Type 2019 & 2032
- Table 67: Global Image-Guided Therapy Systems Industry Revenue Million Forecast, by Application 2019 & 2032
- Table 68: Global Image-Guided Therapy Systems Industry Revenue Million Forecast, by End-user 2019 & 2032
- Table 69: Global Image-Guided Therapy Systems Industry Revenue Million Forecast, by Country 2019 & 2032
- Table 70: Brazil Image-Guided Therapy Systems Industry Revenue (Million) Forecast, by Application 2019 & 2032
- Table 71: Argentina Image-Guided Therapy Systems Industry Revenue (Million) Forecast, by Application 2019 & 2032
- Table 72: Rest of South America Image-Guided Therapy Systems Industry Revenue (Million) Forecast, by Application 2019 & 2032
Frequently Asked Questions
1. What is the projected Compound Annual Growth Rate (CAGR) of the Image-Guided Therapy Systems Industry?
The projected CAGR is approximately 6.50%.
2. Which companies are prominent players in the Image-Guided Therapy Systems Industry?
Key companies in the market include Siemens Healthineers, Koninklijke Philips N V, KARL STORZ SE & Co KG, Stryker Corporation, General Electric Company (GE Healthcare), Medtronic Plc, Brainlab, Altaris Capital Partners LLC (Analogic Corporation), Olympus Corporation.
3. What are the main segments of the Image-Guided Therapy Systems Industry?
The market segments include Product Type, Application, End-user.
4. Can you provide details about the market size?
The market size is estimated to be USD XX Million as of 2022.
5. What are some drivers contributing to market growth?
Increase in the Geriatric Population; Rising Burden of Chronic Diseases; Increase in the Number of Initiatives for Cancer Radiotherapy.
6. What are the notable trends driving market growth?
Endoscopes Segment is Expected to Hold a Significant Market Share in the Image Guided Therapy System Market.
7. Are there any restraints impacting market growth?
High Price of Image-Guided Therapy Systems.
8. Can you provide examples of recent developments in the market?
May 2022: Philips internationally launched of EchoNavigator 4.0, the new release of its image-guided therapy solution for treating structural heart disease. EchoNavigator 4.0 gives users of Philips' EPIQ CVXi interventional cardiology ultrasound system greater control of live fusion-imaging on the company's Image Guided Therapy System - Azurion - platform.
9. What pricing options are available for accessing the report?
Pricing options include single-user, multi-user, and enterprise licenses priced at USD 4750, USD 5250, and USD 8750 respectively.
10. Is the market size provided in terms of value or volume?
The market size is provided in terms of value, measured in Million.
11. Are there any specific market keywords associated with the report?
Yes, the market keyword associated with the report is "Image-Guided Therapy Systems Industry," which aids in identifying and referencing the specific market segment covered.
12. How do I determine which pricing option suits my needs best?
The pricing options vary based on user requirements and access needs. Individual users may opt for single-user licenses, while businesses requiring broader access may choose multi-user or enterprise licenses for cost-effective access to the report.
13. Are there any additional resources or data provided in the Image-Guided Therapy Systems Industry report?
While the report offers comprehensive insights, it's advisable to review the specific contents or supplementary materials provided to ascertain if additional resources or data are available.
14. How can I stay updated on further developments or reports in the Image-Guided Therapy Systems Industry?
To stay informed about further developments, trends, and reports in the Image-Guided Therapy Systems Industry, consider subscribing to industry newsletters, following relevant companies and organizations, or regularly checking reputable industry news sources and publications.
Methodology
Step 1 - Identification of Relevant Samples Size from Population Database


Step 2 - Approaches for Defining Global Market Size (Value, Volume* & Price*)

Note*: In applicable scenarios
Step 3 - Data Sources
Primary Research
- Web Analytics
- Survey Reports
- Research Institute
- Latest Research Reports
- Opinion Leaders
Secondary Research
- Annual Reports
- White Paper
- Latest Press Release
- Industry Association
- Paid Database
- Investor Presentations

Step 4 - Data Triangulation
Involves using different sources of information in order to increase the validity of a study
These sources are likely to be stakeholders in a program - participants, other researchers, program staff, other community members, and so on.
Then we put all data in single framework & apply various statistical tools to find out the dynamic on the market.
During the analysis stage, feedback from the stakeholder groups would be compared to determine areas of agreement as well as areas of divergence


