
Key Insights
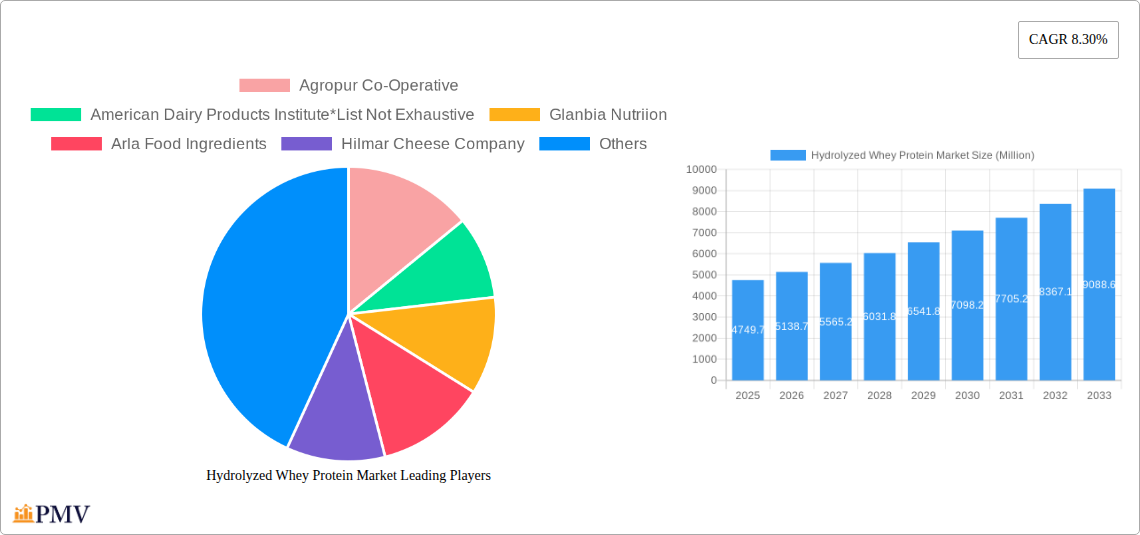
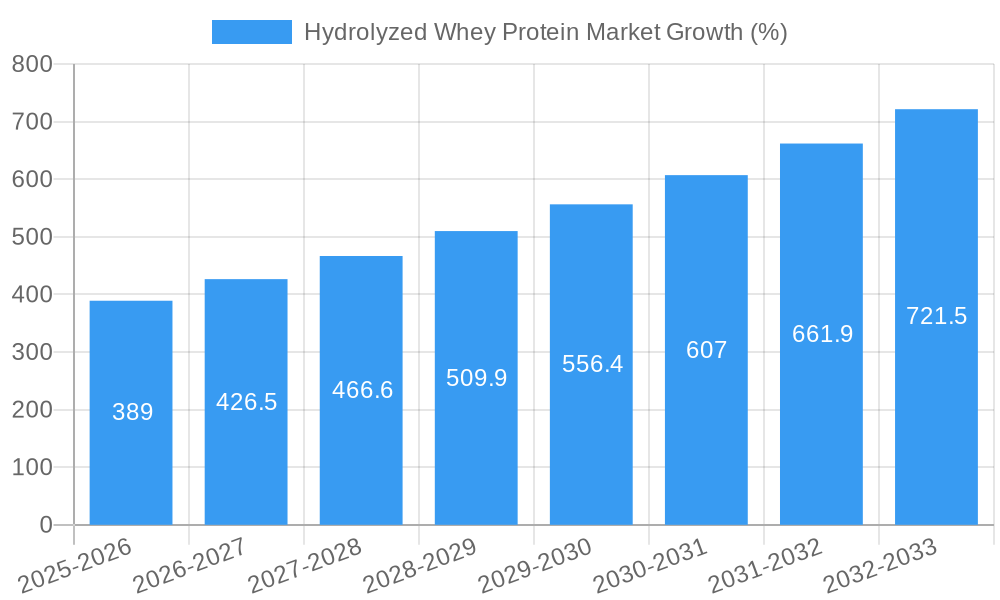
The hydrolyzed whey protein market, valued at $4749.7 million in 2025, is projected to experience robust growth, driven by increasing demand from the dietary supplements and food & beverage sectors. The market's Compound Annual Growth Rate (CAGR) of 8.30% from 2025 to 2033 indicates a significant expansion opportunity. This growth is fueled by the rising consumer awareness of the health benefits of whey protein, including its high protein content, rapid digestibility, and suitability for various dietary needs. The encapsulated form dominates the product segment due to its convenience and improved bioavailability, while dietary supplements constitute the largest application segment, reflecting the popularity of protein-rich supplements for fitness and general wellbeing. Major players like Glanbia Nutrition, Arla Foods Ingredients, and Fonterra are strategically investing in research and development to enhance product quality and expand their market presence. Geographic expansion, particularly in developing economies experiencing rising disposable incomes and health consciousness, further contributes to the market's growth trajectory. While regulatory hurdles and price fluctuations in raw materials could potentially pose challenges, the overall market outlook remains positive, driven by consistent innovation and expanding consumer demand.
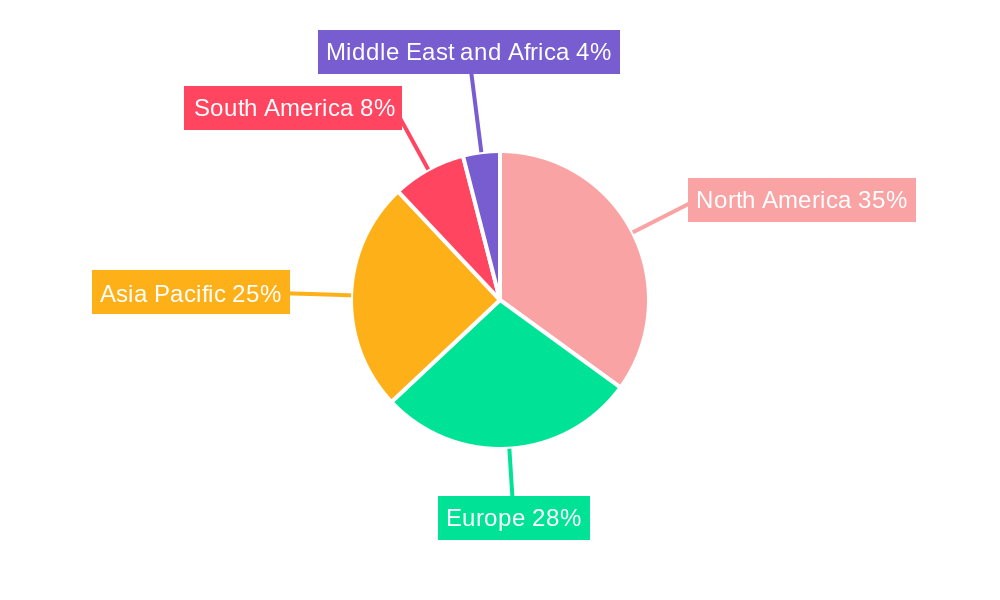
The competitive landscape is marked by a mix of large multinational corporations and specialized ingredient suppliers. These companies employ various strategies, including product diversification, strategic partnerships, and acquisitions, to strengthen their market position. North America currently holds a significant market share, attributed to high protein consumption and established distribution channels. However, Asia-Pacific is expected to witness the most significant growth during the forecast period, fueled by rising incomes, increasing health awareness, and a burgeoning fitness culture. This region's growing demand for convenient and high-quality protein sources will provide considerable growth opportunities for existing and new market entrants. Companies are also focused on sustainable and ethically sourced whey protein to cater to the growing preference for responsible consumption patterns.
Hydrolyzed Whey Protein Market: A Comprehensive Report (2019-2033)
This comprehensive report provides an in-depth analysis of the global Hydrolyzed Whey Protein market, offering valuable insights for stakeholders across the value chain. Covering the period from 2019 to 2033, with a base year of 2025 and a forecast period of 2025-2033, this report meticulously examines market dynamics, competitive landscapes, and future growth potential. The market is projected to reach xx Million by 2033, exhibiting a CAGR of xx% during the forecast period.
Hydrolyzed Whey Protein Market Market Structure & Competitive Dynamics
The hydrolyzed whey protein market is characterized by a moderately concentrated structure, with a few major players holding significant market share. Key players include Agropur Co-Operative, American Dairy Products Institute, Glanbia Nutrition, Arla Food Ingredients, Hilmar Cheese Company, Carbery Group, Kerry Group PLC, Fonterra Co-operative Group Limited, Milk Specialties Global, and AMCO Proteins. However, the presence of numerous smaller players fosters a dynamic competitive landscape. Market share is constantly shifting due to new product launches, strategic partnerships, and acquisitions. The report analyzes the market concentration ratio (CR) and Herfindahl-Hirschman Index (HHI) to quantify the level of competition. Innovation ecosystems are crucial, with companies investing heavily in R&D to develop new functionalities and improve existing products. Regulatory frameworks, particularly concerning food safety and labeling, significantly impact market operations. Product substitutes, such as soy protein isolate and casein hydrolysate, present competitive challenges. End-user trends, such as the rising demand for functional foods and dietary supplements, drive market growth. M&A activities, although not frequent, play a role in shaping the market structure. In the historical period (2019-2024), the total value of M&A deals in the industry was estimated at xx Million, with an average deal size of xx Million. The report further details the impact of these activities on market consolidation and competitive dynamics.
Hydrolyzed Whey Protein Market Industry Trends & Insights
The global hydrolyzed whey protein market is experiencing robust growth, driven by several key factors. The rising prevalence of health-conscious consumers seeking high-protein diets is a major driver. The increasing demand for convenient and functional food and beverage products is another significant factor, boosting the market for hydrolyzed whey protein. Technological advancements in protein processing and manufacturing have led to the development of hydrolyzed whey protein with enhanced functionalities, such as improved digestibility and bioavailability. This has further fueled market expansion. Consumer preferences are shifting towards natural and clean-label products, influencing the formulation and marketing strategies of manufacturers. Competitive dynamics are intense, with companies continuously innovating to capture market share. This involves launching new products, forming strategic partnerships, and engaging in marketing initiatives to build brand awareness and loyalty. The market has shown a considerable penetration rate in developed countries, but developing regions are emerging as new growth hotspots. The market is expected to maintain a healthy CAGR of xx% throughout the forecast period (2025-2033). Specific examples of technological disruptions influencing the market include the adoption of advanced filtration and enzymatic hydrolysis techniques.
Dominant Markets & Segments in Hydrolyzed Whey Protein Market
The North American region currently holds the largest market share in the global hydrolyzed whey protein market, driven by high consumption of protein supplements and strong demand for functional foods and beverages. Within North America, the United States accounts for the most significant share. Europe follows as a significant market, with strong growth expected in developing economies across Asia-Pacific.
By Product Form: The powdered form of hydrolyzed whey protein dominates the market due to its cost-effectiveness and ease of use in various applications. However, the capsulated segment is projected to experience faster growth owing to its increased convenience and portability.
By Application: The dietary supplements segment holds the largest market share, driven by the increasing popularity of protein supplementation among athletes and health-conscious individuals. The food & beverage sector also represents a substantial segment, with hydrolyzed whey protein increasingly incorporated into various products to enhance their nutritional profile. The pharmaceuticals segment is a niche market but demonstrates steady growth potential.
Key drivers for market dominance in these regions include:
- Robust economic growth and disposable incomes.
- Well-established distribution networks for food and beverage products.
- Favorable regulatory environments for the food and dietary supplement industries.
- Growing awareness of health and wellness among consumers.
Hydrolyzed Whey Protein Market Product Innovations
Recent years have witnessed significant product innovation in the hydrolyzed whey protein market. Manufacturers are focusing on developing products with enhanced functionalities, such as improved digestibility, faster absorption rates, and reduced bitterness. Technological advancements in protein hydrolysis techniques have facilitated the creation of products with tailored molecular weights and amino acid profiles to cater to specific needs. These innovations have led to a broader range of applications in food, beverage, and pharmaceutical industries. Key trends include the development of hypoallergenic formulas and the incorporation of bioactive peptides to offer added health benefits. This has led to improved market fit, resulting in increased consumer demand and market expansion.
Report Segmentation & Scope
This report segments the hydrolyzed whey protein market based on product form (powdered and capsulated) and application (dietary supplements, food & beverages, pharmaceuticals, and others). The powdered segment is projected to witness xx Million in revenue by 2033, while the capsulated segment is expected to reach xx Million. Within applications, dietary supplements represent the largest segment, anticipated to reach xx Million by 2033, followed by food & beverages at xx Million. The growth projections are based on several factors including consumer demand, technological advancements, and regulatory landscape changes. Competitive dynamics within each segment vary, with some segments experiencing greater competition than others.
Key Drivers of Hydrolyzed Whey Protein Market Growth
Several factors contribute to the growth of the hydrolyzed whey protein market. The rising prevalence of health consciousness and the growing demand for high-protein diets are major drivers. Technological advancements in protein hydrolysis and processing techniques are constantly improving product quality and functionality. Furthermore, favorable regulatory environments and increasing government initiatives promoting healthy eating habits have boosted market growth. The expanding functional food and beverage industry offers significant opportunities for hydrolyzed whey protein incorporation, further driving market expansion.
Challenges in the Hydrolyzed Whey Protein Market Sector
The hydrolyzed whey protein market faces several challenges. Fluctuations in raw material prices (whey) can significantly impact production costs and profitability. Stringent regulatory requirements concerning food safety and labeling can add to manufacturing complexities and costs. Intense competition among manufacturers necessitates continuous innovation and differentiation to maintain market share. Supply chain disruptions, particularly during periods of economic uncertainty or global events, can affect product availability and negatively impact revenue streams.
Leading Players in the Hydrolyzed Whey Protein Market Market
- Agropur Co-Operative
- American Dairy Products Institute
- Glanbia Nutrition
- Arla Food Ingredients
- Hilmar Cheese Company
- Carbery Group
- Kerry Group PLC
- Fonterra Co-operative Group Limited
- Milk Specialties Global
- AMCO Proteins
Key Developments in Hydrolyzed Whey Protein Market Sector
- 2022 Q3: Kerry Group PLC launched a new line of hydrolyzed whey protein isolates with enhanced solubility and reduced bitterness.
- 2021 Q4: Glanbia Nutrition and a research institution partnered to develop a novel hydrolyzed whey protein with improved bioavailability.
- 2020 Q1: Arla Food Ingredients acquired a smaller whey processing company, expanding its production capacity.
Strategic Hydrolyzed Whey Protein Market Market Outlook
The future of the hydrolyzed whey protein market appears promising. Continued growth is expected, driven by increasing health consciousness, technological innovations, and expanding applications in various sectors. Strategic opportunities lie in developing sustainable and environmentally friendly production methods, focusing on product diversification to cater to evolving consumer preferences, and expanding into new geographical markets. Investing in R&D to create products with enhanced functionalities and health benefits will play a crucial role in achieving sustainable growth and capturing a larger market share.
Hydrolyzed Whey Protein Market Segmentation
-
1. Product Form
- 1.1. Capsulated
- 1.2. Powdered
-
2. ApplIcation
- 2.1. Dietary Supplements
- 2.2. Food & Beverges
- 2.3. Pharmaceuticals
- 2.4. Others
Hydrolyzed Whey Protein Market Segmentation By Geography
-
1. North America
- 1.1. United States
- 1.2. Canada
- 1.3. Mexico
- 1.4. Rest of North America
-
2. Europe
- 2.1. Spain
- 2.2. United Kingdom
- 2.3. Germany
- 2.4. France
- 2.5. Italy
- 2.6. Russia
- 2.7. Rest of Europe
-
3. Asia Pacific
- 3.1. China
- 3.2. Japan
- 3.3. India
- 3.4. Australia
- 3.5. Rest of Asia Pacific
-
4. South America
- 4.1. Brazil
- 4.2. Argentina
- 4.3. Rest of South America
-
5. Middle East and Africa
- 5.1. South Africa
- 5.2. United Arab Emirates
- 5.3. Rest of Middle East and Africa
Hydrolyzed Whey Protein Market REPORT HIGHLIGHTS
| Aspects | Details |
|---|---|
| Study Period | 2019-2033 |
| Base Year | 2024 |
| Estimated Year | 2025 |
| Forecast Period | 2025-2033 |
| Historical Period | 2019-2024 |
| Growth Rate | CAGR of 8.30% from 2019-2033 |
| Segmentation |
|
Table of Contents
- 1. Introduction
- 1.1. Research Scope
- 1.2. Market Segmentation
- 1.3. Research Methodology
- 1.4. Definitions and Assumptions
- 2. Executive Summary
- 2.1. Introduction
- 3. Market Dynamics
- 3.1. Introduction
- 3.2. Market Drivers
- 3.2.1. Increasing awareness towards fitness among consumers; Demand for convenient fortified foods
- 3.3. Market Restrains
- 3.3.1. Increasing vegan culture in the market
- 3.4. Market Trends
- 3.4.1. The evolving world of sports nutrition
- 4. Market Factor Analysis
- 4.1. Porters Five Forces
- 4.2. Supply/Value Chain
- 4.3. PESTEL analysis
- 4.4. Market Entropy
- 4.5. Patent/Trademark Analysis
- 5. Global Hydrolyzed Whey Protein Market Analysis, Insights and Forecast, 2019-2031
- 5.1. Market Analysis, Insights and Forecast - by Product Form
- 5.1.1. Capsulated
- 5.1.2. Powdered
- 5.2. Market Analysis, Insights and Forecast - by ApplIcation
- 5.2.1. Dietary Supplements
- 5.2.2. Food & Beverges
- 5.2.3. Pharmaceuticals
- 5.2.4. Others
- 5.3. Market Analysis, Insights and Forecast - by Region
- 5.3.1. North America
- 5.3.2. Europe
- 5.3.3. Asia Pacific
- 5.3.4. South America
- 5.3.5. Middle East and Africa
- 5.1. Market Analysis, Insights and Forecast - by Product Form
- 6. North America Hydrolyzed Whey Protein Market Analysis, Insights and Forecast, 2019-2031
- 6.1. Market Analysis, Insights and Forecast - by Product Form
- 6.1.1. Capsulated
- 6.1.2. Powdered
- 6.2. Market Analysis, Insights and Forecast - by ApplIcation
- 6.2.1. Dietary Supplements
- 6.2.2. Food & Beverges
- 6.2.3. Pharmaceuticals
- 6.2.4. Others
- 6.1. Market Analysis, Insights and Forecast - by Product Form
- 7. Europe Hydrolyzed Whey Protein Market Analysis, Insights and Forecast, 2019-2031
- 7.1. Market Analysis, Insights and Forecast - by Product Form
- 7.1.1. Capsulated
- 7.1.2. Powdered
- 7.2. Market Analysis, Insights and Forecast - by ApplIcation
- 7.2.1. Dietary Supplements
- 7.2.2. Food & Beverges
- 7.2.3. Pharmaceuticals
- 7.2.4. Others
- 7.1. Market Analysis, Insights and Forecast - by Product Form
- 8. Asia Pacific Hydrolyzed Whey Protein Market Analysis, Insights and Forecast, 2019-2031
- 8.1. Market Analysis, Insights and Forecast - by Product Form
- 8.1.1. Capsulated
- 8.1.2. Powdered
- 8.2. Market Analysis, Insights and Forecast - by ApplIcation
- 8.2.1. Dietary Supplements
- 8.2.2. Food & Beverges
- 8.2.3. Pharmaceuticals
- 8.2.4. Others
- 8.1. Market Analysis, Insights and Forecast - by Product Form
- 9. South America Hydrolyzed Whey Protein Market Analysis, Insights and Forecast, 2019-2031
- 9.1. Market Analysis, Insights and Forecast - by Product Form
- 9.1.1. Capsulated
- 9.1.2. Powdered
- 9.2. Market Analysis, Insights and Forecast - by ApplIcation
- 9.2.1. Dietary Supplements
- 9.2.2. Food & Beverges
- 9.2.3. Pharmaceuticals
- 9.2.4. Others
- 9.1. Market Analysis, Insights and Forecast - by Product Form
- 10. Middle East and Africa Hydrolyzed Whey Protein Market Analysis, Insights and Forecast, 2019-2031
- 10.1. Market Analysis, Insights and Forecast - by Product Form
- 10.1.1. Capsulated
- 10.1.2. Powdered
- 10.2. Market Analysis, Insights and Forecast - by ApplIcation
- 10.2.1. Dietary Supplements
- 10.2.2. Food & Beverges
- 10.2.3. Pharmaceuticals
- 10.2.4. Others
- 10.1. Market Analysis, Insights and Forecast - by Product Form
- 11. North America Hydrolyzed Whey Protein Market Analysis, Insights and Forecast, 2019-2031
- 11.1. Market Analysis, Insights and Forecast - By Country/Sub-region
- 11.1.1 United States
- 11.1.2 Canada
- 11.1.3 Mexico
- 11.1.4 Rest of North America
- 12. Europe Hydrolyzed Whey Protein Market Analysis, Insights and Forecast, 2019-2031
- 12.1. Market Analysis, Insights and Forecast - By Country/Sub-region
- 12.1.1 Spain
- 12.1.2 United Kingdom
- 12.1.3 Germany
- 12.1.4 France
- 12.1.5 Italy
- 12.1.6 Russia
- 12.1.7 Rest of Europe
- 13. Asia Pacific Hydrolyzed Whey Protein Market Analysis, Insights and Forecast, 2019-2031
- 13.1. Market Analysis, Insights and Forecast - By Country/Sub-region
- 13.1.1 China
- 13.1.2 Japan
- 13.1.3 India
- 13.1.4 Australia
- 13.1.5 Rest of Asia Pacific
- 14. South America Hydrolyzed Whey Protein Market Analysis, Insights and Forecast, 2019-2031
- 14.1. Market Analysis, Insights and Forecast - By Country/Sub-region
- 14.1.1 Brazil
- 14.1.2 Argentina
- 14.1.3 Rest of South America
- 15. Middle East and Africa Hydrolyzed Whey Protein Market Analysis, Insights and Forecast, 2019-2031
- 15.1. Market Analysis, Insights and Forecast - By Country/Sub-region
- 15.1.1 South Africa
- 15.1.2 United Arab Emirates
- 15.1.3 Rest of Middle East and Africa
- 16. Competitive Analysis
- 16.1. Global Market Share Analysis 2024
- 16.2. Company Profiles
- 16.2.1 Agropur Co-Operative
- 16.2.1.1. Overview
- 16.2.1.2. Products
- 16.2.1.3. SWOT Analysis
- 16.2.1.4. Recent Developments
- 16.2.1.5. Financials (Based on Availability)
- 16.2.2 American Dairy Products Institute*List Not Exhaustive
- 16.2.2.1. Overview
- 16.2.2.2. Products
- 16.2.2.3. SWOT Analysis
- 16.2.2.4. Recent Developments
- 16.2.2.5. Financials (Based on Availability)
- 16.2.3 Glanbia Nutriion
- 16.2.3.1. Overview
- 16.2.3.2. Products
- 16.2.3.3. SWOT Analysis
- 16.2.3.4. Recent Developments
- 16.2.3.5. Financials (Based on Availability)
- 16.2.4 Arla Food Ingredients
- 16.2.4.1. Overview
- 16.2.4.2. Products
- 16.2.4.3. SWOT Analysis
- 16.2.4.4. Recent Developments
- 16.2.4.5. Financials (Based on Availability)
- 16.2.5 Hilmar Cheese Company
- 16.2.5.1. Overview
- 16.2.5.2. Products
- 16.2.5.3. SWOT Analysis
- 16.2.5.4. Recent Developments
- 16.2.5.5. Financials (Based on Availability)
- 16.2.6 Carbery Group
- 16.2.6.1. Overview
- 16.2.6.2. Products
- 16.2.6.3. SWOT Analysis
- 16.2.6.4. Recent Developments
- 16.2.6.5. Financials (Based on Availability)
- 16.2.7 Kerry Group PLC
- 16.2.7.1. Overview
- 16.2.7.2. Products
- 16.2.7.3. SWOT Analysis
- 16.2.7.4. Recent Developments
- 16.2.7.5. Financials (Based on Availability)
- 16.2.8 Fonterra Co-operative Group Limited
- 16.2.8.1. Overview
- 16.2.8.2. Products
- 16.2.8.3. SWOT Analysis
- 16.2.8.4. Recent Developments
- 16.2.8.5. Financials (Based on Availability)
- 16.2.9 Milk Specialties Global
- 16.2.9.1. Overview
- 16.2.9.2. Products
- 16.2.9.3. SWOT Analysis
- 16.2.9.4. Recent Developments
- 16.2.9.5. Financials (Based on Availability)
- 16.2.10 AMCO Proteins
- 16.2.10.1. Overview
- 16.2.10.2. Products
- 16.2.10.3. SWOT Analysis
- 16.2.10.4. Recent Developments
- 16.2.10.5. Financials (Based on Availability)
- 16.2.1 Agropur Co-Operative
List of Figures
- Figure 1: Global Hydrolyzed Whey Protein Market Revenue Breakdown (Million, %) by Region 2024 & 2032
- Figure 2: Global Hydrolyzed Whey Protein Market Volume Breakdown (K Tons, %) by Region 2024 & 2032
- Figure 3: North America Hydrolyzed Whey Protein Market Revenue (Million), by Country 2024 & 2032
- Figure 4: North America Hydrolyzed Whey Protein Market Volume (K Tons), by Country 2024 & 2032
- Figure 5: North America Hydrolyzed Whey Protein Market Revenue Share (%), by Country 2024 & 2032
- Figure 6: North America Hydrolyzed Whey Protein Market Volume Share (%), by Country 2024 & 2032
- Figure 7: Europe Hydrolyzed Whey Protein Market Revenue (Million), by Country 2024 & 2032
- Figure 8: Europe Hydrolyzed Whey Protein Market Volume (K Tons), by Country 2024 & 2032
- Figure 9: Europe Hydrolyzed Whey Protein Market Revenue Share (%), by Country 2024 & 2032
- Figure 10: Europe Hydrolyzed Whey Protein Market Volume Share (%), by Country 2024 & 2032
- Figure 11: Asia Pacific Hydrolyzed Whey Protein Market Revenue (Million), by Country 2024 & 2032
- Figure 12: Asia Pacific Hydrolyzed Whey Protein Market Volume (K Tons), by Country 2024 & 2032
- Figure 13: Asia Pacific Hydrolyzed Whey Protein Market Revenue Share (%), by Country 2024 & 2032
- Figure 14: Asia Pacific Hydrolyzed Whey Protein Market Volume Share (%), by Country 2024 & 2032
- Figure 15: South America Hydrolyzed Whey Protein Market Revenue (Million), by Country 2024 & 2032
- Figure 16: South America Hydrolyzed Whey Protein Market Volume (K Tons), by Country 2024 & 2032
- Figure 17: South America Hydrolyzed Whey Protein Market Revenue Share (%), by Country 2024 & 2032
- Figure 18: South America Hydrolyzed Whey Protein Market Volume Share (%), by Country 2024 & 2032
- Figure 19: Middle East and Africa Hydrolyzed Whey Protein Market Revenue (Million), by Country 2024 & 2032
- Figure 20: Middle East and Africa Hydrolyzed Whey Protein Market Volume (K Tons), by Country 2024 & 2032
- Figure 21: Middle East and Africa Hydrolyzed Whey Protein Market Revenue Share (%), by Country 2024 & 2032
- Figure 22: Middle East and Africa Hydrolyzed Whey Protein Market Volume Share (%), by Country 2024 & 2032
- Figure 23: North America Hydrolyzed Whey Protein Market Revenue (Million), by Product Form 2024 & 2032
- Figure 24: North America Hydrolyzed Whey Protein Market Volume (K Tons), by Product Form 2024 & 2032
- Figure 25: North America Hydrolyzed Whey Protein Market Revenue Share (%), by Product Form 2024 & 2032
- Figure 26: North America Hydrolyzed Whey Protein Market Volume Share (%), by Product Form 2024 & 2032
- Figure 27: North America Hydrolyzed Whey Protein Market Revenue (Million), by ApplIcation 2024 & 2032
- Figure 28: North America Hydrolyzed Whey Protein Market Volume (K Tons), by ApplIcation 2024 & 2032
- Figure 29: North America Hydrolyzed Whey Protein Market Revenue Share (%), by ApplIcation 2024 & 2032
- Figure 30: North America Hydrolyzed Whey Protein Market Volume Share (%), by ApplIcation 2024 & 2032
- Figure 31: North America Hydrolyzed Whey Protein Market Revenue (Million), by Country 2024 & 2032
- Figure 32: North America Hydrolyzed Whey Protein Market Volume (K Tons), by Country 2024 & 2032
- Figure 33: North America Hydrolyzed Whey Protein Market Revenue Share (%), by Country 2024 & 2032
- Figure 34: North America Hydrolyzed Whey Protein Market Volume Share (%), by Country 2024 & 2032
- Figure 35: Europe Hydrolyzed Whey Protein Market Revenue (Million), by Product Form 2024 & 2032
- Figure 36: Europe Hydrolyzed Whey Protein Market Volume (K Tons), by Product Form 2024 & 2032
- Figure 37: Europe Hydrolyzed Whey Protein Market Revenue Share (%), by Product Form 2024 & 2032
- Figure 38: Europe Hydrolyzed Whey Protein Market Volume Share (%), by Product Form 2024 & 2032
- Figure 39: Europe Hydrolyzed Whey Protein Market Revenue (Million), by ApplIcation 2024 & 2032
- Figure 40: Europe Hydrolyzed Whey Protein Market Volume (K Tons), by ApplIcation 2024 & 2032
- Figure 41: Europe Hydrolyzed Whey Protein Market Revenue Share (%), by ApplIcation 2024 & 2032
- Figure 42: Europe Hydrolyzed Whey Protein Market Volume Share (%), by ApplIcation 2024 & 2032
- Figure 43: Europe Hydrolyzed Whey Protein Market Revenue (Million), by Country 2024 & 2032
- Figure 44: Europe Hydrolyzed Whey Protein Market Volume (K Tons), by Country 2024 & 2032
- Figure 45: Europe Hydrolyzed Whey Protein Market Revenue Share (%), by Country 2024 & 2032
- Figure 46: Europe Hydrolyzed Whey Protein Market Volume Share (%), by Country 2024 & 2032
- Figure 47: Asia Pacific Hydrolyzed Whey Protein Market Revenue (Million), by Product Form 2024 & 2032
- Figure 48: Asia Pacific Hydrolyzed Whey Protein Market Volume (K Tons), by Product Form 2024 & 2032
- Figure 49: Asia Pacific Hydrolyzed Whey Protein Market Revenue Share (%), by Product Form 2024 & 2032
- Figure 50: Asia Pacific Hydrolyzed Whey Protein Market Volume Share (%), by Product Form 2024 & 2032
- Figure 51: Asia Pacific Hydrolyzed Whey Protein Market Revenue (Million), by ApplIcation 2024 & 2032
- Figure 52: Asia Pacific Hydrolyzed Whey Protein Market Volume (K Tons), by ApplIcation 2024 & 2032
- Figure 53: Asia Pacific Hydrolyzed Whey Protein Market Revenue Share (%), by ApplIcation 2024 & 2032
- Figure 54: Asia Pacific Hydrolyzed Whey Protein Market Volume Share (%), by ApplIcation 2024 & 2032
- Figure 55: Asia Pacific Hydrolyzed Whey Protein Market Revenue (Million), by Country 2024 & 2032
- Figure 56: Asia Pacific Hydrolyzed Whey Protein Market Volume (K Tons), by Country 2024 & 2032
- Figure 57: Asia Pacific Hydrolyzed Whey Protein Market Revenue Share (%), by Country 2024 & 2032
- Figure 58: Asia Pacific Hydrolyzed Whey Protein Market Volume Share (%), by Country 2024 & 2032
- Figure 59: South America Hydrolyzed Whey Protein Market Revenue (Million), by Product Form 2024 & 2032
- Figure 60: South America Hydrolyzed Whey Protein Market Volume (K Tons), by Product Form 2024 & 2032
- Figure 61: South America Hydrolyzed Whey Protein Market Revenue Share (%), by Product Form 2024 & 2032
- Figure 62: South America Hydrolyzed Whey Protein Market Volume Share (%), by Product Form 2024 & 2032
- Figure 63: South America Hydrolyzed Whey Protein Market Revenue (Million), by ApplIcation 2024 & 2032
- Figure 64: South America Hydrolyzed Whey Protein Market Volume (K Tons), by ApplIcation 2024 & 2032
- Figure 65: South America Hydrolyzed Whey Protein Market Revenue Share (%), by ApplIcation 2024 & 2032
- Figure 66: South America Hydrolyzed Whey Protein Market Volume Share (%), by ApplIcation 2024 & 2032
- Figure 67: South America Hydrolyzed Whey Protein Market Revenue (Million), by Country 2024 & 2032
- Figure 68: South America Hydrolyzed Whey Protein Market Volume (K Tons), by Country 2024 & 2032
- Figure 69: South America Hydrolyzed Whey Protein Market Revenue Share (%), by Country 2024 & 2032
- Figure 70: South America Hydrolyzed Whey Protein Market Volume Share (%), by Country 2024 & 2032
- Figure 71: Middle East and Africa Hydrolyzed Whey Protein Market Revenue (Million), by Product Form 2024 & 2032
- Figure 72: Middle East and Africa Hydrolyzed Whey Protein Market Volume (K Tons), by Product Form 2024 & 2032
- Figure 73: Middle East and Africa Hydrolyzed Whey Protein Market Revenue Share (%), by Product Form 2024 & 2032
- Figure 74: Middle East and Africa Hydrolyzed Whey Protein Market Volume Share (%), by Product Form 2024 & 2032
- Figure 75: Middle East and Africa Hydrolyzed Whey Protein Market Revenue (Million), by ApplIcation 2024 & 2032
- Figure 76: Middle East and Africa Hydrolyzed Whey Protein Market Volume (K Tons), by ApplIcation 2024 & 2032
- Figure 77: Middle East and Africa Hydrolyzed Whey Protein Market Revenue Share (%), by ApplIcation 2024 & 2032
- Figure 78: Middle East and Africa Hydrolyzed Whey Protein Market Volume Share (%), by ApplIcation 2024 & 2032
- Figure 79: Middle East and Africa Hydrolyzed Whey Protein Market Revenue (Million), by Country 2024 & 2032
- Figure 80: Middle East and Africa Hydrolyzed Whey Protein Market Volume (K Tons), by Country 2024 & 2032
- Figure 81: Middle East and Africa Hydrolyzed Whey Protein Market Revenue Share (%), by Country 2024 & 2032
- Figure 82: Middle East and Africa Hydrolyzed Whey Protein Market Volume Share (%), by Country 2024 & 2032
List of Tables
- Table 1: Global Hydrolyzed Whey Protein Market Revenue Million Forecast, by Region 2019 & 2032
- Table 2: Global Hydrolyzed Whey Protein Market Volume K Tons Forecast, by Region 2019 & 2032
- Table 3: Global Hydrolyzed Whey Protein Market Revenue Million Forecast, by Product Form 2019 & 2032
- Table 4: Global Hydrolyzed Whey Protein Market Volume K Tons Forecast, by Product Form 2019 & 2032
- Table 5: Global Hydrolyzed Whey Protein Market Revenue Million Forecast, by ApplIcation 2019 & 2032
- Table 6: Global Hydrolyzed Whey Protein Market Volume K Tons Forecast, by ApplIcation 2019 & 2032
- Table 7: Global Hydrolyzed Whey Protein Market Revenue Million Forecast, by Region 2019 & 2032
- Table 8: Global Hydrolyzed Whey Protein Market Volume K Tons Forecast, by Region 2019 & 2032
- Table 9: Global Hydrolyzed Whey Protein Market Revenue Million Forecast, by Country 2019 & 2032
- Table 10: Global Hydrolyzed Whey Protein Market Volume K Tons Forecast, by Country 2019 & 2032
- Table 11: United States Hydrolyzed Whey Protein Market Revenue (Million) Forecast, by Application 2019 & 2032
- Table 12: United States Hydrolyzed Whey Protein Market Volume (K Tons) Forecast, by Application 2019 & 2032
- Table 13: Canada Hydrolyzed Whey Protein Market Revenue (Million) Forecast, by Application 2019 & 2032
- Table 14: Canada Hydrolyzed Whey Protein Market Volume (K Tons) Forecast, by Application 2019 & 2032
- Table 15: Mexico Hydrolyzed Whey Protein Market Revenue (Million) Forecast, by Application 2019 & 2032
- Table 16: Mexico Hydrolyzed Whey Protein Market Volume (K Tons) Forecast, by Application 2019 & 2032
- Table 17: Rest of North America Hydrolyzed Whey Protein Market Revenue (Million) Forecast, by Application 2019 & 2032
- Table 18: Rest of North America Hydrolyzed Whey Protein Market Volume (K Tons) Forecast, by Application 2019 & 2032
- Table 19: Global Hydrolyzed Whey Protein Market Revenue Million Forecast, by Country 2019 & 2032
- Table 20: Global Hydrolyzed Whey Protein Market Volume K Tons Forecast, by Country 2019 & 2032
- Table 21: Spain Hydrolyzed Whey Protein Market Revenue (Million) Forecast, by Application 2019 & 2032
- Table 22: Spain Hydrolyzed Whey Protein Market Volume (K Tons) Forecast, by Application 2019 & 2032
- Table 23: United Kingdom Hydrolyzed Whey Protein Market Revenue (Million) Forecast, by Application 2019 & 2032
- Table 24: United Kingdom Hydrolyzed Whey Protein Market Volume (K Tons) Forecast, by Application 2019 & 2032
- Table 25: Germany Hydrolyzed Whey Protein Market Revenue (Million) Forecast, by Application 2019 & 2032
- Table 26: Germany Hydrolyzed Whey Protein Market Volume (K Tons) Forecast, by Application 2019 & 2032
- Table 27: France Hydrolyzed Whey Protein Market Revenue (Million) Forecast, by Application 2019 & 2032
- Table 28: France Hydrolyzed Whey Protein Market Volume (K Tons) Forecast, by Application 2019 & 2032
- Table 29: Italy Hydrolyzed Whey Protein Market Revenue (Million) Forecast, by Application 2019 & 2032
- Table 30: Italy Hydrolyzed Whey Protein Market Volume (K Tons) Forecast, by Application 2019 & 2032
- Table 31: Russia Hydrolyzed Whey Protein Market Revenue (Million) Forecast, by Application 2019 & 2032
- Table 32: Russia Hydrolyzed Whey Protein Market Volume (K Tons) Forecast, by Application 2019 & 2032
- Table 33: Rest of Europe Hydrolyzed Whey Protein Market Revenue (Million) Forecast, by Application 2019 & 2032
- Table 34: Rest of Europe Hydrolyzed Whey Protein Market Volume (K Tons) Forecast, by Application 2019 & 2032
- Table 35: Global Hydrolyzed Whey Protein Market Revenue Million Forecast, by Country 2019 & 2032
- Table 36: Global Hydrolyzed Whey Protein Market Volume K Tons Forecast, by Country 2019 & 2032
- Table 37: China Hydrolyzed Whey Protein Market Revenue (Million) Forecast, by Application 2019 & 2032
- Table 38: China Hydrolyzed Whey Protein Market Volume (K Tons) Forecast, by Application 2019 & 2032
- Table 39: Japan Hydrolyzed Whey Protein Market Revenue (Million) Forecast, by Application 2019 & 2032
- Table 40: Japan Hydrolyzed Whey Protein Market Volume (K Tons) Forecast, by Application 2019 & 2032
- Table 41: India Hydrolyzed Whey Protein Market Revenue (Million) Forecast, by Application 2019 & 2032
- Table 42: India Hydrolyzed Whey Protein Market Volume (K Tons) Forecast, by Application 2019 & 2032
- Table 43: Australia Hydrolyzed Whey Protein Market Revenue (Million) Forecast, by Application 2019 & 2032
- Table 44: Australia Hydrolyzed Whey Protein Market Volume (K Tons) Forecast, by Application 2019 & 2032
- Table 45: Rest of Asia Pacific Hydrolyzed Whey Protein Market Revenue (Million) Forecast, by Application 2019 & 2032
- Table 46: Rest of Asia Pacific Hydrolyzed Whey Protein Market Volume (K Tons) Forecast, by Application 2019 & 2032
- Table 47: Global Hydrolyzed Whey Protein Market Revenue Million Forecast, by Country 2019 & 2032
- Table 48: Global Hydrolyzed Whey Protein Market Volume K Tons Forecast, by Country 2019 & 2032
- Table 49: Brazil Hydrolyzed Whey Protein Market Revenue (Million) Forecast, by Application 2019 & 2032
- Table 50: Brazil Hydrolyzed Whey Protein Market Volume (K Tons) Forecast, by Application 2019 & 2032
- Table 51: Argentina Hydrolyzed Whey Protein Market Revenue (Million) Forecast, by Application 2019 & 2032
- Table 52: Argentina Hydrolyzed Whey Protein Market Volume (K Tons) Forecast, by Application 2019 & 2032
- Table 53: Rest of South America Hydrolyzed Whey Protein Market Revenue (Million) Forecast, by Application 2019 & 2032
- Table 54: Rest of South America Hydrolyzed Whey Protein Market Volume (K Tons) Forecast, by Application 2019 & 2032
- Table 55: Global Hydrolyzed Whey Protein Market Revenue Million Forecast, by Country 2019 & 2032
- Table 56: Global Hydrolyzed Whey Protein Market Volume K Tons Forecast, by Country 2019 & 2032
- Table 57: South Africa Hydrolyzed Whey Protein Market Revenue (Million) Forecast, by Application 2019 & 2032
- Table 58: South Africa Hydrolyzed Whey Protein Market Volume (K Tons) Forecast, by Application 2019 & 2032
- Table 59: United Arab Emirates Hydrolyzed Whey Protein Market Revenue (Million) Forecast, by Application 2019 & 2032
- Table 60: United Arab Emirates Hydrolyzed Whey Protein Market Volume (K Tons) Forecast, by Application 2019 & 2032
- Table 61: Rest of Middle East and Africa Hydrolyzed Whey Protein Market Revenue (Million) Forecast, by Application 2019 & 2032
- Table 62: Rest of Middle East and Africa Hydrolyzed Whey Protein Market Volume (K Tons) Forecast, by Application 2019 & 2032
- Table 63: Global Hydrolyzed Whey Protein Market Revenue Million Forecast, by Product Form 2019 & 2032
- Table 64: Global Hydrolyzed Whey Protein Market Volume K Tons Forecast, by Product Form 2019 & 2032
- Table 65: Global Hydrolyzed Whey Protein Market Revenue Million Forecast, by ApplIcation 2019 & 2032
- Table 66: Global Hydrolyzed Whey Protein Market Volume K Tons Forecast, by ApplIcation 2019 & 2032
- Table 67: Global Hydrolyzed Whey Protein Market Revenue Million Forecast, by Country 2019 & 2032
- Table 68: Global Hydrolyzed Whey Protein Market Volume K Tons Forecast, by Country 2019 & 2032
- Table 69: United States Hydrolyzed Whey Protein Market Revenue (Million) Forecast, by Application 2019 & 2032
- Table 70: United States Hydrolyzed Whey Protein Market Volume (K Tons) Forecast, by Application 2019 & 2032
- Table 71: Canada Hydrolyzed Whey Protein Market Revenue (Million) Forecast, by Application 2019 & 2032
- Table 72: Canada Hydrolyzed Whey Protein Market Volume (K Tons) Forecast, by Application 2019 & 2032
- Table 73: Mexico Hydrolyzed Whey Protein Market Revenue (Million) Forecast, by Application 2019 & 2032
- Table 74: Mexico Hydrolyzed Whey Protein Market Volume (K Tons) Forecast, by Application 2019 & 2032
- Table 75: Rest of North America Hydrolyzed Whey Protein Market Revenue (Million) Forecast, by Application 2019 & 2032
- Table 76: Rest of North America Hydrolyzed Whey Protein Market Volume (K Tons) Forecast, by Application 2019 & 2032
- Table 77: Global Hydrolyzed Whey Protein Market Revenue Million Forecast, by Product Form 2019 & 2032
- Table 78: Global Hydrolyzed Whey Protein Market Volume K Tons Forecast, by Product Form 2019 & 2032
- Table 79: Global Hydrolyzed Whey Protein Market Revenue Million Forecast, by ApplIcation 2019 & 2032
- Table 80: Global Hydrolyzed Whey Protein Market Volume K Tons Forecast, by ApplIcation 2019 & 2032
- Table 81: Global Hydrolyzed Whey Protein Market Revenue Million Forecast, by Country 2019 & 2032
- Table 82: Global Hydrolyzed Whey Protein Market Volume K Tons Forecast, by Country 2019 & 2032
- Table 83: Spain Hydrolyzed Whey Protein Market Revenue (Million) Forecast, by Application 2019 & 2032
- Table 84: Spain Hydrolyzed Whey Protein Market Volume (K Tons) Forecast, by Application 2019 & 2032
- Table 85: United Kingdom Hydrolyzed Whey Protein Market Revenue (Million) Forecast, by Application 2019 & 2032
- Table 86: United Kingdom Hydrolyzed Whey Protein Market Volume (K Tons) Forecast, by Application 2019 & 2032
- Table 87: Germany Hydrolyzed Whey Protein Market Revenue (Million) Forecast, by Application 2019 & 2032
- Table 88: Germany Hydrolyzed Whey Protein Market Volume (K Tons) Forecast, by Application 2019 & 2032
- Table 89: France Hydrolyzed Whey Protein Market Revenue (Million) Forecast, by Application 2019 & 2032
- Table 90: France Hydrolyzed Whey Protein Market Volume (K Tons) Forecast, by Application 2019 & 2032
- Table 91: Italy Hydrolyzed Whey Protein Market Revenue (Million) Forecast, by Application 2019 & 2032
- Table 92: Italy Hydrolyzed Whey Protein Market Volume (K Tons) Forecast, by Application 2019 & 2032
- Table 93: Russia Hydrolyzed Whey Protein Market Revenue (Million) Forecast, by Application 2019 & 2032
- Table 94: Russia Hydrolyzed Whey Protein Market Volume (K Tons) Forecast, by Application 2019 & 2032
- Table 95: Rest of Europe Hydrolyzed Whey Protein Market Revenue (Million) Forecast, by Application 2019 & 2032
- Table 96: Rest of Europe Hydrolyzed Whey Protein Market Volume (K Tons) Forecast, by Application 2019 & 2032
- Table 97: Global Hydrolyzed Whey Protein Market Revenue Million Forecast, by Product Form 2019 & 2032
- Table 98: Global Hydrolyzed Whey Protein Market Volume K Tons Forecast, by Product Form 2019 & 2032
- Table 99: Global Hydrolyzed Whey Protein Market Revenue Million Forecast, by ApplIcation 2019 & 2032
- Table 100: Global Hydrolyzed Whey Protein Market Volume K Tons Forecast, by ApplIcation 2019 & 2032
- Table 101: Global Hydrolyzed Whey Protein Market Revenue Million Forecast, by Country 2019 & 2032
- Table 102: Global Hydrolyzed Whey Protein Market Volume K Tons Forecast, by Country 2019 & 2032
- Table 103: China Hydrolyzed Whey Protein Market Revenue (Million) Forecast, by Application 2019 & 2032
- Table 104: China Hydrolyzed Whey Protein Market Volume (K Tons) Forecast, by Application 2019 & 2032
- Table 105: Japan Hydrolyzed Whey Protein Market Revenue (Million) Forecast, by Application 2019 & 2032
- Table 106: Japan Hydrolyzed Whey Protein Market Volume (K Tons) Forecast, by Application 2019 & 2032
- Table 107: India Hydrolyzed Whey Protein Market Revenue (Million) Forecast, by Application 2019 & 2032
- Table 108: India Hydrolyzed Whey Protein Market Volume (K Tons) Forecast, by Application 2019 & 2032
- Table 109: Australia Hydrolyzed Whey Protein Market Revenue (Million) Forecast, by Application 2019 & 2032
- Table 110: Australia Hydrolyzed Whey Protein Market Volume (K Tons) Forecast, by Application 2019 & 2032
- Table 111: Rest of Asia Pacific Hydrolyzed Whey Protein Market Revenue (Million) Forecast, by Application 2019 & 2032
- Table 112: Rest of Asia Pacific Hydrolyzed Whey Protein Market Volume (K Tons) Forecast, by Application 2019 & 2032
- Table 113: Global Hydrolyzed Whey Protein Market Revenue Million Forecast, by Product Form 2019 & 2032
- Table 114: Global Hydrolyzed Whey Protein Market Volume K Tons Forecast, by Product Form 2019 & 2032
- Table 115: Global Hydrolyzed Whey Protein Market Revenue Million Forecast, by ApplIcation 2019 & 2032
- Table 116: Global Hydrolyzed Whey Protein Market Volume K Tons Forecast, by ApplIcation 2019 & 2032
- Table 117: Global Hydrolyzed Whey Protein Market Revenue Million Forecast, by Country 2019 & 2032
- Table 118: Global Hydrolyzed Whey Protein Market Volume K Tons Forecast, by Country 2019 & 2032
- Table 119: Brazil Hydrolyzed Whey Protein Market Revenue (Million) Forecast, by Application 2019 & 2032
- Table 120: Brazil Hydrolyzed Whey Protein Market Volume (K Tons) Forecast, by Application 2019 & 2032
- Table 121: Argentina Hydrolyzed Whey Protein Market Revenue (Million) Forecast, by Application 2019 & 2032
- Table 122: Argentina Hydrolyzed Whey Protein Market Volume (K Tons) Forecast, by Application 2019 & 2032
- Table 123: Rest of South America Hydrolyzed Whey Protein Market Revenue (Million) Forecast, by Application 2019 & 2032
- Table 124: Rest of South America Hydrolyzed Whey Protein Market Volume (K Tons) Forecast, by Application 2019 & 2032
- Table 125: Global Hydrolyzed Whey Protein Market Revenue Million Forecast, by Product Form 2019 & 2032
- Table 126: Global Hydrolyzed Whey Protein Market Volume K Tons Forecast, by Product Form 2019 & 2032
- Table 127: Global Hydrolyzed Whey Protein Market Revenue Million Forecast, by ApplIcation 2019 & 2032
- Table 128: Global Hydrolyzed Whey Protein Market Volume K Tons Forecast, by ApplIcation 2019 & 2032
- Table 129: Global Hydrolyzed Whey Protein Market Revenue Million Forecast, by Country 2019 & 2032
- Table 130: Global Hydrolyzed Whey Protein Market Volume K Tons Forecast, by Country 2019 & 2032
- Table 131: South Africa Hydrolyzed Whey Protein Market Revenue (Million) Forecast, by Application 2019 & 2032
- Table 132: South Africa Hydrolyzed Whey Protein Market Volume (K Tons) Forecast, by Application 2019 & 2032
- Table 133: United Arab Emirates Hydrolyzed Whey Protein Market Revenue (Million) Forecast, by Application 2019 & 2032
- Table 134: United Arab Emirates Hydrolyzed Whey Protein Market Volume (K Tons) Forecast, by Application 2019 & 2032
- Table 135: Rest of Middle East and Africa Hydrolyzed Whey Protein Market Revenue (Million) Forecast, by Application 2019 & 2032
- Table 136: Rest of Middle East and Africa Hydrolyzed Whey Protein Market Volume (K Tons) Forecast, by Application 2019 & 2032
Frequently Asked Questions
1. What is the projected Compound Annual Growth Rate (CAGR) of the Hydrolyzed Whey Protein Market?
The projected CAGR is approximately 8.30%.
2. Which companies are prominent players in the Hydrolyzed Whey Protein Market?
Key companies in the market include Agropur Co-Operative, American Dairy Products Institute*List Not Exhaustive, Glanbia Nutriion, Arla Food Ingredients, Hilmar Cheese Company, Carbery Group, Kerry Group PLC , Fonterra Co-operative Group Limited , Milk Specialties Global , AMCO Proteins.
3. What are the main segments of the Hydrolyzed Whey Protein Market?
The market segments include Product Form, ApplIcation.
4. Can you provide details about the market size?
The market size is estimated to be USD 4749.7 Million as of 2022.
5. What are some drivers contributing to market growth?
Increasing awareness towards fitness among consumers; Demand for convenient fortified foods.
6. What are the notable trends driving market growth?
The evolving world of sports nutrition.
7. Are there any restraints impacting market growth?
Increasing vegan culture in the market.
8. Can you provide examples of recent developments in the market?
New product launches with enhanced functionality
9. What pricing options are available for accessing the report?
Pricing options include single-user, multi-user, and enterprise licenses priced at USD 4750, USD 5250, and USD 8750 respectively.
10. Is the market size provided in terms of value or volume?
The market size is provided in terms of value, measured in Million and volume, measured in K Tons.
11. Are there any specific market keywords associated with the report?
Yes, the market keyword associated with the report is "Hydrolyzed Whey Protein Market," which aids in identifying and referencing the specific market segment covered.
12. How do I determine which pricing option suits my needs best?
The pricing options vary based on user requirements and access needs. Individual users may opt for single-user licenses, while businesses requiring broader access may choose multi-user or enterprise licenses for cost-effective access to the report.
13. Are there any additional resources or data provided in the Hydrolyzed Whey Protein Market report?
While the report offers comprehensive insights, it's advisable to review the specific contents or supplementary materials provided to ascertain if additional resources or data are available.
14. How can I stay updated on further developments or reports in the Hydrolyzed Whey Protein Market?
To stay informed about further developments, trends, and reports in the Hydrolyzed Whey Protein Market, consider subscribing to industry newsletters, following relevant companies and organizations, or regularly checking reputable industry news sources and publications.
Methodology
Step 1 - Identification of Relevant Samples Size from Population Database


Step 2 - Approaches for Defining Global Market Size (Value, Volume* & Price*)

Note*: In applicable scenarios
Step 3 - Data Sources
Primary Research
- Web Analytics
- Survey Reports
- Research Institute
- Latest Research Reports
- Opinion Leaders
Secondary Research
- Annual Reports
- White Paper
- Latest Press Release
- Industry Association
- Paid Database
- Investor Presentations

Step 4 - Data Triangulation
Involves using different sources of information in order to increase the validity of a study
These sources are likely to be stakeholders in a program - participants, other researchers, program staff, other community members, and so on.
Then we put all data in single framework & apply various statistical tools to find out the dynamic on the market.
During the analysis stage, feedback from the stakeholder groups would be compared to determine areas of agreement as well as areas of divergence


