
Key Insights
The global home office furniture market, valued at $22.42 billion in 2025, is projected to experience robust growth, driven by several key factors. The increasing prevalence of remote work and hybrid work models, fueled by technological advancements and evolving work preferences, is a significant catalyst. Consumers are investing more in creating ergonomic and functional home workspaces, leading to increased demand for high-quality desks, chairs, storage solutions, and other home office furniture. Furthermore, the rising adoption of e-commerce and online retail channels has broadened market access and fueled sales growth. The market is segmented by product type (seating, storage units, desks & tables, other furniture) and distribution channel (flagship stores, specialty stores, online, other channels). While the online channel shows significant growth potential, traditional retail channels maintain a substantial market share, indicating a multi-channel approach for manufacturers and retailers. Competitive landscape analysis reveals a mix of established players like Knoll, Steelcase, and Herman Miller, alongside larger furniture retailers like IKEA and Ashley Furniture Industries, creating a dynamic market with diverse product offerings and pricing strategies. Geographic analysis shows that North America and Europe currently dominate the market, although Asia-Pacific is poised for significant growth given its rapidly expanding middle class and increasing urbanization.
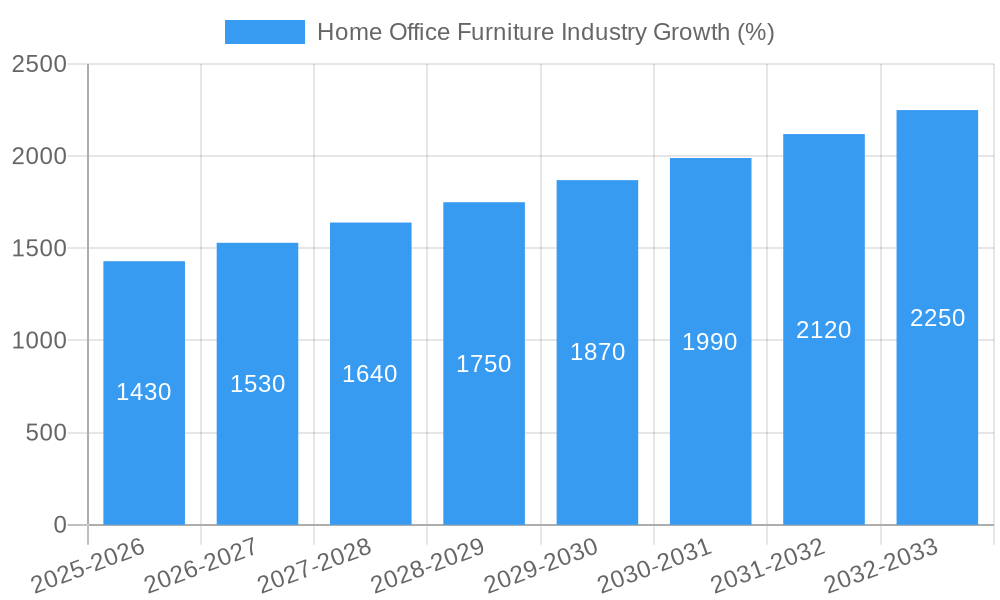
The continued expansion of the home office furniture market is anticipated to be influenced by several trends. The growing focus on sustainability and eco-friendly materials is driving demand for products made from recycled or sustainably sourced materials. Customization and personalization options are becoming increasingly important to consumers seeking furniture that reflects their individual styles and needs. Smart furniture incorporating technology for improved functionality and ergonomics is gaining traction. However, potential restraints include economic fluctuations that might affect consumer spending, supply chain disruptions, and the potential for saturation in certain market segments as the market matures. Based on the provided CAGR of 6.17%, we can project continued growth throughout the forecast period (2025-2033), with specific regional variations based on economic growth and adoption rates of remote work. Understanding these drivers, trends, and restraints is critical for businesses to navigate the dynamic landscape and capitalize on market opportunities.

Home Office Furniture Industry Market Report: 2019-2033
This comprehensive report provides an in-depth analysis of the global Home Office Furniture industry, offering invaluable insights for businesses, investors, and stakeholders. Covering the period from 2019 to 2033, with a base year of 2025 and a forecast period of 2025-2033, this report meticulously examines market trends, competitive dynamics, and future growth potential. The market is valued at xx Million in 2025 and is projected to reach xx Million by 2033, exhibiting a CAGR of xx%.
Home Office Furniture Industry Market Structure & Competitive Dynamics
This section analyzes the competitive landscape of the home office furniture market, considering factors influencing market concentration, innovation, regulation, and mergers & acquisitions (M&A). The market is characterized by a moderately concentrated structure, with key players like Steelcase Inc, Herman Miller Inc, and IKEA holding significant market share. However, a large number of smaller players contribute significantly to the overall market volume.
The market's innovation ecosystem is driven by technological advancements in materials, ergonomics, and design, leading to the development of smart furniture and sustainable options. Regulatory frameworks concerning product safety and environmental standards influence manufacturing practices. Substitutes, such as repurposed household items or co-working spaces, pose a challenge to the industry's growth. Shifting consumer preferences towards minimalist designs and flexible workspaces also shape the market. M&A activities in the past five years have totaled approximately xx Million, primarily driven by companies seeking to expand their product portfolio and geographic reach.
- Market Share (2025): Steelcase Inc (xx%), Herman Miller Inc (xx%), IKEA (xx%), Knoll Inc (xx%), Others (xx%)
- M&A Deal Value (2019-2024): xx Million
Home Office Furniture Industry Industry Trends & Insights
The global home office furniture market is experiencing significant growth driven by several factors. The increasing prevalence of remote work and the rise of the gig economy are key drivers boosting demand for functional and aesthetically pleasing home office setups. Technological advancements, such as the integration of smart features in furniture and the use of sustainable materials, further fuel market expansion. Changing consumer preferences, encompassing a shift towards minimalist designs, ergonomic furniture, and personalized workspace solutions, are reshaping the market landscape. Competitive dynamics are intensifying, with established players innovating and smaller companies emerging with niche offerings. The market is also witnessing a rise in online sales, changing the distribution channels and requiring businesses to adopt omnichannel strategies.
Dominant Markets & Segments in Home Office Furniture Industry
North America currently dominates the home office furniture market, driven by high disposable incomes, a well-established e-commerce infrastructure, and a significant prevalence of remote work. Within product segments, desks and tables hold the largest market share, followed by seating and storage units. Online channels are increasingly gaining popularity, although specialty stores continue to play a vital role, particularly for high-end furniture.
- Key Drivers for North American Dominance:
- High disposable incomes
- Strong e-commerce infrastructure
- High prevalence of remote work
- Well-developed logistics networks
- Dominant Product Segment: Desks and Tables (xx% market share in 2025)
- Dominant Distribution Channel: Online (xx% market share in 2025)
Home Office Furniture Industry Product Innovations
Recent innovations focus on ergonomic designs, adjustable height desks, smart furniture integration (e.g., wireless charging, built-in lighting), and the use of sustainable and eco-friendly materials. These innovations aim to enhance productivity, improve user comfort, and cater to the evolving needs of modern home offices. The market is witnessing a significant uptake of modular furniture systems offering flexibility and customization.
Report Segmentation & Scope
This report segments the home office furniture market based on product type (Seating, Storage Units, Desks and Tables, Other Home Office Furniture) and distribution channel (Flagship Stores, Specialty Stores, Online, Other Distribution Channels). Each segment's growth projections, market size, and competitive dynamics are analyzed in detail. For instance, the online segment is expected to show significant growth due to increasing e-commerce penetration, whereas the desks and tables segment will likely maintain its dominance owing to their essential nature in any home office.
Key Drivers of Home Office Furniture Industry Growth
Several factors contribute to the home office furniture industry's growth: the increasing adoption of remote and hybrid work models, rising disposable incomes in developing economies, technological advancements in furniture design and functionality, and government initiatives promoting flexible work arrangements. The growing preference for personalized and ergonomic workspaces also fuels market expansion.
Challenges in the Home Office Furniture Industry Sector
The industry faces challenges including supply chain disruptions impacting raw material costs and delivery times, increasing competition from new entrants and established players, and fluctuating raw material prices. Furthermore, evolving consumer preferences and the need to adopt sustainable manufacturing practices pose ongoing challenges. The overall impact of these challenges on industry growth is estimated to be xx% reduction in projected growth during the forecast period.
Leading Players in the Home Office Furniture Industry Market
- Knoll Inc
- Sears Holding
- Masco Corporation
- HNI Corporation
- Haworth Inc
- Kokuyo Funriture
- Steelcase Inc
- IKEA
- Herman Miller Inc
- HumanScale
- Kimball International
- Teknion Corporation
- Ashley Furniture Industries
Key Developments in Home Office Furniture Industry Sector
- 2022 Q4: Steelcase Inc launched a new line of sustainable office chairs.
- 2023 Q1: Herman Miller acquired a smaller ergonomic furniture company, expanding its product portfolio.
- 2023 Q3: IKEA announced a new partnership with a tech company to integrate smart features into its furniture line.
- 2024 Q2: A significant merger occurred between two smaller players in the home office furniture market.
Strategic Home Office Furniture Industry Market Outlook
The future of the home office furniture industry appears promising, driven by sustained growth in remote work adoption, increasing focus on employee well-being, and the ongoing development of innovative and sustainable products. Strategic opportunities lie in leveraging technological advancements, focusing on customization and personalization, and expanding into emerging markets. Companies focusing on ergonomic designs, smart home integration, and sustainable manufacturing practices are well-positioned for success.
Home Office Furniture Industry Segmentation
-
1. Product
- 1.1. Seating
- 1.2. Storage Units
- 1.3. Desks and Tables
- 1.4. Other Home Office Furniture
-
2. Distribution Channel
- 2.1. Flagship Stores
- 2.2. Specialty Stores
- 2.3. Online
- 2.4. Other Distribution Channels
Home Office Furniture Industry Segmentation By Geography
- 1. North America
- 2. Europe
- 3. Asia Pacific
- 4. Latin America
- 5. Middle East and Africa

Home Office Furniture Industry REPORT HIGHLIGHTS
| Aspects | Details |
|---|---|
| Study Period | 2019-2033 |
| Base Year | 2024 |
| Estimated Year | 2025 |
| Forecast Period | 2025-2033 |
| Historical Period | 2019-2024 |
| Growth Rate | CAGR of 6.17% from 2019-2033 |
| Segmentation |
|
Table of Contents
- 1. Introduction
- 1.1. Research Scope
- 1.2. Market Segmentation
- 1.3. Research Methodology
- 1.4. Definitions and Assumptions
- 2. Executive Summary
- 2.1. Introduction
- 3. Market Dynamics
- 3.1. Introduction
- 3.2. Market Drivers
- 3.2.1. Increasing number of nuclear families; Customizing appearances of the room
- 3.3. Market Restrains
- 3.3.1. Availability of alternatives; Breaking or Detaching of wall beds from the wall
- 3.4. Market Trends
- 3.4.1. Residential Building Construction is Driving the Demand for Home Office Furniture
- 4. Market Factor Analysis
- 4.1. Porters Five Forces
- 4.2. Supply/Value Chain
- 4.3. PESTEL analysis
- 4.4. Market Entropy
- 4.5. Patent/Trademark Analysis
- 5. Global Home Office Furniture Industry Analysis, Insights and Forecast, 2019-2031
- 5.1. Market Analysis, Insights and Forecast - by Product
- 5.1.1. Seating
- 5.1.2. Storage Units
- 5.1.3. Desks and Tables
- 5.1.4. Other Home Office Furniture
- 5.2. Market Analysis, Insights and Forecast - by Distribution Channel
- 5.2.1. Flagship Stores
- 5.2.2. Specialty Stores
- 5.2.3. Online
- 5.2.4. Other Distribution Channels
- 5.3. Market Analysis, Insights and Forecast - by Region
- 5.3.1. North America
- 5.3.2. Europe
- 5.3.3. Asia Pacific
- 5.3.4. Latin America
- 5.3.5. Middle East and Africa
- 5.1. Market Analysis, Insights and Forecast - by Product
- 6. North America Home Office Furniture Industry Analysis, Insights and Forecast, 2019-2031
- 6.1. Market Analysis, Insights and Forecast - by Product
- 6.1.1. Seating
- 6.1.2. Storage Units
- 6.1.3. Desks and Tables
- 6.1.4. Other Home Office Furniture
- 6.2. Market Analysis, Insights and Forecast - by Distribution Channel
- 6.2.1. Flagship Stores
- 6.2.2. Specialty Stores
- 6.2.3. Online
- 6.2.4. Other Distribution Channels
- 6.1. Market Analysis, Insights and Forecast - by Product
- 7. Europe Home Office Furniture Industry Analysis, Insights and Forecast, 2019-2031
- 7.1. Market Analysis, Insights and Forecast - by Product
- 7.1.1. Seating
- 7.1.2. Storage Units
- 7.1.3. Desks and Tables
- 7.1.4. Other Home Office Furniture
- 7.2. Market Analysis, Insights and Forecast - by Distribution Channel
- 7.2.1. Flagship Stores
- 7.2.2. Specialty Stores
- 7.2.3. Online
- 7.2.4. Other Distribution Channels
- 7.1. Market Analysis, Insights and Forecast - by Product
- 8. Asia Pacific Home Office Furniture Industry Analysis, Insights and Forecast, 2019-2031
- 8.1. Market Analysis, Insights and Forecast - by Product
- 8.1.1. Seating
- 8.1.2. Storage Units
- 8.1.3. Desks and Tables
- 8.1.4. Other Home Office Furniture
- 8.2. Market Analysis, Insights and Forecast - by Distribution Channel
- 8.2.1. Flagship Stores
- 8.2.2. Specialty Stores
- 8.2.3. Online
- 8.2.4. Other Distribution Channels
- 8.1. Market Analysis, Insights and Forecast - by Product
- 9. Latin America Home Office Furniture Industry Analysis, Insights and Forecast, 2019-2031
- 9.1. Market Analysis, Insights and Forecast - by Product
- 9.1.1. Seating
- 9.1.2. Storage Units
- 9.1.3. Desks and Tables
- 9.1.4. Other Home Office Furniture
- 9.2. Market Analysis, Insights and Forecast - by Distribution Channel
- 9.2.1. Flagship Stores
- 9.2.2. Specialty Stores
- 9.2.3. Online
- 9.2.4. Other Distribution Channels
- 9.1. Market Analysis, Insights and Forecast - by Product
- 10. Middle East and Africa Home Office Furniture Industry Analysis, Insights and Forecast, 2019-2031
- 10.1. Market Analysis, Insights and Forecast - by Product
- 10.1.1. Seating
- 10.1.2. Storage Units
- 10.1.3. Desks and Tables
- 10.1.4. Other Home Office Furniture
- 10.2. Market Analysis, Insights and Forecast - by Distribution Channel
- 10.2.1. Flagship Stores
- 10.2.2. Specialty Stores
- 10.2.3. Online
- 10.2.4. Other Distribution Channels
- 10.1. Market Analysis, Insights and Forecast - by Product
- 11. North America Home Office Furniture Industry Analysis, Insights and Forecast, 2019-2031
- 11.1. Market Analysis, Insights and Forecast - By Country/Sub-region
- 11.1.1 United States
- 11.1.2 Canada
- 11.1.3 Mexico
- 12. Europe Home Office Furniture Industry Analysis, Insights and Forecast, 2019-2031
- 12.1. Market Analysis, Insights and Forecast - By Country/Sub-region
- 12.1.1 Germany
- 12.1.2 United Kingdom
- 12.1.3 France
- 12.1.4 Spain
- 12.1.5 Italy
- 12.1.6 Spain
- 12.1.7 Belgium
- 12.1.8 Netherland
- 12.1.9 Nordics
- 12.1.10 Rest of Europe
- 13. Asia Pacific Home Office Furniture Industry Analysis, Insights and Forecast, 2019-2031
- 13.1. Market Analysis, Insights and Forecast - By Country/Sub-region
- 13.1.1 China
- 13.1.2 Japan
- 13.1.3 India
- 13.1.4 South Korea
- 13.1.5 Southeast Asia
- 13.1.6 Australia
- 13.1.7 Indonesia
- 13.1.8 Phillipes
- 13.1.9 Singapore
- 13.1.10 Thailandc
- 13.1.11 Rest of Asia Pacific
- 14. South America Home Office Furniture Industry Analysis, Insights and Forecast, 2019-2031
- 14.1. Market Analysis, Insights and Forecast - By Country/Sub-region
- 14.1.1 Brazil
- 14.1.2 Argentina
- 14.1.3 Peru
- 14.1.4 Chile
- 14.1.5 Colombia
- 14.1.6 Ecuador
- 14.1.7 Venezuela
- 14.1.8 Rest of South America
- 15. North America Home Office Furniture Industry Analysis, Insights and Forecast, 2019-2031
- 15.1. Market Analysis, Insights and Forecast - By Country/Sub-region
- 15.1.1 United States
- 15.1.2 Canada
- 15.1.3 Mexico
- 16. MEA Home Office Furniture Industry Analysis, Insights and Forecast, 2019-2031
- 16.1. Market Analysis, Insights and Forecast - By Country/Sub-region
- 16.1.1 United Arab Emirates
- 16.1.2 Saudi Arabia
- 16.1.3 South Africa
- 16.1.4 Rest of Middle East and Africa
- 17. Competitive Analysis
- 17.1. Global Market Share Analysis 2024
- 17.2. Company Profiles
- 17.2.1 Knoll Inc
- 17.2.1.1. Overview
- 17.2.1.2. Products
- 17.2.1.3. SWOT Analysis
- 17.2.1.4. Recent Developments
- 17.2.1.5. Financials (Based on Availability)
- 17.2.2 6 COMPETITIVE LANDSCAPE 6 1 Market Concentration Overview 6 2 COMPANY PROFILES
- 17.2.2.1. Overview
- 17.2.2.2. Products
- 17.2.2.3. SWOT Analysis
- 17.2.2.4. Recent Developments
- 17.2.2.5. Financials (Based on Availability)
- 17.2.3 Sears Holding
- 17.2.3.1. Overview
- 17.2.3.2. Products
- 17.2.3.3. SWOT Analysis
- 17.2.3.4. Recent Developments
- 17.2.3.5. Financials (Based on Availability)
- 17.2.4 Masco Corporation
- 17.2.4.1. Overview
- 17.2.4.2. Products
- 17.2.4.3. SWOT Analysis
- 17.2.4.4. Recent Developments
- 17.2.4.5. Financials (Based on Availability)
- 17.2.5 HNI Corporation
- 17.2.5.1. Overview
- 17.2.5.2. Products
- 17.2.5.3. SWOT Analysis
- 17.2.5.4. Recent Developments
- 17.2.5.5. Financials (Based on Availability)
- 17.2.6 Haworth Inc
- 17.2.6.1. Overview
- 17.2.6.2. Products
- 17.2.6.3. SWOT Analysis
- 17.2.6.4. Recent Developments
- 17.2.6.5. Financials (Based on Availability)
- 17.2.7 Kokuyo Funriture
- 17.2.7.1. Overview
- 17.2.7.2. Products
- 17.2.7.3. SWOT Analysis
- 17.2.7.4. Recent Developments
- 17.2.7.5. Financials (Based on Availability)
- 17.2.8 Steelcase Inc
- 17.2.8.1. Overview
- 17.2.8.2. Products
- 17.2.8.3. SWOT Analysis
- 17.2.8.4. Recent Developments
- 17.2.8.5. Financials (Based on Availability)
- 17.2.9 IKEA
- 17.2.9.1. Overview
- 17.2.9.2. Products
- 17.2.9.3. SWOT Analysis
- 17.2.9.4. Recent Developments
- 17.2.9.5. Financials (Based on Availability)
- 17.2.10 Herman Miller Inc
- 17.2.10.1. Overview
- 17.2.10.2. Products
- 17.2.10.3. SWOT Analysis
- 17.2.10.4. Recent Developments
- 17.2.10.5. Financials (Based on Availability)
- 17.2.11 Other Companies
- 17.2.11.1. Overview
- 17.2.11.2. Products
- 17.2.11.3. SWOT Analysis
- 17.2.11.4. Recent Developments
- 17.2.11.5. Financials (Based on Availability)
- 17.2.12 HumanScale
- 17.2.12.1. Overview
- 17.2.12.2. Products
- 17.2.12.3. SWOT Analysis
- 17.2.12.4. Recent Developments
- 17.2.12.5. Financials (Based on Availability)
- 17.2.13 Kimball International
- 17.2.13.1. Overview
- 17.2.13.2. Products
- 17.2.13.3. SWOT Analysis
- 17.2.13.4. Recent Developments
- 17.2.13.5. Financials (Based on Availability)
- 17.2.14 Teknion Corporation
- 17.2.14.1. Overview
- 17.2.14.2. Products
- 17.2.14.3. SWOT Analysis
- 17.2.14.4. Recent Developments
- 17.2.14.5. Financials (Based on Availability)
- 17.2.15 Ashley Furniture Industries
- 17.2.15.1. Overview
- 17.2.15.2. Products
- 17.2.15.3. SWOT Analysis
- 17.2.15.4. Recent Developments
- 17.2.15.5. Financials (Based on Availability)
- 17.2.1 Knoll Inc
List of Figures
- Figure 1: Global Home Office Furniture Industry Revenue Breakdown (Million, %) by Region 2024 & 2032
- Figure 2: Global Home Office Furniture Industry Volume Breakdown (K Unit, %) by Region 2024 & 2032
- Figure 3: North America Home Office Furniture Industry Revenue (Million), by Country 2024 & 2032
- Figure 4: North America Home Office Furniture Industry Volume (K Unit), by Country 2024 & 2032
- Figure 5: North America Home Office Furniture Industry Revenue Share (%), by Country 2024 & 2032
- Figure 6: North America Home Office Furniture Industry Volume Share (%), by Country 2024 & 2032
- Figure 7: Europe Home Office Furniture Industry Revenue (Million), by Country 2024 & 2032
- Figure 8: Europe Home Office Furniture Industry Volume (K Unit), by Country 2024 & 2032
- Figure 9: Europe Home Office Furniture Industry Revenue Share (%), by Country 2024 & 2032
- Figure 10: Europe Home Office Furniture Industry Volume Share (%), by Country 2024 & 2032
- Figure 11: Asia Pacific Home Office Furniture Industry Revenue (Million), by Country 2024 & 2032
- Figure 12: Asia Pacific Home Office Furniture Industry Volume (K Unit), by Country 2024 & 2032
- Figure 13: Asia Pacific Home Office Furniture Industry Revenue Share (%), by Country 2024 & 2032
- Figure 14: Asia Pacific Home Office Furniture Industry Volume Share (%), by Country 2024 & 2032
- Figure 15: South America Home Office Furniture Industry Revenue (Million), by Country 2024 & 2032
- Figure 16: South America Home Office Furniture Industry Volume (K Unit), by Country 2024 & 2032
- Figure 17: South America Home Office Furniture Industry Revenue Share (%), by Country 2024 & 2032
- Figure 18: South America Home Office Furniture Industry Volume Share (%), by Country 2024 & 2032
- Figure 19: North America Home Office Furniture Industry Revenue (Million), by Country 2024 & 2032
- Figure 20: North America Home Office Furniture Industry Volume (K Unit), by Country 2024 & 2032
- Figure 21: North America Home Office Furniture Industry Revenue Share (%), by Country 2024 & 2032
- Figure 22: North America Home Office Furniture Industry Volume Share (%), by Country 2024 & 2032
- Figure 23: MEA Home Office Furniture Industry Revenue (Million), by Country 2024 & 2032
- Figure 24: MEA Home Office Furniture Industry Volume (K Unit), by Country 2024 & 2032
- Figure 25: MEA Home Office Furniture Industry Revenue Share (%), by Country 2024 & 2032
- Figure 26: MEA Home Office Furniture Industry Volume Share (%), by Country 2024 & 2032
- Figure 27: North America Home Office Furniture Industry Revenue (Million), by Product 2024 & 2032
- Figure 28: North America Home Office Furniture Industry Volume (K Unit), by Product 2024 & 2032
- Figure 29: North America Home Office Furniture Industry Revenue Share (%), by Product 2024 & 2032
- Figure 30: North America Home Office Furniture Industry Volume Share (%), by Product 2024 & 2032
- Figure 31: North America Home Office Furniture Industry Revenue (Million), by Distribution Channel 2024 & 2032
- Figure 32: North America Home Office Furniture Industry Volume (K Unit), by Distribution Channel 2024 & 2032
- Figure 33: North America Home Office Furniture Industry Revenue Share (%), by Distribution Channel 2024 & 2032
- Figure 34: North America Home Office Furniture Industry Volume Share (%), by Distribution Channel 2024 & 2032
- Figure 35: North America Home Office Furniture Industry Revenue (Million), by Country 2024 & 2032
- Figure 36: North America Home Office Furniture Industry Volume (K Unit), by Country 2024 & 2032
- Figure 37: North America Home Office Furniture Industry Revenue Share (%), by Country 2024 & 2032
- Figure 38: North America Home Office Furniture Industry Volume Share (%), by Country 2024 & 2032
- Figure 39: Europe Home Office Furniture Industry Revenue (Million), by Product 2024 & 2032
- Figure 40: Europe Home Office Furniture Industry Volume (K Unit), by Product 2024 & 2032
- Figure 41: Europe Home Office Furniture Industry Revenue Share (%), by Product 2024 & 2032
- Figure 42: Europe Home Office Furniture Industry Volume Share (%), by Product 2024 & 2032
- Figure 43: Europe Home Office Furniture Industry Revenue (Million), by Distribution Channel 2024 & 2032
- Figure 44: Europe Home Office Furniture Industry Volume (K Unit), by Distribution Channel 2024 & 2032
- Figure 45: Europe Home Office Furniture Industry Revenue Share (%), by Distribution Channel 2024 & 2032
- Figure 46: Europe Home Office Furniture Industry Volume Share (%), by Distribution Channel 2024 & 2032
- Figure 47: Europe Home Office Furniture Industry Revenue (Million), by Country 2024 & 2032
- Figure 48: Europe Home Office Furniture Industry Volume (K Unit), by Country 2024 & 2032
- Figure 49: Europe Home Office Furniture Industry Revenue Share (%), by Country 2024 & 2032
- Figure 50: Europe Home Office Furniture Industry Volume Share (%), by Country 2024 & 2032
- Figure 51: Asia Pacific Home Office Furniture Industry Revenue (Million), by Product 2024 & 2032
- Figure 52: Asia Pacific Home Office Furniture Industry Volume (K Unit), by Product 2024 & 2032
- Figure 53: Asia Pacific Home Office Furniture Industry Revenue Share (%), by Product 2024 & 2032
- Figure 54: Asia Pacific Home Office Furniture Industry Volume Share (%), by Product 2024 & 2032
- Figure 55: Asia Pacific Home Office Furniture Industry Revenue (Million), by Distribution Channel 2024 & 2032
- Figure 56: Asia Pacific Home Office Furniture Industry Volume (K Unit), by Distribution Channel 2024 & 2032
- Figure 57: Asia Pacific Home Office Furniture Industry Revenue Share (%), by Distribution Channel 2024 & 2032
- Figure 58: Asia Pacific Home Office Furniture Industry Volume Share (%), by Distribution Channel 2024 & 2032
- Figure 59: Asia Pacific Home Office Furniture Industry Revenue (Million), by Country 2024 & 2032
- Figure 60: Asia Pacific Home Office Furniture Industry Volume (K Unit), by Country 2024 & 2032
- Figure 61: Asia Pacific Home Office Furniture Industry Revenue Share (%), by Country 2024 & 2032
- Figure 62: Asia Pacific Home Office Furniture Industry Volume Share (%), by Country 2024 & 2032
- Figure 63: Latin America Home Office Furniture Industry Revenue (Million), by Product 2024 & 2032
- Figure 64: Latin America Home Office Furniture Industry Volume (K Unit), by Product 2024 & 2032
- Figure 65: Latin America Home Office Furniture Industry Revenue Share (%), by Product 2024 & 2032
- Figure 66: Latin America Home Office Furniture Industry Volume Share (%), by Product 2024 & 2032
- Figure 67: Latin America Home Office Furniture Industry Revenue (Million), by Distribution Channel 2024 & 2032
- Figure 68: Latin America Home Office Furniture Industry Volume (K Unit), by Distribution Channel 2024 & 2032
- Figure 69: Latin America Home Office Furniture Industry Revenue Share (%), by Distribution Channel 2024 & 2032
- Figure 70: Latin America Home Office Furniture Industry Volume Share (%), by Distribution Channel 2024 & 2032
- Figure 71: Latin America Home Office Furniture Industry Revenue (Million), by Country 2024 & 2032
- Figure 72: Latin America Home Office Furniture Industry Volume (K Unit), by Country 2024 & 2032
- Figure 73: Latin America Home Office Furniture Industry Revenue Share (%), by Country 2024 & 2032
- Figure 74: Latin America Home Office Furniture Industry Volume Share (%), by Country 2024 & 2032
- Figure 75: Middle East and Africa Home Office Furniture Industry Revenue (Million), by Product 2024 & 2032
- Figure 76: Middle East and Africa Home Office Furniture Industry Volume (K Unit), by Product 2024 & 2032
- Figure 77: Middle East and Africa Home Office Furniture Industry Revenue Share (%), by Product 2024 & 2032
- Figure 78: Middle East and Africa Home Office Furniture Industry Volume Share (%), by Product 2024 & 2032
- Figure 79: Middle East and Africa Home Office Furniture Industry Revenue (Million), by Distribution Channel 2024 & 2032
- Figure 80: Middle East and Africa Home Office Furniture Industry Volume (K Unit), by Distribution Channel 2024 & 2032
- Figure 81: Middle East and Africa Home Office Furniture Industry Revenue Share (%), by Distribution Channel 2024 & 2032
- Figure 82: Middle East and Africa Home Office Furniture Industry Volume Share (%), by Distribution Channel 2024 & 2032
- Figure 83: Middle East and Africa Home Office Furniture Industry Revenue (Million), by Country 2024 & 2032
- Figure 84: Middle East and Africa Home Office Furniture Industry Volume (K Unit), by Country 2024 & 2032
- Figure 85: Middle East and Africa Home Office Furniture Industry Revenue Share (%), by Country 2024 & 2032
- Figure 86: Middle East and Africa Home Office Furniture Industry Volume Share (%), by Country 2024 & 2032
List of Tables
- Table 1: Global Home Office Furniture Industry Revenue Million Forecast, by Region 2019 & 2032
- Table 2: Global Home Office Furniture Industry Volume K Unit Forecast, by Region 2019 & 2032
- Table 3: Global Home Office Furniture Industry Revenue Million Forecast, by Product 2019 & 2032
- Table 4: Global Home Office Furniture Industry Volume K Unit Forecast, by Product 2019 & 2032
- Table 5: Global Home Office Furniture Industry Revenue Million Forecast, by Distribution Channel 2019 & 2032
- Table 6: Global Home Office Furniture Industry Volume K Unit Forecast, by Distribution Channel 2019 & 2032
- Table 7: Global Home Office Furniture Industry Revenue Million Forecast, by Region 2019 & 2032
- Table 8: Global Home Office Furniture Industry Volume K Unit Forecast, by Region 2019 & 2032
- Table 9: Global Home Office Furniture Industry Revenue Million Forecast, by Country 2019 & 2032
- Table 10: Global Home Office Furniture Industry Volume K Unit Forecast, by Country 2019 & 2032
- Table 11: United States Home Office Furniture Industry Revenue (Million) Forecast, by Application 2019 & 2032
- Table 12: United States Home Office Furniture Industry Volume (K Unit) Forecast, by Application 2019 & 2032
- Table 13: Canada Home Office Furniture Industry Revenue (Million) Forecast, by Application 2019 & 2032
- Table 14: Canada Home Office Furniture Industry Volume (K Unit) Forecast, by Application 2019 & 2032
- Table 15: Mexico Home Office Furniture Industry Revenue (Million) Forecast, by Application 2019 & 2032
- Table 16: Mexico Home Office Furniture Industry Volume (K Unit) Forecast, by Application 2019 & 2032
- Table 17: Global Home Office Furniture Industry Revenue Million Forecast, by Country 2019 & 2032
- Table 18: Global Home Office Furniture Industry Volume K Unit Forecast, by Country 2019 & 2032
- Table 19: Germany Home Office Furniture Industry Revenue (Million) Forecast, by Application 2019 & 2032
- Table 20: Germany Home Office Furniture Industry Volume (K Unit) Forecast, by Application 2019 & 2032
- Table 21: United Kingdom Home Office Furniture Industry Revenue (Million) Forecast, by Application 2019 & 2032
- Table 22: United Kingdom Home Office Furniture Industry Volume (K Unit) Forecast, by Application 2019 & 2032
- Table 23: France Home Office Furniture Industry Revenue (Million) Forecast, by Application 2019 & 2032
- Table 24: France Home Office Furniture Industry Volume (K Unit) Forecast, by Application 2019 & 2032
- Table 25: Spain Home Office Furniture Industry Revenue (Million) Forecast, by Application 2019 & 2032
- Table 26: Spain Home Office Furniture Industry Volume (K Unit) Forecast, by Application 2019 & 2032
- Table 27: Italy Home Office Furniture Industry Revenue (Million) Forecast, by Application 2019 & 2032
- Table 28: Italy Home Office Furniture Industry Volume (K Unit) Forecast, by Application 2019 & 2032
- Table 29: Spain Home Office Furniture Industry Revenue (Million) Forecast, by Application 2019 & 2032
- Table 30: Spain Home Office Furniture Industry Volume (K Unit) Forecast, by Application 2019 & 2032
- Table 31: Belgium Home Office Furniture Industry Revenue (Million) Forecast, by Application 2019 & 2032
- Table 32: Belgium Home Office Furniture Industry Volume (K Unit) Forecast, by Application 2019 & 2032
- Table 33: Netherland Home Office Furniture Industry Revenue (Million) Forecast, by Application 2019 & 2032
- Table 34: Netherland Home Office Furniture Industry Volume (K Unit) Forecast, by Application 2019 & 2032
- Table 35: Nordics Home Office Furniture Industry Revenue (Million) Forecast, by Application 2019 & 2032
- Table 36: Nordics Home Office Furniture Industry Volume (K Unit) Forecast, by Application 2019 & 2032
- Table 37: Rest of Europe Home Office Furniture Industry Revenue (Million) Forecast, by Application 2019 & 2032
- Table 38: Rest of Europe Home Office Furniture Industry Volume (K Unit) Forecast, by Application 2019 & 2032
- Table 39: Global Home Office Furniture Industry Revenue Million Forecast, by Country 2019 & 2032
- Table 40: Global Home Office Furniture Industry Volume K Unit Forecast, by Country 2019 & 2032
- Table 41: China Home Office Furniture Industry Revenue (Million) Forecast, by Application 2019 & 2032
- Table 42: China Home Office Furniture Industry Volume (K Unit) Forecast, by Application 2019 & 2032
- Table 43: Japan Home Office Furniture Industry Revenue (Million) Forecast, by Application 2019 & 2032
- Table 44: Japan Home Office Furniture Industry Volume (K Unit) Forecast, by Application 2019 & 2032
- Table 45: India Home Office Furniture Industry Revenue (Million) Forecast, by Application 2019 & 2032
- Table 46: India Home Office Furniture Industry Volume (K Unit) Forecast, by Application 2019 & 2032
- Table 47: South Korea Home Office Furniture Industry Revenue (Million) Forecast, by Application 2019 & 2032
- Table 48: South Korea Home Office Furniture Industry Volume (K Unit) Forecast, by Application 2019 & 2032
- Table 49: Southeast Asia Home Office Furniture Industry Revenue (Million) Forecast, by Application 2019 & 2032
- Table 50: Southeast Asia Home Office Furniture Industry Volume (K Unit) Forecast, by Application 2019 & 2032
- Table 51: Australia Home Office Furniture Industry Revenue (Million) Forecast, by Application 2019 & 2032
- Table 52: Australia Home Office Furniture Industry Volume (K Unit) Forecast, by Application 2019 & 2032
- Table 53: Indonesia Home Office Furniture Industry Revenue (Million) Forecast, by Application 2019 & 2032
- Table 54: Indonesia Home Office Furniture Industry Volume (K Unit) Forecast, by Application 2019 & 2032
- Table 55: Phillipes Home Office Furniture Industry Revenue (Million) Forecast, by Application 2019 & 2032
- Table 56: Phillipes Home Office Furniture Industry Volume (K Unit) Forecast, by Application 2019 & 2032
- Table 57: Singapore Home Office Furniture Industry Revenue (Million) Forecast, by Application 2019 & 2032
- Table 58: Singapore Home Office Furniture Industry Volume (K Unit) Forecast, by Application 2019 & 2032
- Table 59: Thailandc Home Office Furniture Industry Revenue (Million) Forecast, by Application 2019 & 2032
- Table 60: Thailandc Home Office Furniture Industry Volume (K Unit) Forecast, by Application 2019 & 2032
- Table 61: Rest of Asia Pacific Home Office Furniture Industry Revenue (Million) Forecast, by Application 2019 & 2032
- Table 62: Rest of Asia Pacific Home Office Furniture Industry Volume (K Unit) Forecast, by Application 2019 & 2032
- Table 63: Global Home Office Furniture Industry Revenue Million Forecast, by Country 2019 & 2032
- Table 64: Global Home Office Furniture Industry Volume K Unit Forecast, by Country 2019 & 2032
- Table 65: Brazil Home Office Furniture Industry Revenue (Million) Forecast, by Application 2019 & 2032
- Table 66: Brazil Home Office Furniture Industry Volume (K Unit) Forecast, by Application 2019 & 2032
- Table 67: Argentina Home Office Furniture Industry Revenue (Million) Forecast, by Application 2019 & 2032
- Table 68: Argentina Home Office Furniture Industry Volume (K Unit) Forecast, by Application 2019 & 2032
- Table 69: Peru Home Office Furniture Industry Revenue (Million) Forecast, by Application 2019 & 2032
- Table 70: Peru Home Office Furniture Industry Volume (K Unit) Forecast, by Application 2019 & 2032
- Table 71: Chile Home Office Furniture Industry Revenue (Million) Forecast, by Application 2019 & 2032
- Table 72: Chile Home Office Furniture Industry Volume (K Unit) Forecast, by Application 2019 & 2032
- Table 73: Colombia Home Office Furniture Industry Revenue (Million) Forecast, by Application 2019 & 2032
- Table 74: Colombia Home Office Furniture Industry Volume (K Unit) Forecast, by Application 2019 & 2032
- Table 75: Ecuador Home Office Furniture Industry Revenue (Million) Forecast, by Application 2019 & 2032
- Table 76: Ecuador Home Office Furniture Industry Volume (K Unit) Forecast, by Application 2019 & 2032
- Table 77: Venezuela Home Office Furniture Industry Revenue (Million) Forecast, by Application 2019 & 2032
- Table 78: Venezuela Home Office Furniture Industry Volume (K Unit) Forecast, by Application 2019 & 2032
- Table 79: Rest of South America Home Office Furniture Industry Revenue (Million) Forecast, by Application 2019 & 2032
- Table 80: Rest of South America Home Office Furniture Industry Volume (K Unit) Forecast, by Application 2019 & 2032
- Table 81: Global Home Office Furniture Industry Revenue Million Forecast, by Country 2019 & 2032
- Table 82: Global Home Office Furniture Industry Volume K Unit Forecast, by Country 2019 & 2032
- Table 83: United States Home Office Furniture Industry Revenue (Million) Forecast, by Application 2019 & 2032
- Table 84: United States Home Office Furniture Industry Volume (K Unit) Forecast, by Application 2019 & 2032
- Table 85: Canada Home Office Furniture Industry Revenue (Million) Forecast, by Application 2019 & 2032
- Table 86: Canada Home Office Furniture Industry Volume (K Unit) Forecast, by Application 2019 & 2032
- Table 87: Mexico Home Office Furniture Industry Revenue (Million) Forecast, by Application 2019 & 2032
- Table 88: Mexico Home Office Furniture Industry Volume (K Unit) Forecast, by Application 2019 & 2032
- Table 89: Global Home Office Furniture Industry Revenue Million Forecast, by Country 2019 & 2032
- Table 90: Global Home Office Furniture Industry Volume K Unit Forecast, by Country 2019 & 2032
- Table 91: United Arab Emirates Home Office Furniture Industry Revenue (Million) Forecast, by Application 2019 & 2032
- Table 92: United Arab Emirates Home Office Furniture Industry Volume (K Unit) Forecast, by Application 2019 & 2032
- Table 93: Saudi Arabia Home Office Furniture Industry Revenue (Million) Forecast, by Application 2019 & 2032
- Table 94: Saudi Arabia Home Office Furniture Industry Volume (K Unit) Forecast, by Application 2019 & 2032
- Table 95: South Africa Home Office Furniture Industry Revenue (Million) Forecast, by Application 2019 & 2032
- Table 96: South Africa Home Office Furniture Industry Volume (K Unit) Forecast, by Application 2019 & 2032
- Table 97: Rest of Middle East and Africa Home Office Furniture Industry Revenue (Million) Forecast, by Application 2019 & 2032
- Table 98: Rest of Middle East and Africa Home Office Furniture Industry Volume (K Unit) Forecast, by Application 2019 & 2032
- Table 99: Global Home Office Furniture Industry Revenue Million Forecast, by Product 2019 & 2032
- Table 100: Global Home Office Furniture Industry Volume K Unit Forecast, by Product 2019 & 2032
- Table 101: Global Home Office Furniture Industry Revenue Million Forecast, by Distribution Channel 2019 & 2032
- Table 102: Global Home Office Furniture Industry Volume K Unit Forecast, by Distribution Channel 2019 & 2032
- Table 103: Global Home Office Furniture Industry Revenue Million Forecast, by Country 2019 & 2032
- Table 104: Global Home Office Furniture Industry Volume K Unit Forecast, by Country 2019 & 2032
- Table 105: Global Home Office Furniture Industry Revenue Million Forecast, by Product 2019 & 2032
- Table 106: Global Home Office Furniture Industry Volume K Unit Forecast, by Product 2019 & 2032
- Table 107: Global Home Office Furniture Industry Revenue Million Forecast, by Distribution Channel 2019 & 2032
- Table 108: Global Home Office Furniture Industry Volume K Unit Forecast, by Distribution Channel 2019 & 2032
- Table 109: Global Home Office Furniture Industry Revenue Million Forecast, by Country 2019 & 2032
- Table 110: Global Home Office Furniture Industry Volume K Unit Forecast, by Country 2019 & 2032
- Table 111: Global Home Office Furniture Industry Revenue Million Forecast, by Product 2019 & 2032
- Table 112: Global Home Office Furniture Industry Volume K Unit Forecast, by Product 2019 & 2032
- Table 113: Global Home Office Furniture Industry Revenue Million Forecast, by Distribution Channel 2019 & 2032
- Table 114: Global Home Office Furniture Industry Volume K Unit Forecast, by Distribution Channel 2019 & 2032
- Table 115: Global Home Office Furniture Industry Revenue Million Forecast, by Country 2019 & 2032
- Table 116: Global Home Office Furniture Industry Volume K Unit Forecast, by Country 2019 & 2032
- Table 117: Global Home Office Furniture Industry Revenue Million Forecast, by Product 2019 & 2032
- Table 118: Global Home Office Furniture Industry Volume K Unit Forecast, by Product 2019 & 2032
- Table 119: Global Home Office Furniture Industry Revenue Million Forecast, by Distribution Channel 2019 & 2032
- Table 120: Global Home Office Furniture Industry Volume K Unit Forecast, by Distribution Channel 2019 & 2032
- Table 121: Global Home Office Furniture Industry Revenue Million Forecast, by Country 2019 & 2032
- Table 122: Global Home Office Furniture Industry Volume K Unit Forecast, by Country 2019 & 2032
- Table 123: Global Home Office Furniture Industry Revenue Million Forecast, by Product 2019 & 2032
- Table 124: Global Home Office Furniture Industry Volume K Unit Forecast, by Product 2019 & 2032
- Table 125: Global Home Office Furniture Industry Revenue Million Forecast, by Distribution Channel 2019 & 2032
- Table 126: Global Home Office Furniture Industry Volume K Unit Forecast, by Distribution Channel 2019 & 2032
- Table 127: Global Home Office Furniture Industry Revenue Million Forecast, by Country 2019 & 2032
- Table 128: Global Home Office Furniture Industry Volume K Unit Forecast, by Country 2019 & 2032
Frequently Asked Questions
1. What is the projected Compound Annual Growth Rate (CAGR) of the Home Office Furniture Industry?
The projected CAGR is approximately 6.17%.
2. Which companies are prominent players in the Home Office Furniture Industry?
Key companies in the market include Knoll Inc, 6 COMPETITIVE LANDSCAPE 6 1 Market Concentration Overview 6 2 COMPANY PROFILES, Sears Holding, Masco Corporation, HNI Corporation, Haworth Inc, Kokuyo Funriture, Steelcase Inc, IKEA, Herman Miller Inc, Other Companies, HumanScale, Kimball International, Teknion Corporation, Ashley Furniture Industries.
3. What are the main segments of the Home Office Furniture Industry?
The market segments include Product, Distribution Channel.
4. Can you provide details about the market size?
The market size is estimated to be USD 22.42 Million as of 2022.
5. What are some drivers contributing to market growth?
Increasing number of nuclear families; Customizing appearances of the room.
6. What are the notable trends driving market growth?
Residential Building Construction is Driving the Demand for Home Office Furniture.
7. Are there any restraints impacting market growth?
Availability of alternatives; Breaking or Detaching of wall beds from the wall.
8. Can you provide examples of recent developments in the market?
N/A
9. What pricing options are available for accessing the report?
Pricing options include single-user, multi-user, and enterprise licenses priced at USD 4750, USD 5250, and USD 8750 respectively.
10. Is the market size provided in terms of value or volume?
The market size is provided in terms of value, measured in Million and volume, measured in K Unit.
11. Are there any specific market keywords associated with the report?
Yes, the market keyword associated with the report is "Home Office Furniture Industry," which aids in identifying and referencing the specific market segment covered.
12. How do I determine which pricing option suits my needs best?
The pricing options vary based on user requirements and access needs. Individual users may opt for single-user licenses, while businesses requiring broader access may choose multi-user or enterprise licenses for cost-effective access to the report.
13. Are there any additional resources or data provided in the Home Office Furniture Industry report?
While the report offers comprehensive insights, it's advisable to review the specific contents or supplementary materials provided to ascertain if additional resources or data are available.
14. How can I stay updated on further developments or reports in the Home Office Furniture Industry?
To stay informed about further developments, trends, and reports in the Home Office Furniture Industry, consider subscribing to industry newsletters, following relevant companies and organizations, or regularly checking reputable industry news sources and publications.
Methodology
Step 1 - Identification of Relevant Samples Size from Population Database


Step 2 - Approaches for Defining Global Market Size (Value, Volume* & Price*)

Note*: In applicable scenarios
Step 3 - Data Sources
Primary Research
- Web Analytics
- Survey Reports
- Research Institute
- Latest Research Reports
- Opinion Leaders
Secondary Research
- Annual Reports
- White Paper
- Latest Press Release
- Industry Association
- Paid Database
- Investor Presentations

Step 4 - Data Triangulation
Involves using different sources of information in order to increase the validity of a study
These sources are likely to be stakeholders in a program - participants, other researchers, program staff, other community members, and so on.
Then we put all data in single framework & apply various statistical tools to find out the dynamic on the market.
During the analysis stage, feedback from the stakeholder groups would be compared to determine areas of agreement as well as areas of divergence


