
Key Insights
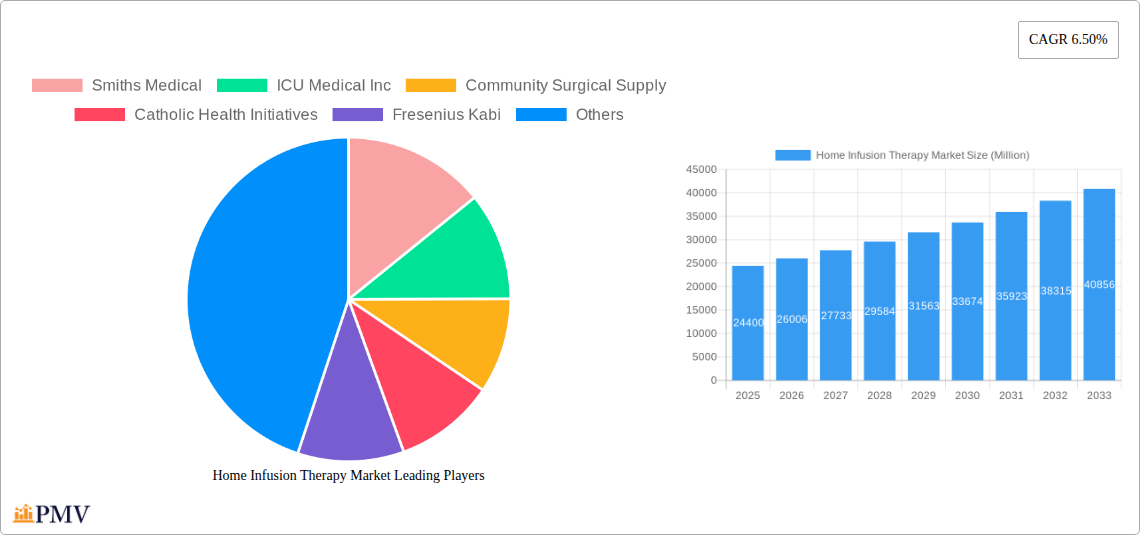
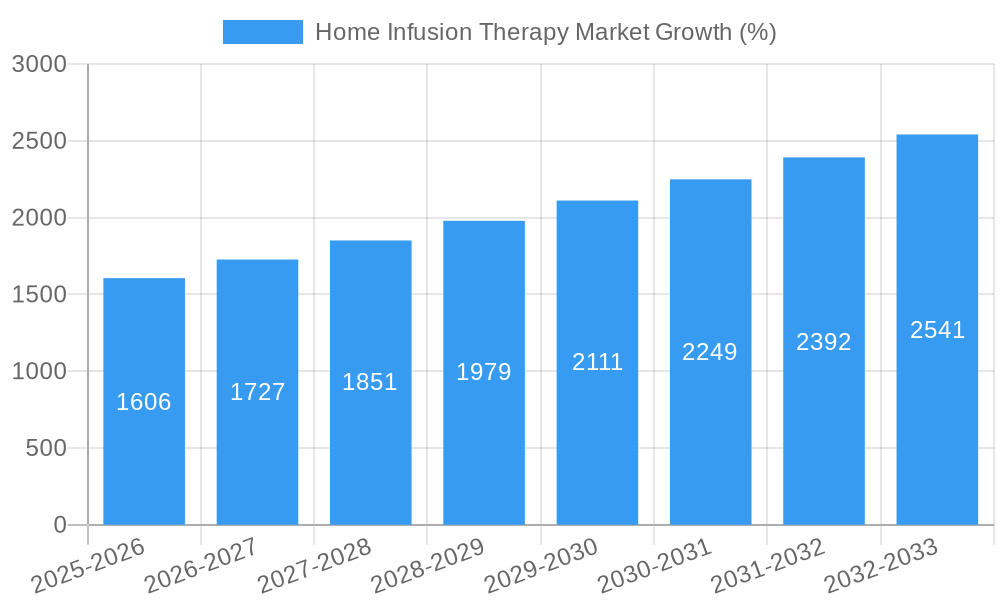
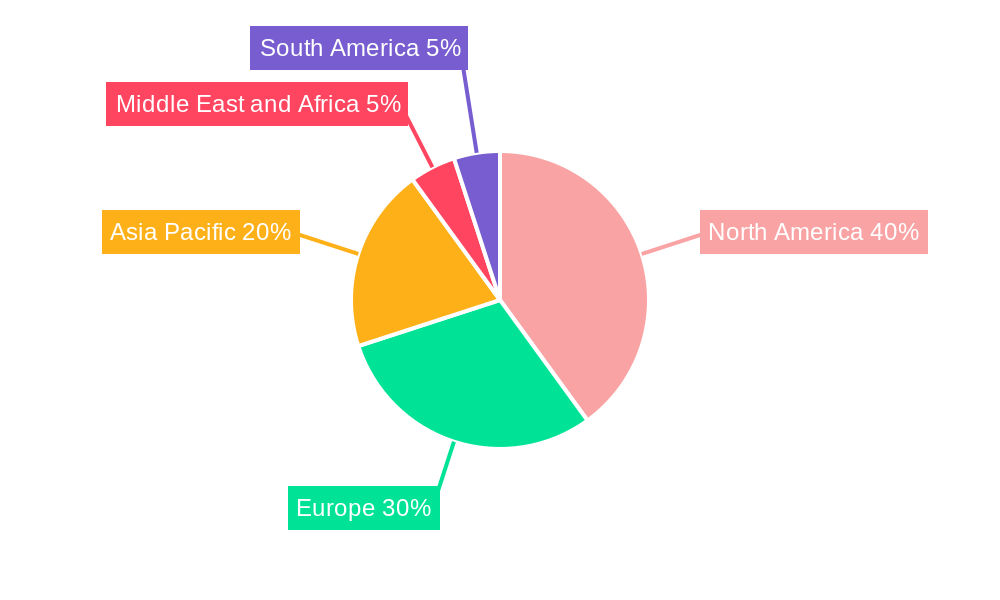
The global home infusion therapy market, valued at $24.40 billion in 2025, is projected to experience robust growth, driven by a rising geriatric population with chronic conditions requiring long-term infusion therapy, increasing prevalence of chronic diseases like cancer and diabetes, and advancements in infusion technologies leading to improved patient outcomes and convenience. The market's compound annual growth rate (CAGR) of 6.50% from 2025 to 2033 indicates substantial expansion. Key drivers include the increasing adoption of home healthcare services, which offer cost-effective alternatives to hospital stays, and the growing preference for convenient and personalized treatment options within the comfort of patients' homes. Technological advancements such as wireless monitoring systems and smart infusion pumps enhance patient safety and treatment efficacy, further bolstering market growth. Market segmentation reveals strong performance across various applications, including total parenteral nutrition, anti-infective therapy, and chemotherapy, with infusion pump sets, accessories, and consumables contributing significantly to the market value. Geographical analysis suggests North America and Europe currently hold significant market shares, driven by advanced healthcare infrastructure and high healthcare expenditure. However, Asia-Pacific is poised for significant growth due to expanding healthcare access and rising disposable incomes. Competition among key players, including Smiths Medical, ICU Medical Inc., and Fresenius Kabi, is intensifying, with companies focusing on product innovation, strategic partnerships, and geographical expansion to gain market share. Restraints include potential risks associated with home infusion therapy, the need for skilled healthcare professionals, and variations in regulatory frameworks across different regions.
The consistent growth trajectory projected through 2033 underscores the increasing reliance on home infusion therapy as a viable and efficient healthcare delivery model. This shift is fueled by factors such as improved patient adherence due to home-based treatment and the cost-effectiveness of reducing hospital stays. The market’s segmentation by product and application provides valuable insights into specific areas of growth and investment opportunities. Furthermore, understanding regional variations in growth trajectories allows stakeholders to strategize effectively for market penetration and expansion. Continuous advancements in technology, alongside increasing awareness about home infusion therapy among healthcare professionals and patients, will continue to propel the market forward, presenting lucrative prospects for industry participants.
Home Infusion Therapy Market: A Comprehensive Report (2019-2033)
This detailed report provides a comprehensive analysis of the Home Infusion Therapy market, offering valuable insights for stakeholders across the industry. With a study period spanning 2019-2033, a base year of 2025, and a forecast period of 2025-2033, this report offers actionable intelligence for strategic decision-making. The report covers key market segments, competitive dynamics, industry trends, and future growth projections, providing a holistic view of this rapidly evolving market. The market size is estimated to reach xx Million by 2025 and is projected to grow at a CAGR of xx% during the forecast period.
Home Infusion Therapy Market Market Structure & Competitive Dynamics
The Home Infusion Therapy market exhibits a moderately concentrated structure, with key players holding significant market share. Market concentration is driven by the presence of established multinational corporations alongside specialized regional providers. The competitive landscape is characterized by intense rivalry, fueled by ongoing product innovations, strategic partnerships, and mergers and acquisitions (M&A) activities. Recent M&A deals have involved significant investment, with values ranging from xx Million to xx Million, reflecting the industry's consolidation trend. Innovation ecosystems are largely driven by pharmaceutical companies collaborating with medical device manufacturers to develop advanced infusion systems. Regulatory frameworks, particularly FDA approvals in the US and equivalent regulations globally, heavily influence market dynamics. Product substitutes, such as oral medications, represent a competitive threat, although home infusion therapy often remains the preferred treatment option for certain conditions. End-user trends, including a growing preference for home-based care and an aging population, contribute to the market’s expansion.
- Market Concentration: Moderately concentrated, with top 5 players holding approximately xx% market share.
- Innovation Ecosystems: Strong collaborations between pharmaceutical and medical device companies.
- Regulatory Frameworks: Stringent regulations impacting product development and market entry.
- Product Substitutes: Oral medications present a competitive threat, but home infusion therapy remains crucial for specific treatments.
- End-User Trends: Aging population and preference for home healthcare are major growth drivers.
- M&A Activity: Significant M&A activity with deals valued between xx Million and xx Million in recent years.
Home Infusion Therapy Market Industry Trends & Insights
The Home Infusion Therapy market is experiencing robust growth, driven by several key factors. The increasing prevalence of chronic diseases requiring long-term infusion therapy, coupled with a rising preference for home-based healthcare, is fueling market expansion. Technological advancements, such as the development of smart infusion pumps and connected devices, are enhancing treatment efficacy and patient convenience. Consumer preferences are shifting towards personalized and convenient healthcare solutions, aligning perfectly with the benefits of home infusion therapy. The competitive dynamics within the market are characterized by intense innovation and strategic partnerships aimed at capturing market share. The market is experiencing a CAGR of xx%, with significant market penetration in developed regions.
Dominant Markets & Segments in Home Infusion Therapy Market
The North American region currently dominates the Home Infusion Therapy market, driven by high healthcare expenditure, advanced healthcare infrastructure, and a large patient population requiring infusion therapies. Within product segments, Infusion Pump Sets hold the largest market share due to their critical role in administering infusions. Applications-wise, Chemotherapy and IVIg/Specialty Pharmaceuticals segments demonstrate significant growth potential due to increasing incidences of cancer and autoimmune disorders.
- Key Drivers for North American Dominance:
- High healthcare expenditure
- Advanced healthcare infrastructure
- Large patient population requiring infusion therapy
- Favorable regulatory environment
- Dominant Product Segment: Infusion Pump Sets
- High-Growth Application Segments: Chemotherapy and IVIg/Specialty Pharmaceuticals
Home Infusion Therapy Market Product Innovations
Recent advancements in home infusion therapy have focused on enhancing safety, efficacy, and convenience. Smart infusion pumps with features such as drug library integration and remote monitoring capabilities are gaining traction. Disposable and pre-filled systems are reducing the risk of contamination and simplifying administration. These innovations are addressing market demands for improved patient outcomes and reduced healthcare costs. The integration of telehealth technologies further enhances the effectiveness and accessibility of home infusion therapy.
Report Segmentation & Scope
This report segments the Home Infusion Therapy market by product (Infusion Pump Sets, Accessories and Consumables) and application (Total Parenteral Nutrition, Anti-infective Therapy, Enteral Nutrition, Hydration Therapy, Chemotherapy, IVIg/Specialty Pharmaceuticals, Other Applications). Each segment's growth projections, market sizes, and competitive dynamics are comprehensively analyzed, offering a granular understanding of market opportunities. The market size for each segment is projected to grow significantly over the forecast period, driven by factors outlined earlier in the report.
Key Drivers of Home Infusion Therapy Market Growth
Several factors contribute to the growth of the Home Infusion Therapy market. Technological advancements leading to safer, more efficient, and convenient infusion systems are key. The rising prevalence of chronic diseases necessitates increased infusion therapy, driving market demand. Favorable regulatory environments supporting home healthcare further bolster market expansion. Economic factors, such as increasing healthcare spending in developed and emerging economies, contribute to market growth.
Challenges in the Home Infusion Therapy Market Sector
The Home Infusion Therapy market faces challenges, including stringent regulatory requirements for product approvals and reimbursement policies, potentially hindering market entry and slowing growth. Supply chain disruptions can impact the availability of essential components and devices, affecting treatment continuity. Intense competition among established players and emerging companies necessitates continuous innovation to maintain market share and profitability. These factors can potentially impact market growth and require strategic mitigation strategies.
Leading Players in the Home Infusion Therapy Market Market
- Smiths Medical
- ICU Medical Inc
- Community Surgical Supply
- Catholic Health Initiatives
- Fresenius Kabi
- Terumo Corporation
- Nipro Corporation
- Eli Lilly and Company
- McLaren Health Care
- Sutter Health
- Option Care Health Inc
- McKesson Medical-Surgical Inc
- B Braun Melsungen AG
- Baxter International
- Becton Dickinson and Companies
Key Developments in Home Infusion Therapy Market Sector
- September 2022: Baxter International Inc. received FDA 510(k) clearance for its new Novum IQ syringe infusion pump (SYR) with Dose IQ Safety Software.
- January 2023: KORU Medical Systems, Inc. entered into a development agreement to develop and seek regulatory approval for the Freedom Infusion System with a SCIg prefilled syringe.
Strategic Home Infusion Therapy Market Market Outlook
The Home Infusion Therapy market presents substantial growth potential driven by ongoing technological innovations, increasing demand for home-based healthcare, and expanding patient populations requiring infusion therapy. Strategic opportunities exist in developing innovative infusion systems, expanding into emerging markets, and forging strategic partnerships to enhance market reach and capture significant market share. Focus on personalized medicine and remote patient monitoring will further enhance market growth.
Home Infusion Therapy Market Segmentation
-
1. Product
- 1.1. Infusion Pump Sets
- 1.2. Accessories and Consumables
-
2. Applications
- 2.1. Total Parenteral Nutrition
- 2.2. Anti-infective Therapy
- 2.3. Enteral Nutrition
- 2.4. Hydration Therapy
- 2.5. Chemotherapy
- 2.6. IVIg/Specialty Pharmaceuticals
- 2.7. Other Applications
Home Infusion Therapy Market Segmentation By Geography
-
1. North America
- 1.1. United States
- 1.2. Canada
- 1.3. Mexico
-
2. Europe
- 2.1. Germany
- 2.2. United Kingdom
- 2.3. France
- 2.4. Italy
- 2.5. Spain
- 2.6. Rest of Europe
-
3. Asia Pacific
- 3.1. China
- 3.2. Japan
- 3.3. India
- 3.4. Australia
- 3.5. South Korea
- 3.6. Rest of Asia Pacific
-
4. Middle East and Africa
- 4.1. GCC
- 4.2. South Africa
- 4.3. Rest of Middle East and Africa
-
5. South America
- 5.1. Brazil
- 5.2. Argentina
- 5.3. Rest of South America
Home Infusion Therapy Market REPORT HIGHLIGHTS
| Aspects | Details |
|---|---|
| Study Period | 2019-2033 |
| Base Year | 2024 |
| Estimated Year | 2025 |
| Forecast Period | 2025-2033 |
| Historical Period | 2019-2024 |
| Growth Rate | CAGR of 6.50% from 2019-2033 |
| Segmentation |
|
Table of Contents
- 1. Introduction
- 1.1. Research Scope
- 1.2. Market Segmentation
- 1.3. Research Methodology
- 1.4. Definitions and Assumptions
- 2. Executive Summary
- 2.1. Introduction
- 3. Market Dynamics
- 3.1. Introduction
- 3.2. Market Drivers
- 3.2.1. Growing Number of Baby Boomers Suffering From Decreased Mobility; Growing Incidence of Hospital-acquired Infections; Increasing Adoption of Home Healthcare Coupled with Technological Advancements
- 3.3. Market Restrains
- 3.3.1. High Cost of Infusion Pumps; Safety Issues Associated with Infusion Pumps
- 3.4. Market Trends
- 3.4.1. Anti-infective Therapy Dominates the Home Infusion Therapy Market
- 4. Market Factor Analysis
- 4.1. Porters Five Forces
- 4.2. Supply/Value Chain
- 4.3. PESTEL analysis
- 4.4. Market Entropy
- 4.5. Patent/Trademark Analysis
- 5. Global Home Infusion Therapy Market Analysis, Insights and Forecast, 2019-2031
- 5.1. Market Analysis, Insights and Forecast - by Product
- 5.1.1. Infusion Pump Sets
- 5.1.2. Accessories and Consumables
- 5.2. Market Analysis, Insights and Forecast - by Applications
- 5.2.1. Total Parenteral Nutrition
- 5.2.2. Anti-infective Therapy
- 5.2.3. Enteral Nutrition
- 5.2.4. Hydration Therapy
- 5.2.5. Chemotherapy
- 5.2.6. IVIg/Specialty Pharmaceuticals
- 5.2.7. Other Applications
- 5.3. Market Analysis, Insights and Forecast - by Region
- 5.3.1. North America
- 5.3.2. Europe
- 5.3.3. Asia Pacific
- 5.3.4. Middle East and Africa
- 5.3.5. South America
- 5.1. Market Analysis, Insights and Forecast - by Product
- 6. North America Home Infusion Therapy Market Analysis, Insights and Forecast, 2019-2031
- 6.1. Market Analysis, Insights and Forecast - by Product
- 6.1.1. Infusion Pump Sets
- 6.1.2. Accessories and Consumables
- 6.2. Market Analysis, Insights and Forecast - by Applications
- 6.2.1. Total Parenteral Nutrition
- 6.2.2. Anti-infective Therapy
- 6.2.3. Enteral Nutrition
- 6.2.4. Hydration Therapy
- 6.2.5. Chemotherapy
- 6.2.6. IVIg/Specialty Pharmaceuticals
- 6.2.7. Other Applications
- 6.1. Market Analysis, Insights and Forecast - by Product
- 7. Europe Home Infusion Therapy Market Analysis, Insights and Forecast, 2019-2031
- 7.1. Market Analysis, Insights and Forecast - by Product
- 7.1.1. Infusion Pump Sets
- 7.1.2. Accessories and Consumables
- 7.2. Market Analysis, Insights and Forecast - by Applications
- 7.2.1. Total Parenteral Nutrition
- 7.2.2. Anti-infective Therapy
- 7.2.3. Enteral Nutrition
- 7.2.4. Hydration Therapy
- 7.2.5. Chemotherapy
- 7.2.6. IVIg/Specialty Pharmaceuticals
- 7.2.7. Other Applications
- 7.1. Market Analysis, Insights and Forecast - by Product
- 8. Asia Pacific Home Infusion Therapy Market Analysis, Insights and Forecast, 2019-2031
- 8.1. Market Analysis, Insights and Forecast - by Product
- 8.1.1. Infusion Pump Sets
- 8.1.2. Accessories and Consumables
- 8.2. Market Analysis, Insights and Forecast - by Applications
- 8.2.1. Total Parenteral Nutrition
- 8.2.2. Anti-infective Therapy
- 8.2.3. Enteral Nutrition
- 8.2.4. Hydration Therapy
- 8.2.5. Chemotherapy
- 8.2.6. IVIg/Specialty Pharmaceuticals
- 8.2.7. Other Applications
- 8.1. Market Analysis, Insights and Forecast - by Product
- 9. Middle East and Africa Home Infusion Therapy Market Analysis, Insights and Forecast, 2019-2031
- 9.1. Market Analysis, Insights and Forecast - by Product
- 9.1.1. Infusion Pump Sets
- 9.1.2. Accessories and Consumables
- 9.2. Market Analysis, Insights and Forecast - by Applications
- 9.2.1. Total Parenteral Nutrition
- 9.2.2. Anti-infective Therapy
- 9.2.3. Enteral Nutrition
- 9.2.4. Hydration Therapy
- 9.2.5. Chemotherapy
- 9.2.6. IVIg/Specialty Pharmaceuticals
- 9.2.7. Other Applications
- 9.1. Market Analysis, Insights and Forecast - by Product
- 10. South America Home Infusion Therapy Market Analysis, Insights and Forecast, 2019-2031
- 10.1. Market Analysis, Insights and Forecast - by Product
- 10.1.1. Infusion Pump Sets
- 10.1.2. Accessories and Consumables
- 10.2. Market Analysis, Insights and Forecast - by Applications
- 10.2.1. Total Parenteral Nutrition
- 10.2.2. Anti-infective Therapy
- 10.2.3. Enteral Nutrition
- 10.2.4. Hydration Therapy
- 10.2.5. Chemotherapy
- 10.2.6. IVIg/Specialty Pharmaceuticals
- 10.2.7. Other Applications
- 10.1. Market Analysis, Insights and Forecast - by Product
- 11. North America Home Infusion Therapy Market Analysis, Insights and Forecast, 2019-2031
- 11.1. Market Analysis, Insights and Forecast - By Country/Sub-region
- 11.1.1. undefined
- 12. Europe Home Infusion Therapy Market Analysis, Insights and Forecast, 2019-2031
- 12.1. Market Analysis, Insights and Forecast - By Country/Sub-region
- 12.1.1. undefined
- 13. Asia Pacific Home Infusion Therapy Market Analysis, Insights and Forecast, 2019-2031
- 13.1. Market Analysis, Insights and Forecast - By Country/Sub-region
- 13.1.1. undefined
- 14. Middle East and Africa Home Infusion Therapy Market Analysis, Insights and Forecast, 2019-2031
- 14.1. Market Analysis, Insights and Forecast - By Country/Sub-region
- 14.1.1. undefined
- 15. South America Home Infusion Therapy Market Analysis, Insights and Forecast, 2019-2031
- 15.1. Market Analysis, Insights and Forecast - By Country/Sub-region
- 15.1.1. undefined
- 16. Competitive Analysis
- 16.1. Global Market Share Analysis 2024
- 16.2. Company Profiles
- 16.2.1 Smiths Medical
- 16.2.1.1. Overview
- 16.2.1.2. Products
- 16.2.1.3. SWOT Analysis
- 16.2.1.4. Recent Developments
- 16.2.1.5. Financials (Based on Availability)
- 16.2.2 ICU Medical Inc
- 16.2.2.1. Overview
- 16.2.2.2. Products
- 16.2.2.3. SWOT Analysis
- 16.2.2.4. Recent Developments
- 16.2.2.5. Financials (Based on Availability)
- 16.2.3 Community Surgical Supply
- 16.2.3.1. Overview
- 16.2.3.2. Products
- 16.2.3.3. SWOT Analysis
- 16.2.3.4. Recent Developments
- 16.2.3.5. Financials (Based on Availability)
- 16.2.4 Catholic Health Initiatives
- 16.2.4.1. Overview
- 16.2.4.2. Products
- 16.2.4.3. SWOT Analysis
- 16.2.4.4. Recent Developments
- 16.2.4.5. Financials (Based on Availability)
- 16.2.5 Fresenius Kabi
- 16.2.5.1. Overview
- 16.2.5.2. Products
- 16.2.5.3. SWOT Analysis
- 16.2.5.4. Recent Developments
- 16.2.5.5. Financials (Based on Availability)
- 16.2.6 Terumo Corporation
- 16.2.6.1. Overview
- 16.2.6.2. Products
- 16.2.6.3. SWOT Analysis
- 16.2.6.4. Recent Developments
- 16.2.6.5. Financials (Based on Availability)
- 16.2.7 Nipro Corporation
- 16.2.7.1. Overview
- 16.2.7.2. Products
- 16.2.7.3. SWOT Analysis
- 16.2.7.4. Recent Developments
- 16.2.7.5. Financials (Based on Availability)
- 16.2.8 Eli Lilly and Company
- 16.2.8.1. Overview
- 16.2.8.2. Products
- 16.2.8.3. SWOT Analysis
- 16.2.8.4. Recent Developments
- 16.2.8.5. Financials (Based on Availability)
- 16.2.9 McLaren Health Care
- 16.2.9.1. Overview
- 16.2.9.2. Products
- 16.2.9.3. SWOT Analysis
- 16.2.9.4. Recent Developments
- 16.2.9.5. Financials (Based on Availability)
- 16.2.10 Sutter Health
- 16.2.10.1. Overview
- 16.2.10.2. Products
- 16.2.10.3. SWOT Analysis
- 16.2.10.4. Recent Developments
- 16.2.10.5. Financials (Based on Availability)
- 16.2.11 Option Care Health Inc
- 16.2.11.1. Overview
- 16.2.11.2. Products
- 16.2.11.3. SWOT Analysis
- 16.2.11.4. Recent Developments
- 16.2.11.5. Financials (Based on Availability)
- 16.2.12 McKesson Medical-Surgical Inc
- 16.2.12.1. Overview
- 16.2.12.2. Products
- 16.2.12.3. SWOT Analysis
- 16.2.12.4. Recent Developments
- 16.2.12.5. Financials (Based on Availability)
- 16.2.13 B Braun Melsungen AG
- 16.2.13.1. Overview
- 16.2.13.2. Products
- 16.2.13.3. SWOT Analysis
- 16.2.13.4. Recent Developments
- 16.2.13.5. Financials (Based on Availability)
- 16.2.14 Baxter International
- 16.2.14.1. Overview
- 16.2.14.2. Products
- 16.2.14.3. SWOT Analysis
- 16.2.14.4. Recent Developments
- 16.2.14.5. Financials (Based on Availability)
- 16.2.15 Becton Dickinson and Companies
- 16.2.15.1. Overview
- 16.2.15.2. Products
- 16.2.15.3. SWOT Analysis
- 16.2.15.4. Recent Developments
- 16.2.15.5. Financials (Based on Availability)
- 16.2.1 Smiths Medical
List of Figures
- Figure 1: Global Home Infusion Therapy Market Revenue Breakdown (Million, %) by Region 2024 & 2032
- Figure 2: Global Home Infusion Therapy Market Volume Breakdown (K Unit, %) by Region 2024 & 2032
- Figure 3: North America Home Infusion Therapy Market Revenue (Million), by Country 2024 & 2032
- Figure 4: North America Home Infusion Therapy Market Volume (K Unit), by Country 2024 & 2032
- Figure 5: North America Home Infusion Therapy Market Revenue Share (%), by Country 2024 & 2032
- Figure 6: North America Home Infusion Therapy Market Volume Share (%), by Country 2024 & 2032
- Figure 7: Europe Home Infusion Therapy Market Revenue (Million), by Country 2024 & 2032
- Figure 8: Europe Home Infusion Therapy Market Volume (K Unit), by Country 2024 & 2032
- Figure 9: Europe Home Infusion Therapy Market Revenue Share (%), by Country 2024 & 2032
- Figure 10: Europe Home Infusion Therapy Market Volume Share (%), by Country 2024 & 2032
- Figure 11: Asia Pacific Home Infusion Therapy Market Revenue (Million), by Country 2024 & 2032
- Figure 12: Asia Pacific Home Infusion Therapy Market Volume (K Unit), by Country 2024 & 2032
- Figure 13: Asia Pacific Home Infusion Therapy Market Revenue Share (%), by Country 2024 & 2032
- Figure 14: Asia Pacific Home Infusion Therapy Market Volume Share (%), by Country 2024 & 2032
- Figure 15: Middle East and Africa Home Infusion Therapy Market Revenue (Million), by Country 2024 & 2032
- Figure 16: Middle East and Africa Home Infusion Therapy Market Volume (K Unit), by Country 2024 & 2032
- Figure 17: Middle East and Africa Home Infusion Therapy Market Revenue Share (%), by Country 2024 & 2032
- Figure 18: Middle East and Africa Home Infusion Therapy Market Volume Share (%), by Country 2024 & 2032
- Figure 19: South America Home Infusion Therapy Market Revenue (Million), by Country 2024 & 2032
- Figure 20: South America Home Infusion Therapy Market Volume (K Unit), by Country 2024 & 2032
- Figure 21: South America Home Infusion Therapy Market Revenue Share (%), by Country 2024 & 2032
- Figure 22: South America Home Infusion Therapy Market Volume Share (%), by Country 2024 & 2032
- Figure 23: North America Home Infusion Therapy Market Revenue (Million), by Product 2024 & 2032
- Figure 24: North America Home Infusion Therapy Market Volume (K Unit), by Product 2024 & 2032
- Figure 25: North America Home Infusion Therapy Market Revenue Share (%), by Product 2024 & 2032
- Figure 26: North America Home Infusion Therapy Market Volume Share (%), by Product 2024 & 2032
- Figure 27: North America Home Infusion Therapy Market Revenue (Million), by Applications 2024 & 2032
- Figure 28: North America Home Infusion Therapy Market Volume (K Unit), by Applications 2024 & 2032
- Figure 29: North America Home Infusion Therapy Market Revenue Share (%), by Applications 2024 & 2032
- Figure 30: North America Home Infusion Therapy Market Volume Share (%), by Applications 2024 & 2032
- Figure 31: North America Home Infusion Therapy Market Revenue (Million), by Country 2024 & 2032
- Figure 32: North America Home Infusion Therapy Market Volume (K Unit), by Country 2024 & 2032
- Figure 33: North America Home Infusion Therapy Market Revenue Share (%), by Country 2024 & 2032
- Figure 34: North America Home Infusion Therapy Market Volume Share (%), by Country 2024 & 2032
- Figure 35: Europe Home Infusion Therapy Market Revenue (Million), by Product 2024 & 2032
- Figure 36: Europe Home Infusion Therapy Market Volume (K Unit), by Product 2024 & 2032
- Figure 37: Europe Home Infusion Therapy Market Revenue Share (%), by Product 2024 & 2032
- Figure 38: Europe Home Infusion Therapy Market Volume Share (%), by Product 2024 & 2032
- Figure 39: Europe Home Infusion Therapy Market Revenue (Million), by Applications 2024 & 2032
- Figure 40: Europe Home Infusion Therapy Market Volume (K Unit), by Applications 2024 & 2032
- Figure 41: Europe Home Infusion Therapy Market Revenue Share (%), by Applications 2024 & 2032
- Figure 42: Europe Home Infusion Therapy Market Volume Share (%), by Applications 2024 & 2032
- Figure 43: Europe Home Infusion Therapy Market Revenue (Million), by Country 2024 & 2032
- Figure 44: Europe Home Infusion Therapy Market Volume (K Unit), by Country 2024 & 2032
- Figure 45: Europe Home Infusion Therapy Market Revenue Share (%), by Country 2024 & 2032
- Figure 46: Europe Home Infusion Therapy Market Volume Share (%), by Country 2024 & 2032
- Figure 47: Asia Pacific Home Infusion Therapy Market Revenue (Million), by Product 2024 & 2032
- Figure 48: Asia Pacific Home Infusion Therapy Market Volume (K Unit), by Product 2024 & 2032
- Figure 49: Asia Pacific Home Infusion Therapy Market Revenue Share (%), by Product 2024 & 2032
- Figure 50: Asia Pacific Home Infusion Therapy Market Volume Share (%), by Product 2024 & 2032
- Figure 51: Asia Pacific Home Infusion Therapy Market Revenue (Million), by Applications 2024 & 2032
- Figure 52: Asia Pacific Home Infusion Therapy Market Volume (K Unit), by Applications 2024 & 2032
- Figure 53: Asia Pacific Home Infusion Therapy Market Revenue Share (%), by Applications 2024 & 2032
- Figure 54: Asia Pacific Home Infusion Therapy Market Volume Share (%), by Applications 2024 & 2032
- Figure 55: Asia Pacific Home Infusion Therapy Market Revenue (Million), by Country 2024 & 2032
- Figure 56: Asia Pacific Home Infusion Therapy Market Volume (K Unit), by Country 2024 & 2032
- Figure 57: Asia Pacific Home Infusion Therapy Market Revenue Share (%), by Country 2024 & 2032
- Figure 58: Asia Pacific Home Infusion Therapy Market Volume Share (%), by Country 2024 & 2032
- Figure 59: Middle East and Africa Home Infusion Therapy Market Revenue (Million), by Product 2024 & 2032
- Figure 60: Middle East and Africa Home Infusion Therapy Market Volume (K Unit), by Product 2024 & 2032
- Figure 61: Middle East and Africa Home Infusion Therapy Market Revenue Share (%), by Product 2024 & 2032
- Figure 62: Middle East and Africa Home Infusion Therapy Market Volume Share (%), by Product 2024 & 2032
- Figure 63: Middle East and Africa Home Infusion Therapy Market Revenue (Million), by Applications 2024 & 2032
- Figure 64: Middle East and Africa Home Infusion Therapy Market Volume (K Unit), by Applications 2024 & 2032
- Figure 65: Middle East and Africa Home Infusion Therapy Market Revenue Share (%), by Applications 2024 & 2032
- Figure 66: Middle East and Africa Home Infusion Therapy Market Volume Share (%), by Applications 2024 & 2032
- Figure 67: Middle East and Africa Home Infusion Therapy Market Revenue (Million), by Country 2024 & 2032
- Figure 68: Middle East and Africa Home Infusion Therapy Market Volume (K Unit), by Country 2024 & 2032
- Figure 69: Middle East and Africa Home Infusion Therapy Market Revenue Share (%), by Country 2024 & 2032
- Figure 70: Middle East and Africa Home Infusion Therapy Market Volume Share (%), by Country 2024 & 2032
- Figure 71: South America Home Infusion Therapy Market Revenue (Million), by Product 2024 & 2032
- Figure 72: South America Home Infusion Therapy Market Volume (K Unit), by Product 2024 & 2032
- Figure 73: South America Home Infusion Therapy Market Revenue Share (%), by Product 2024 & 2032
- Figure 74: South America Home Infusion Therapy Market Volume Share (%), by Product 2024 & 2032
- Figure 75: South America Home Infusion Therapy Market Revenue (Million), by Applications 2024 & 2032
- Figure 76: South America Home Infusion Therapy Market Volume (K Unit), by Applications 2024 & 2032
- Figure 77: South America Home Infusion Therapy Market Revenue Share (%), by Applications 2024 & 2032
- Figure 78: South America Home Infusion Therapy Market Volume Share (%), by Applications 2024 & 2032
- Figure 79: South America Home Infusion Therapy Market Revenue (Million), by Country 2024 & 2032
- Figure 80: South America Home Infusion Therapy Market Volume (K Unit), by Country 2024 & 2032
- Figure 81: South America Home Infusion Therapy Market Revenue Share (%), by Country 2024 & 2032
- Figure 82: South America Home Infusion Therapy Market Volume Share (%), by Country 2024 & 2032
List of Tables
- Table 1: Global Home Infusion Therapy Market Revenue Million Forecast, by Region 2019 & 2032
- Table 2: Global Home Infusion Therapy Market Volume K Unit Forecast, by Region 2019 & 2032
- Table 3: Global Home Infusion Therapy Market Revenue Million Forecast, by Product 2019 & 2032
- Table 4: Global Home Infusion Therapy Market Volume K Unit Forecast, by Product 2019 & 2032
- Table 5: Global Home Infusion Therapy Market Revenue Million Forecast, by Applications 2019 & 2032
- Table 6: Global Home Infusion Therapy Market Volume K Unit Forecast, by Applications 2019 & 2032
- Table 7: Global Home Infusion Therapy Market Revenue Million Forecast, by Region 2019 & 2032
- Table 8: Global Home Infusion Therapy Market Volume K Unit Forecast, by Region 2019 & 2032
- Table 9: Global Home Infusion Therapy Market Revenue Million Forecast, by Country 2019 & 2032
- Table 10: Global Home Infusion Therapy Market Volume K Unit Forecast, by Country 2019 & 2032
- Table 11: Global Home Infusion Therapy Market Revenue Million Forecast, by Country 2019 & 2032
- Table 12: Global Home Infusion Therapy Market Volume K Unit Forecast, by Country 2019 & 2032
- Table 13: Global Home Infusion Therapy Market Revenue Million Forecast, by Country 2019 & 2032
- Table 14: Global Home Infusion Therapy Market Volume K Unit Forecast, by Country 2019 & 2032
- Table 15: Global Home Infusion Therapy Market Revenue Million Forecast, by Country 2019 & 2032
- Table 16: Global Home Infusion Therapy Market Volume K Unit Forecast, by Country 2019 & 2032
- Table 17: Global Home Infusion Therapy Market Revenue Million Forecast, by Country 2019 & 2032
- Table 18: Global Home Infusion Therapy Market Volume K Unit Forecast, by Country 2019 & 2032
- Table 19: Global Home Infusion Therapy Market Revenue Million Forecast, by Product 2019 & 2032
- Table 20: Global Home Infusion Therapy Market Volume K Unit Forecast, by Product 2019 & 2032
- Table 21: Global Home Infusion Therapy Market Revenue Million Forecast, by Applications 2019 & 2032
- Table 22: Global Home Infusion Therapy Market Volume K Unit Forecast, by Applications 2019 & 2032
- Table 23: Global Home Infusion Therapy Market Revenue Million Forecast, by Country 2019 & 2032
- Table 24: Global Home Infusion Therapy Market Volume K Unit Forecast, by Country 2019 & 2032
- Table 25: United States Home Infusion Therapy Market Revenue (Million) Forecast, by Application 2019 & 2032
- Table 26: United States Home Infusion Therapy Market Volume (K Unit) Forecast, by Application 2019 & 2032
- Table 27: Canada Home Infusion Therapy Market Revenue (Million) Forecast, by Application 2019 & 2032
- Table 28: Canada Home Infusion Therapy Market Volume (K Unit) Forecast, by Application 2019 & 2032
- Table 29: Mexico Home Infusion Therapy Market Revenue (Million) Forecast, by Application 2019 & 2032
- Table 30: Mexico Home Infusion Therapy Market Volume (K Unit) Forecast, by Application 2019 & 2032
- Table 31: Global Home Infusion Therapy Market Revenue Million Forecast, by Product 2019 & 2032
- Table 32: Global Home Infusion Therapy Market Volume K Unit Forecast, by Product 2019 & 2032
- Table 33: Global Home Infusion Therapy Market Revenue Million Forecast, by Applications 2019 & 2032
- Table 34: Global Home Infusion Therapy Market Volume K Unit Forecast, by Applications 2019 & 2032
- Table 35: Global Home Infusion Therapy Market Revenue Million Forecast, by Country 2019 & 2032
- Table 36: Global Home Infusion Therapy Market Volume K Unit Forecast, by Country 2019 & 2032
- Table 37: Germany Home Infusion Therapy Market Revenue (Million) Forecast, by Application 2019 & 2032
- Table 38: Germany Home Infusion Therapy Market Volume (K Unit) Forecast, by Application 2019 & 2032
- Table 39: United Kingdom Home Infusion Therapy Market Revenue (Million) Forecast, by Application 2019 & 2032
- Table 40: United Kingdom Home Infusion Therapy Market Volume (K Unit) Forecast, by Application 2019 & 2032
- Table 41: France Home Infusion Therapy Market Revenue (Million) Forecast, by Application 2019 & 2032
- Table 42: France Home Infusion Therapy Market Volume (K Unit) Forecast, by Application 2019 & 2032
- Table 43: Italy Home Infusion Therapy Market Revenue (Million) Forecast, by Application 2019 & 2032
- Table 44: Italy Home Infusion Therapy Market Volume (K Unit) Forecast, by Application 2019 & 2032
- Table 45: Spain Home Infusion Therapy Market Revenue (Million) Forecast, by Application 2019 & 2032
- Table 46: Spain Home Infusion Therapy Market Volume (K Unit) Forecast, by Application 2019 & 2032
- Table 47: Rest of Europe Home Infusion Therapy Market Revenue (Million) Forecast, by Application 2019 & 2032
- Table 48: Rest of Europe Home Infusion Therapy Market Volume (K Unit) Forecast, by Application 2019 & 2032
- Table 49: Global Home Infusion Therapy Market Revenue Million Forecast, by Product 2019 & 2032
- Table 50: Global Home Infusion Therapy Market Volume K Unit Forecast, by Product 2019 & 2032
- Table 51: Global Home Infusion Therapy Market Revenue Million Forecast, by Applications 2019 & 2032
- Table 52: Global Home Infusion Therapy Market Volume K Unit Forecast, by Applications 2019 & 2032
- Table 53: Global Home Infusion Therapy Market Revenue Million Forecast, by Country 2019 & 2032
- Table 54: Global Home Infusion Therapy Market Volume K Unit Forecast, by Country 2019 & 2032
- Table 55: China Home Infusion Therapy Market Revenue (Million) Forecast, by Application 2019 & 2032
- Table 56: China Home Infusion Therapy Market Volume (K Unit) Forecast, by Application 2019 & 2032
- Table 57: Japan Home Infusion Therapy Market Revenue (Million) Forecast, by Application 2019 & 2032
- Table 58: Japan Home Infusion Therapy Market Volume (K Unit) Forecast, by Application 2019 & 2032
- Table 59: India Home Infusion Therapy Market Revenue (Million) Forecast, by Application 2019 & 2032
- Table 60: India Home Infusion Therapy Market Volume (K Unit) Forecast, by Application 2019 & 2032
- Table 61: Australia Home Infusion Therapy Market Revenue (Million) Forecast, by Application 2019 & 2032
- Table 62: Australia Home Infusion Therapy Market Volume (K Unit) Forecast, by Application 2019 & 2032
- Table 63: South Korea Home Infusion Therapy Market Revenue (Million) Forecast, by Application 2019 & 2032
- Table 64: South Korea Home Infusion Therapy Market Volume (K Unit) Forecast, by Application 2019 & 2032
- Table 65: Rest of Asia Pacific Home Infusion Therapy Market Revenue (Million) Forecast, by Application 2019 & 2032
- Table 66: Rest of Asia Pacific Home Infusion Therapy Market Volume (K Unit) Forecast, by Application 2019 & 2032
- Table 67: Global Home Infusion Therapy Market Revenue Million Forecast, by Product 2019 & 2032
- Table 68: Global Home Infusion Therapy Market Volume K Unit Forecast, by Product 2019 & 2032
- Table 69: Global Home Infusion Therapy Market Revenue Million Forecast, by Applications 2019 & 2032
- Table 70: Global Home Infusion Therapy Market Volume K Unit Forecast, by Applications 2019 & 2032
- Table 71: Global Home Infusion Therapy Market Revenue Million Forecast, by Country 2019 & 2032
- Table 72: Global Home Infusion Therapy Market Volume K Unit Forecast, by Country 2019 & 2032
- Table 73: GCC Home Infusion Therapy Market Revenue (Million) Forecast, by Application 2019 & 2032
- Table 74: GCC Home Infusion Therapy Market Volume (K Unit) Forecast, by Application 2019 & 2032
- Table 75: South Africa Home Infusion Therapy Market Revenue (Million) Forecast, by Application 2019 & 2032
- Table 76: South Africa Home Infusion Therapy Market Volume (K Unit) Forecast, by Application 2019 & 2032
- Table 77: Rest of Middle East and Africa Home Infusion Therapy Market Revenue (Million) Forecast, by Application 2019 & 2032
- Table 78: Rest of Middle East and Africa Home Infusion Therapy Market Volume (K Unit) Forecast, by Application 2019 & 2032
- Table 79: Global Home Infusion Therapy Market Revenue Million Forecast, by Product 2019 & 2032
- Table 80: Global Home Infusion Therapy Market Volume K Unit Forecast, by Product 2019 & 2032
- Table 81: Global Home Infusion Therapy Market Revenue Million Forecast, by Applications 2019 & 2032
- Table 82: Global Home Infusion Therapy Market Volume K Unit Forecast, by Applications 2019 & 2032
- Table 83: Global Home Infusion Therapy Market Revenue Million Forecast, by Country 2019 & 2032
- Table 84: Global Home Infusion Therapy Market Volume K Unit Forecast, by Country 2019 & 2032
- Table 85: Brazil Home Infusion Therapy Market Revenue (Million) Forecast, by Application 2019 & 2032
- Table 86: Brazil Home Infusion Therapy Market Volume (K Unit) Forecast, by Application 2019 & 2032
- Table 87: Argentina Home Infusion Therapy Market Revenue (Million) Forecast, by Application 2019 & 2032
- Table 88: Argentina Home Infusion Therapy Market Volume (K Unit) Forecast, by Application 2019 & 2032
- Table 89: Rest of South America Home Infusion Therapy Market Revenue (Million) Forecast, by Application 2019 & 2032
- Table 90: Rest of South America Home Infusion Therapy Market Volume (K Unit) Forecast, by Application 2019 & 2032
Frequently Asked Questions
1. What is the projected Compound Annual Growth Rate (CAGR) of the Home Infusion Therapy Market?
The projected CAGR is approximately 6.50%.
2. Which companies are prominent players in the Home Infusion Therapy Market?
Key companies in the market include Smiths Medical, ICU Medical Inc, Community Surgical Supply, Catholic Health Initiatives, Fresenius Kabi, Terumo Corporation, Nipro Corporation, Eli Lilly and Company, McLaren Health Care, Sutter Health, Option Care Health Inc, McKesson Medical-Surgical Inc, B Braun Melsungen AG, Baxter International, Becton Dickinson and Companies.
3. What are the main segments of the Home Infusion Therapy Market?
The market segments include Product, Applications.
4. Can you provide details about the market size?
The market size is estimated to be USD 24.40 Million as of 2022.
5. What are some drivers contributing to market growth?
Growing Number of Baby Boomers Suffering From Decreased Mobility; Growing Incidence of Hospital-acquired Infections; Increasing Adoption of Home Healthcare Coupled with Technological Advancements.
6. What are the notable trends driving market growth?
Anti-infective Therapy Dominates the Home Infusion Therapy Market.
7. Are there any restraints impacting market growth?
High Cost of Infusion Pumps; Safety Issues Associated with Infusion Pumps.
8. Can you provide examples of recent developments in the market?
January 2023: KORU Medical Systems, Inc. entered into a development agreement with a pharmaceutical manufacturer of subcutaneous immunoglobulin therapy (SCIg) to develop and seek regulatory approval for the Freedom Infusion System with a SCIg prefilled syringe. The Freedom Infusion System currently includes the Freddom60 and FreedomEdge Syringe Infusion Drivers, Precision Flow Rate Tubing, and HIgH-Flo Subcutaneous Safety Needle Sets. These devices are used for infusions administered in the home and alternate care settings.
9. What pricing options are available for accessing the report?
Pricing options include single-user, multi-user, and enterprise licenses priced at USD 4750, USD 5250, and USD 8750 respectively.
10. Is the market size provided in terms of value or volume?
The market size is provided in terms of value, measured in Million and volume, measured in K Unit.
11. Are there any specific market keywords associated with the report?
Yes, the market keyword associated with the report is "Home Infusion Therapy Market," which aids in identifying and referencing the specific market segment covered.
12. How do I determine which pricing option suits my needs best?
The pricing options vary based on user requirements and access needs. Individual users may opt for single-user licenses, while businesses requiring broader access may choose multi-user or enterprise licenses for cost-effective access to the report.
13. Are there any additional resources or data provided in the Home Infusion Therapy Market report?
While the report offers comprehensive insights, it's advisable to review the specific contents or supplementary materials provided to ascertain if additional resources or data are available.
14. How can I stay updated on further developments or reports in the Home Infusion Therapy Market?
To stay informed about further developments, trends, and reports in the Home Infusion Therapy Market, consider subscribing to industry newsletters, following relevant companies and organizations, or regularly checking reputable industry news sources and publications.
Methodology
Step 1 - Identification of Relevant Samples Size from Population Database


Step 2 - Approaches for Defining Global Market Size (Value, Volume* & Price*)

Note*: In applicable scenarios
Step 3 - Data Sources
Primary Research
- Web Analytics
- Survey Reports
- Research Institute
- Latest Research Reports
- Opinion Leaders
Secondary Research
- Annual Reports
- White Paper
- Latest Press Release
- Industry Association
- Paid Database
- Investor Presentations

Step 4 - Data Triangulation
Involves using different sources of information in order to increase the validity of a study
These sources are likely to be stakeholders in a program - participants, other researchers, program staff, other community members, and so on.
Then we put all data in single framework & apply various statistical tools to find out the dynamic on the market.
During the analysis stage, feedback from the stakeholder groups would be compared to determine areas of agreement as well as areas of divergence


