
Key Insights
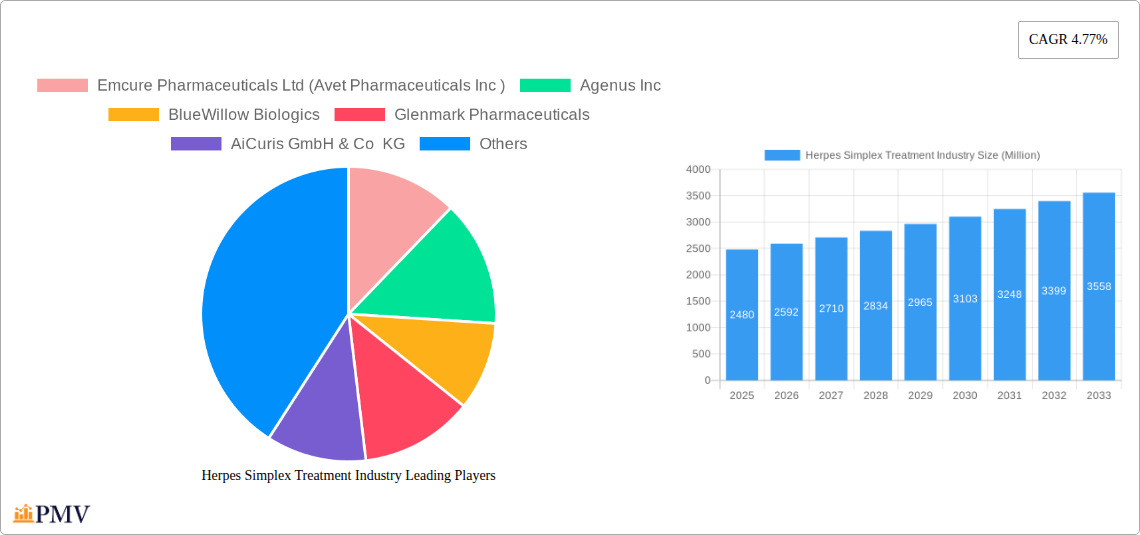
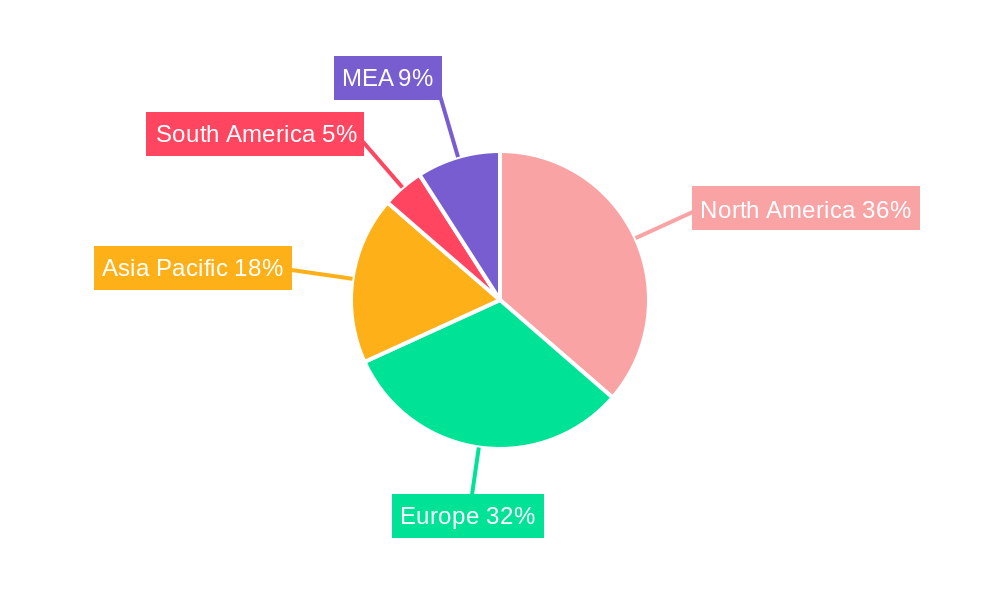
The global Herpes Simplex Treatment market, valued at $2.48 billion in 2025, is projected to experience robust growth, driven by increasing prevalence of herpes simplex virus (HSV) infections, rising awareness about available treatments, and advancements in antiviral therapies. The market's Compound Annual Growth Rate (CAGR) of 4.77% from 2025 to 2033 indicates a significant expansion, propelled by factors such as improved diagnostics, increased healthcare spending, and growing geriatric populations, who are more susceptible to HSV infections. The oral route of administration currently dominates the market due to its convenience and ease of use, although advancements in topical and injectable formulations are expected to contribute to segment growth over the forecast period. Acyclovir, valacyclovir, and famciclovir remain the leading antiviral drugs, although the "Other Drugs" segment, encompassing newer and potentially more effective treatments, holds promising growth potential fueled by ongoing research and development in this area. Geographic analysis reveals strong market presence in North America and Europe, driven by higher healthcare expenditure and established healthcare infrastructure. However, the Asia-Pacific region is expected to showcase significant growth potential in the coming years, driven by rising awareness, expanding healthcare access, and increasing disposable incomes. Competition within the market is intense, with major pharmaceutical companies like GlaxoSmithKline, Novartis, and Teva Pharmaceuticals vying for market share alongside smaller, specialized players focusing on innovative treatment approaches.
The market faces certain restraints, primarily concerning the chronic nature of HSV infections requiring long-term treatment, along with potential side effects associated with antiviral medications. Furthermore, the high cost of treatment can limit accessibility, especially in developing regions. However, the ongoing research into novel therapies, including potential vaccines and more targeted antiviral agents, could overcome these challenges and further stimulate market growth. The development of more effective and convenient treatment options, along with targeted marketing campaigns to increase awareness and reduce stigma surrounding HSV infections, are crucial factors for future market expansion. The continued investment in research and development is expected to drive the innovation of new therapeutic approaches, ultimately shaping the future landscape of the Herpes Simplex Treatment market.
Herpes Simplex Treatment Industry: A Comprehensive Market Report (2019-2033)
This comprehensive report provides a detailed analysis of the Herpes Simplex Treatment industry, offering invaluable insights for stakeholders, investors, and industry professionals. With a focus on market dynamics, competitive landscapes, and future growth projections, this report covers the period from 2019 to 2033, with a base year of 2025 and a forecast period of 2025-2033. The report analyzes the market valued at $XX Million in 2025, projected to reach $XX Million by 2033, exhibiting a CAGR of XX% during the forecast period.
Herpes Simplex Treatment Industry Market Structure & Competitive Dynamics
The Herpes Simplex Treatment market is characterized by a moderately concentrated structure, with several multinational pharmaceutical companies holding significant market share. The industry is witnessing increased innovation, driven by the need for more effective and convenient treatment options. Regulatory frameworks, such as those set by the FDA and EMA, play a crucial role in shaping product development and market entry. Generic competition is significant, impacting pricing and profitability. The market also faces competition from alternative therapies and home remedies. Mergers and acquisitions (M&A) activity has been moderate, with deal values varying from $XX Million to $XX Million in recent years, driven by the desire for companies to expand their product portfolios and gain market share. Key players are focused on developing novel therapies and improving existing treatment options.
- Market Concentration: Moderately Concentrated. Top 5 players hold approximately XX% of market share.
- Innovation Ecosystem: Active, with ongoing R&D efforts focused on novel drug delivery systems and therapeutic approaches.
- Regulatory Landscape: Stringent regulations govern drug approval and market access.
- M&A Activity: Moderate activity with deal values ranging from $XX Million to $XX Million in the last five years. Examples include: (Specific examples to be added based on available data).
- Product Substitutes: Over-the-counter remedies and alternative treatments pose a competitive threat.
- End-User Trends: Increasing awareness of Herpes Simplex and a growing demand for convenient and effective treatment are driving market growth.
Herpes Simplex Treatment Industry Industry Trends & Insights
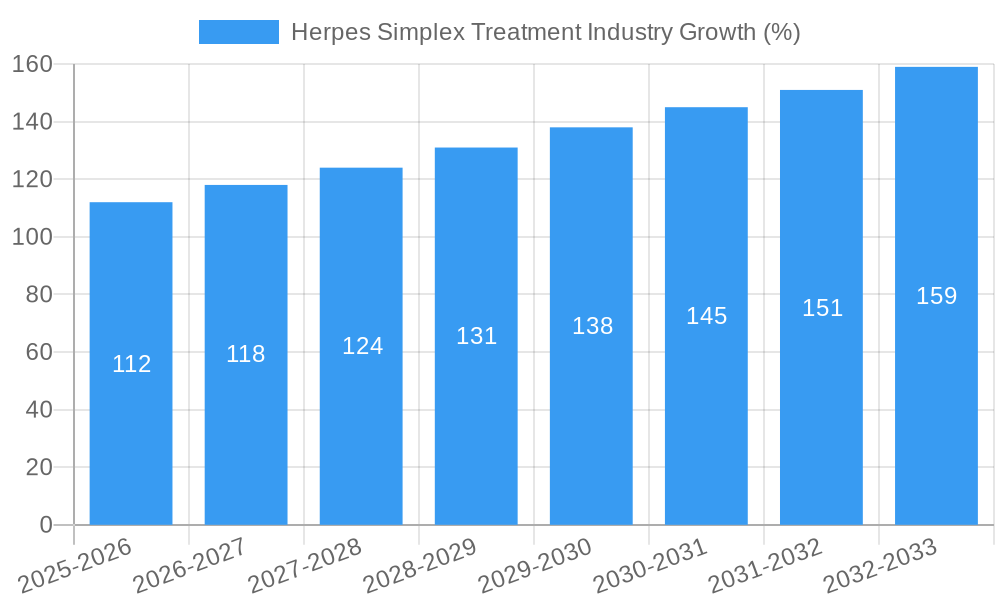
The Herpes Simplex Treatment market is experiencing steady growth driven by factors including rising prevalence of herpes simplex virus infections, growing awareness of treatment options, and increasing investments in R&D. Technological advancements, such as novel drug delivery systems and gene therapy approaches, are expected to significantly impact market dynamics. Consumer preferences are shifting towards more convenient oral formulations and improved efficacy. The competitive landscape is characterized by intense rivalry among established pharmaceutical companies and emerging biotech firms. This competition is pushing innovation and driving down treatment costs. The global market is segmented by drug type (Acyclovir, Valacyclovir, Famciclovir, Other Drugs) and route of administration (Oral, Injection, Topical). The oral segment is expected to dominate, driven by convenience and ease of use. The market has been growing at a CAGR of XX% from 2019 to 2024. This growth is expected to continue in the coming years, although at a slightly lower rate. Market penetration is highest in developed countries, with significant opportunities for growth in emerging markets.
Dominant Markets & Segments in Herpes Simplex Treatment Industry
The North American region dominates the Herpes Simplex Treatment market, driven by high prevalence of HSV infections, robust healthcare infrastructure, and high per capita healthcare spending. Within this region, the United States holds the largest share. By drug type, Acyclovir is the most dominant segment due to its long-standing use and established efficacy, representing approximately XX% of the market in 2025. The oral route of administration segment holds the largest market share, driven by patient preference for ease of use.
- Key Drivers of North American Market Dominance:
- High prevalence of HSV infections.
- Advanced healthcare infrastructure and access to treatment.
- High per capita healthcare spending.
- Stringent regulatory environment driving innovation.
- Dominant Drug Segment: Acyclovir (XX% market share in 2025).
- Dominant Route of Administration: Oral (XX% market share in 2025).
Herpes Simplex Treatment Industry Product Innovations
Recent advancements in the Herpes Simplex Treatment industry include the development of novel drug formulations with improved bioavailability and reduced side effects. There's also been progress in gene therapy, offering potential for long-term disease management. These innovations are addressing unmet needs in the market, such as improved efficacy and reduced treatment frequency. Furthermore, the development of combination therapies and targeted drug delivery systems is enhancing treatment outcomes.
Report Segmentation & Scope
This report segments the Herpes Simplex Treatment market by drug type (Acyclovir, Valacyclovir, Famciclovir, Other Drugs) and route of administration (Oral, Injection, Topical).
By Drug: Acyclovir, Valacyclovir, and Famciclovir are the leading drugs, with each expected to maintain significant growth throughout the forecast period. The "Other Drugs" segment includes newer therapies and experimental drugs in development, representing a considerable opportunity for future growth.
By Route of Administration: The Oral segment dominates due to its convenience and ease of use. The Topical and Injection segments are expected to see modest growth, driven by the need for localized treatment in some cases and efficacy improvements. Competitive dynamics vary within each segment, influenced by factors such as pricing, brand recognition, and efficacy.
Key Drivers of Herpes Simplex Treatment Industry Growth
The growth of the Herpes Simplex Treatment market is fueled by several factors. These include the rising prevalence of herpes simplex infections, increasing awareness about treatment options, advancements in drug development leading to more effective therapies, and the expanding healthcare infrastructure in developing nations. Favorable regulatory frameworks also support market expansion, encouraging R&D and facilitating product approvals. Government initiatives focused on public health also contribute positively to market growth.
Challenges in the Herpes Simplex Treatment Industry Sector
The Herpes Simplex Treatment industry faces several challenges, including the high cost of new drug development and the risk of generic competition, impacting profitability. Stringent regulatory pathways and approval processes can lead to delays in market entry. Supply chain disruptions and fluctuating raw material prices also pose threats to the industry. Furthermore, the development of drug resistance remains a concern. These factors can impact production costs, efficacy, and market accessibility.
Leading Players in the Herpes Simplex Treatment Industry Market
- Emcure Pharmaceuticals Ltd (Avet Pharmaceuticals Inc)
- Agenus Inc
- BlueWillow Biologics
- Glenmark Pharmaceuticals
- AiCuris GmbH & Co KG
- Viatris Inc
- Teva Pharmaceuticals Industries Ltd
- Fresenius SE & Co KGaA
- Novartis AG
- Carlsbad Tech
- Zydus Group
- Apotex Inc
- GlaxoSmithKline PLC
Key Developments in Herpes Simplex Treatment Industry Sector
October 2022: Replay launches Eudora, an HSV gene therapy company leveraging its synHSV delivery vector. This signifies a significant advancement in gene therapy approaches for HSV-related diseases.
August 2022: Rational Vaccines initiates a clinical trial to determine baseline characteristics of recurrent symptomatic HSV type 2 patients in the UK. This underscores the focus on developing novel therapeutic vaccines for herpes.
Strategic Herpes Simplex Treatment Industry Market Outlook
The Herpes Simplex Treatment market presents substantial growth potential over the next decade. Ongoing research and development efforts are likely to yield new and improved therapies, further expanding market opportunities. Strategic partnerships and collaborations among pharmaceutical companies and research institutions will play a vital role in accelerating innovation and driving market growth. Expanding into emerging markets and focusing on personalized medicine approaches will also create significant business opportunities. The focus on novel drug delivery systems and gene therapy holds significant promise for the future.
Herpes Simplex Treatment Industry Segmentation
-
1. Drug
- 1.1. Acyclovir
- 1.2. Valacyclovir
- 1.3. Famciclovir
- 1.4. Other Drugs
-
2. Route of Administration
- 2.1. Oral
- 2.2. Injection
- 2.3. Topical
Herpes Simplex Treatment Industry Segmentation By Geography
-
1. North America
- 1.1. United States
- 1.2. Canada
- 1.3. Mexico
-
2. Europe
- 2.1. United Kingdom
- 2.2. Germany
- 2.3. France
- 2.4. Italy
- 2.5. Spain
- 2.6. Rest of Europe
-
3. Asia Pacific
- 3.1. China
- 3.2. Japan
- 3.3. India
- 3.4. Australia
- 3.5. South Korea
- 3.6. Rest of Asia Pacific
- 4. Rest of the World
Herpes Simplex Treatment Industry REPORT HIGHLIGHTS
| Aspects | Details |
|---|---|
| Study Period | 2019-2033 |
| Base Year | 2024 |
| Estimated Year | 2025 |
| Forecast Period | 2025-2033 |
| Historical Period | 2019-2024 |
| Growth Rate | CAGR of 4.77% from 2019-2033 |
| Segmentation |
|
Table of Contents
- 1. Introduction
- 1.1. Research Scope
- 1.2. Market Segmentation
- 1.3. Research Methodology
- 1.4. Definitions and Assumptions
- 2. Executive Summary
- 2.1. Introduction
- 3. Market Dynamics
- 3.1. Introduction
- 3.2. Market Drivers
- 3.2.1. Growing Burden of Herpes Simplex Virus Infections; Increasing R&D Activities
- 3.3. Market Restrains
- 3.3.1 Social Stigma Associated with Sexually Transmitted Diseases
- 3.3.2 Coupled with Rising Product Recalls
- 3.4. Market Trends
- 3.4.1. Acyclovir Segment is Expected to Hold a Significant Market Share in the Herpes Simplex Virus Treatment Market
- 4. Market Factor Analysis
- 4.1. Porters Five Forces
- 4.2. Supply/Value Chain
- 4.3. PESTEL analysis
- 4.4. Market Entropy
- 4.5. Patent/Trademark Analysis
- 5. Global Herpes Simplex Treatment Industry Analysis, Insights and Forecast, 2019-2031
- 5.1. Market Analysis, Insights and Forecast - by Drug
- 5.1.1. Acyclovir
- 5.1.2. Valacyclovir
- 5.1.3. Famciclovir
- 5.1.4. Other Drugs
- 5.2. Market Analysis, Insights and Forecast - by Route of Administration
- 5.2.1. Oral
- 5.2.2. Injection
- 5.2.3. Topical
- 5.3. Market Analysis, Insights and Forecast - by Region
- 5.3.1. North America
- 5.3.2. Europe
- 5.3.3. Asia Pacific
- 5.3.4. Rest of the World
- 5.1. Market Analysis, Insights and Forecast - by Drug
- 6. North America Herpes Simplex Treatment Industry Analysis, Insights and Forecast, 2019-2031
- 6.1. Market Analysis, Insights and Forecast - by Drug
- 6.1.1. Acyclovir
- 6.1.2. Valacyclovir
- 6.1.3. Famciclovir
- 6.1.4. Other Drugs
- 6.2. Market Analysis, Insights and Forecast - by Route of Administration
- 6.2.1. Oral
- 6.2.2. Injection
- 6.2.3. Topical
- 6.1. Market Analysis, Insights and Forecast - by Drug
- 7. Europe Herpes Simplex Treatment Industry Analysis, Insights and Forecast, 2019-2031
- 7.1. Market Analysis, Insights and Forecast - by Drug
- 7.1.1. Acyclovir
- 7.1.2. Valacyclovir
- 7.1.3. Famciclovir
- 7.1.4. Other Drugs
- 7.2. Market Analysis, Insights and Forecast - by Route of Administration
- 7.2.1. Oral
- 7.2.2. Injection
- 7.2.3. Topical
- 7.1. Market Analysis, Insights and Forecast - by Drug
- 8. Asia Pacific Herpes Simplex Treatment Industry Analysis, Insights and Forecast, 2019-2031
- 8.1. Market Analysis, Insights and Forecast - by Drug
- 8.1.1. Acyclovir
- 8.1.2. Valacyclovir
- 8.1.3. Famciclovir
- 8.1.4. Other Drugs
- 8.2. Market Analysis, Insights and Forecast - by Route of Administration
- 8.2.1. Oral
- 8.2.2. Injection
- 8.2.3. Topical
- 8.1. Market Analysis, Insights and Forecast - by Drug
- 9. Rest of the World Herpes Simplex Treatment Industry Analysis, Insights and Forecast, 2019-2031
- 9.1. Market Analysis, Insights and Forecast - by Drug
- 9.1.1. Acyclovir
- 9.1.2. Valacyclovir
- 9.1.3. Famciclovir
- 9.1.4. Other Drugs
- 9.2. Market Analysis, Insights and Forecast - by Route of Administration
- 9.2.1. Oral
- 9.2.2. Injection
- 9.2.3. Topical
- 9.1. Market Analysis, Insights and Forecast - by Drug
- 10. North America Herpes Simplex Treatment Industry Analysis, Insights and Forecast, 2019-2031
- 10.1. Market Analysis, Insights and Forecast - By Country/Sub-region
- 10.1.1 United States
- 10.1.2 Canada
- 10.1.3 Mexico
- 11. Europe Herpes Simplex Treatment Industry Analysis, Insights and Forecast, 2019-2031
- 11.1. Market Analysis, Insights and Forecast - By Country/Sub-region
- 11.1.1 Germany
- 11.1.2 United Kingdom
- 11.1.3 France
- 11.1.4 Spain
- 11.1.5 Italy
- 11.1.6 Spain
- 11.1.7 Belgium
- 11.1.8 Netherland
- 11.1.9 Nordics
- 11.1.10 Rest of Europe
- 12. Asia Pacific Herpes Simplex Treatment Industry Analysis, Insights and Forecast, 2019-2031
- 12.1. Market Analysis, Insights and Forecast - By Country/Sub-region
- 12.1.1 China
- 12.1.2 Japan
- 12.1.3 India
- 12.1.4 South Korea
- 12.1.5 Southeast Asia
- 12.1.6 Australia
- 12.1.7 Indonesia
- 12.1.8 Phillipes
- 12.1.9 Singapore
- 12.1.10 Thailandc
- 12.1.11 Rest of Asia Pacific
- 13. South America Herpes Simplex Treatment Industry Analysis, Insights and Forecast, 2019-2031
- 13.1. Market Analysis, Insights and Forecast - By Country/Sub-region
- 13.1.1 Brazil
- 13.1.2 Argentina
- 13.1.3 Peru
- 13.1.4 Chile
- 13.1.5 Colombia
- 13.1.6 Ecuador
- 13.1.7 Venezuela
- 13.1.8 Rest of South America
- 14. North America Herpes Simplex Treatment Industry Analysis, Insights and Forecast, 2019-2031
- 14.1. Market Analysis, Insights and Forecast - By Country/Sub-region
- 14.1.1 United States
- 14.1.2 Canada
- 14.1.3 Mexico
- 15. MEA Herpes Simplex Treatment Industry Analysis, Insights and Forecast, 2019-2031
- 15.1. Market Analysis, Insights and Forecast - By Country/Sub-region
- 15.1.1 United Arab Emirates
- 15.1.2 Saudi Arabia
- 15.1.3 South Africa
- 15.1.4 Rest of Middle East and Africa
- 16. Competitive Analysis
- 16.1. Global Market Share Analysis 2024
- 16.2. Company Profiles
- 16.2.1 Emcure Pharmaceuticals Ltd (Avet Pharmaceuticals Inc )
- 16.2.1.1. Overview
- 16.2.1.2. Products
- 16.2.1.3. SWOT Analysis
- 16.2.1.4. Recent Developments
- 16.2.1.5. Financials (Based on Availability)
- 16.2.2 Agenus Inc
- 16.2.2.1. Overview
- 16.2.2.2. Products
- 16.2.2.3. SWOT Analysis
- 16.2.2.4. Recent Developments
- 16.2.2.5. Financials (Based on Availability)
- 16.2.3 BlueWillow Biologics
- 16.2.3.1. Overview
- 16.2.3.2. Products
- 16.2.3.3. SWOT Analysis
- 16.2.3.4. Recent Developments
- 16.2.3.5. Financials (Based on Availability)
- 16.2.4 Glenmark Pharmaceuticals
- 16.2.4.1. Overview
- 16.2.4.2. Products
- 16.2.4.3. SWOT Analysis
- 16.2.4.4. Recent Developments
- 16.2.4.5. Financials (Based on Availability)
- 16.2.5 AiCuris GmbH & Co KG
- 16.2.5.1. Overview
- 16.2.5.2. Products
- 16.2.5.3. SWOT Analysis
- 16.2.5.4. Recent Developments
- 16.2.5.5. Financials (Based on Availability)
- 16.2.6 Viatris Inc
- 16.2.6.1. Overview
- 16.2.6.2. Products
- 16.2.6.3. SWOT Analysis
- 16.2.6.4. Recent Developments
- 16.2.6.5. Financials (Based on Availability)
- 16.2.7 Teva Pharmaceuticals Industries Ltd
- 16.2.7.1. Overview
- 16.2.7.2. Products
- 16.2.7.3. SWOT Analysis
- 16.2.7.4. Recent Developments
- 16.2.7.5. Financials (Based on Availability)
- 16.2.8 Fresenius SE & Co KGaA
- 16.2.8.1. Overview
- 16.2.8.2. Products
- 16.2.8.3. SWOT Analysis
- 16.2.8.4. Recent Developments
- 16.2.8.5. Financials (Based on Availability)
- 16.2.9 Novartis AG
- 16.2.9.1. Overview
- 16.2.9.2. Products
- 16.2.9.3. SWOT Analysis
- 16.2.9.4. Recent Developments
- 16.2.9.5. Financials (Based on Availability)
- 16.2.10 Carlsbad Tech
- 16.2.10.1. Overview
- 16.2.10.2. Products
- 16.2.10.3. SWOT Analysis
- 16.2.10.4. Recent Developments
- 16.2.10.5. Financials (Based on Availability)
- 16.2.11 Zydus Group
- 16.2.11.1. Overview
- 16.2.11.2. Products
- 16.2.11.3. SWOT Analysis
- 16.2.11.4. Recent Developments
- 16.2.11.5. Financials (Based on Availability)
- 16.2.12 Apotex Inc
- 16.2.12.1. Overview
- 16.2.12.2. Products
- 16.2.12.3. SWOT Analysis
- 16.2.12.4. Recent Developments
- 16.2.12.5. Financials (Based on Availability)
- 16.2.13 GlaxoSmithKline PLC
- 16.2.13.1. Overview
- 16.2.13.2. Products
- 16.2.13.3. SWOT Analysis
- 16.2.13.4. Recent Developments
- 16.2.13.5. Financials (Based on Availability)
- 16.2.1 Emcure Pharmaceuticals Ltd (Avet Pharmaceuticals Inc )
List of Figures
- Figure 1: Global Herpes Simplex Treatment Industry Revenue Breakdown (Million, %) by Region 2024 & 2032
- Figure 2: Global Herpes Simplex Treatment Industry Volume Breakdown (K Unit, %) by Region 2024 & 2032
- Figure 3: North America Herpes Simplex Treatment Industry Revenue (Million), by Country 2024 & 2032
- Figure 4: North America Herpes Simplex Treatment Industry Volume (K Unit), by Country 2024 & 2032
- Figure 5: North America Herpes Simplex Treatment Industry Revenue Share (%), by Country 2024 & 2032
- Figure 6: North America Herpes Simplex Treatment Industry Volume Share (%), by Country 2024 & 2032
- Figure 7: Europe Herpes Simplex Treatment Industry Revenue (Million), by Country 2024 & 2032
- Figure 8: Europe Herpes Simplex Treatment Industry Volume (K Unit), by Country 2024 & 2032
- Figure 9: Europe Herpes Simplex Treatment Industry Revenue Share (%), by Country 2024 & 2032
- Figure 10: Europe Herpes Simplex Treatment Industry Volume Share (%), by Country 2024 & 2032
- Figure 11: Asia Pacific Herpes Simplex Treatment Industry Revenue (Million), by Country 2024 & 2032
- Figure 12: Asia Pacific Herpes Simplex Treatment Industry Volume (K Unit), by Country 2024 & 2032
- Figure 13: Asia Pacific Herpes Simplex Treatment Industry Revenue Share (%), by Country 2024 & 2032
- Figure 14: Asia Pacific Herpes Simplex Treatment Industry Volume Share (%), by Country 2024 & 2032
- Figure 15: South America Herpes Simplex Treatment Industry Revenue (Million), by Country 2024 & 2032
- Figure 16: South America Herpes Simplex Treatment Industry Volume (K Unit), by Country 2024 & 2032
- Figure 17: South America Herpes Simplex Treatment Industry Revenue Share (%), by Country 2024 & 2032
- Figure 18: South America Herpes Simplex Treatment Industry Volume Share (%), by Country 2024 & 2032
- Figure 19: North America Herpes Simplex Treatment Industry Revenue (Million), by Country 2024 & 2032
- Figure 20: North America Herpes Simplex Treatment Industry Volume (K Unit), by Country 2024 & 2032
- Figure 21: North America Herpes Simplex Treatment Industry Revenue Share (%), by Country 2024 & 2032
- Figure 22: North America Herpes Simplex Treatment Industry Volume Share (%), by Country 2024 & 2032
- Figure 23: MEA Herpes Simplex Treatment Industry Revenue (Million), by Country 2024 & 2032
- Figure 24: MEA Herpes Simplex Treatment Industry Volume (K Unit), by Country 2024 & 2032
- Figure 25: MEA Herpes Simplex Treatment Industry Revenue Share (%), by Country 2024 & 2032
- Figure 26: MEA Herpes Simplex Treatment Industry Volume Share (%), by Country 2024 & 2032
- Figure 27: North America Herpes Simplex Treatment Industry Revenue (Million), by Drug 2024 & 2032
- Figure 28: North America Herpes Simplex Treatment Industry Volume (K Unit), by Drug 2024 & 2032
- Figure 29: North America Herpes Simplex Treatment Industry Revenue Share (%), by Drug 2024 & 2032
- Figure 30: North America Herpes Simplex Treatment Industry Volume Share (%), by Drug 2024 & 2032
- Figure 31: North America Herpes Simplex Treatment Industry Revenue (Million), by Route of Administration 2024 & 2032
- Figure 32: North America Herpes Simplex Treatment Industry Volume (K Unit), by Route of Administration 2024 & 2032
- Figure 33: North America Herpes Simplex Treatment Industry Revenue Share (%), by Route of Administration 2024 & 2032
- Figure 34: North America Herpes Simplex Treatment Industry Volume Share (%), by Route of Administration 2024 & 2032
- Figure 35: North America Herpes Simplex Treatment Industry Revenue (Million), by Country 2024 & 2032
- Figure 36: North America Herpes Simplex Treatment Industry Volume (K Unit), by Country 2024 & 2032
- Figure 37: North America Herpes Simplex Treatment Industry Revenue Share (%), by Country 2024 & 2032
- Figure 38: North America Herpes Simplex Treatment Industry Volume Share (%), by Country 2024 & 2032
- Figure 39: Europe Herpes Simplex Treatment Industry Revenue (Million), by Drug 2024 & 2032
- Figure 40: Europe Herpes Simplex Treatment Industry Volume (K Unit), by Drug 2024 & 2032
- Figure 41: Europe Herpes Simplex Treatment Industry Revenue Share (%), by Drug 2024 & 2032
- Figure 42: Europe Herpes Simplex Treatment Industry Volume Share (%), by Drug 2024 & 2032
- Figure 43: Europe Herpes Simplex Treatment Industry Revenue (Million), by Route of Administration 2024 & 2032
- Figure 44: Europe Herpes Simplex Treatment Industry Volume (K Unit), by Route of Administration 2024 & 2032
- Figure 45: Europe Herpes Simplex Treatment Industry Revenue Share (%), by Route of Administration 2024 & 2032
- Figure 46: Europe Herpes Simplex Treatment Industry Volume Share (%), by Route of Administration 2024 & 2032
- Figure 47: Europe Herpes Simplex Treatment Industry Revenue (Million), by Country 2024 & 2032
- Figure 48: Europe Herpes Simplex Treatment Industry Volume (K Unit), by Country 2024 & 2032
- Figure 49: Europe Herpes Simplex Treatment Industry Revenue Share (%), by Country 2024 & 2032
- Figure 50: Europe Herpes Simplex Treatment Industry Volume Share (%), by Country 2024 & 2032
- Figure 51: Asia Pacific Herpes Simplex Treatment Industry Revenue (Million), by Drug 2024 & 2032
- Figure 52: Asia Pacific Herpes Simplex Treatment Industry Volume (K Unit), by Drug 2024 & 2032
- Figure 53: Asia Pacific Herpes Simplex Treatment Industry Revenue Share (%), by Drug 2024 & 2032
- Figure 54: Asia Pacific Herpes Simplex Treatment Industry Volume Share (%), by Drug 2024 & 2032
- Figure 55: Asia Pacific Herpes Simplex Treatment Industry Revenue (Million), by Route of Administration 2024 & 2032
- Figure 56: Asia Pacific Herpes Simplex Treatment Industry Volume (K Unit), by Route of Administration 2024 & 2032
- Figure 57: Asia Pacific Herpes Simplex Treatment Industry Revenue Share (%), by Route of Administration 2024 & 2032
- Figure 58: Asia Pacific Herpes Simplex Treatment Industry Volume Share (%), by Route of Administration 2024 & 2032
- Figure 59: Asia Pacific Herpes Simplex Treatment Industry Revenue (Million), by Country 2024 & 2032
- Figure 60: Asia Pacific Herpes Simplex Treatment Industry Volume (K Unit), by Country 2024 & 2032
- Figure 61: Asia Pacific Herpes Simplex Treatment Industry Revenue Share (%), by Country 2024 & 2032
- Figure 62: Asia Pacific Herpes Simplex Treatment Industry Volume Share (%), by Country 2024 & 2032
- Figure 63: Rest of the World Herpes Simplex Treatment Industry Revenue (Million), by Drug 2024 & 2032
- Figure 64: Rest of the World Herpes Simplex Treatment Industry Volume (K Unit), by Drug 2024 & 2032
- Figure 65: Rest of the World Herpes Simplex Treatment Industry Revenue Share (%), by Drug 2024 & 2032
- Figure 66: Rest of the World Herpes Simplex Treatment Industry Volume Share (%), by Drug 2024 & 2032
- Figure 67: Rest of the World Herpes Simplex Treatment Industry Revenue (Million), by Route of Administration 2024 & 2032
- Figure 68: Rest of the World Herpes Simplex Treatment Industry Volume (K Unit), by Route of Administration 2024 & 2032
- Figure 69: Rest of the World Herpes Simplex Treatment Industry Revenue Share (%), by Route of Administration 2024 & 2032
- Figure 70: Rest of the World Herpes Simplex Treatment Industry Volume Share (%), by Route of Administration 2024 & 2032
- Figure 71: Rest of the World Herpes Simplex Treatment Industry Revenue (Million), by Country 2024 & 2032
- Figure 72: Rest of the World Herpes Simplex Treatment Industry Volume (K Unit), by Country 2024 & 2032
- Figure 73: Rest of the World Herpes Simplex Treatment Industry Revenue Share (%), by Country 2024 & 2032
- Figure 74: Rest of the World Herpes Simplex Treatment Industry Volume Share (%), by Country 2024 & 2032
List of Tables
- Table 1: Global Herpes Simplex Treatment Industry Revenue Million Forecast, by Region 2019 & 2032
- Table 2: Global Herpes Simplex Treatment Industry Volume K Unit Forecast, by Region 2019 & 2032
- Table 3: Global Herpes Simplex Treatment Industry Revenue Million Forecast, by Drug 2019 & 2032
- Table 4: Global Herpes Simplex Treatment Industry Volume K Unit Forecast, by Drug 2019 & 2032
- Table 5: Global Herpes Simplex Treatment Industry Revenue Million Forecast, by Route of Administration 2019 & 2032
- Table 6: Global Herpes Simplex Treatment Industry Volume K Unit Forecast, by Route of Administration 2019 & 2032
- Table 7: Global Herpes Simplex Treatment Industry Revenue Million Forecast, by Region 2019 & 2032
- Table 8: Global Herpes Simplex Treatment Industry Volume K Unit Forecast, by Region 2019 & 2032
- Table 9: Global Herpes Simplex Treatment Industry Revenue Million Forecast, by Country 2019 & 2032
- Table 10: Global Herpes Simplex Treatment Industry Volume K Unit Forecast, by Country 2019 & 2032
- Table 11: United States Herpes Simplex Treatment Industry Revenue (Million) Forecast, by Application 2019 & 2032
- Table 12: United States Herpes Simplex Treatment Industry Volume (K Unit) Forecast, by Application 2019 & 2032
- Table 13: Canada Herpes Simplex Treatment Industry Revenue (Million) Forecast, by Application 2019 & 2032
- Table 14: Canada Herpes Simplex Treatment Industry Volume (K Unit) Forecast, by Application 2019 & 2032
- Table 15: Mexico Herpes Simplex Treatment Industry Revenue (Million) Forecast, by Application 2019 & 2032
- Table 16: Mexico Herpes Simplex Treatment Industry Volume (K Unit) Forecast, by Application 2019 & 2032
- Table 17: Global Herpes Simplex Treatment Industry Revenue Million Forecast, by Country 2019 & 2032
- Table 18: Global Herpes Simplex Treatment Industry Volume K Unit Forecast, by Country 2019 & 2032
- Table 19: Germany Herpes Simplex Treatment Industry Revenue (Million) Forecast, by Application 2019 & 2032
- Table 20: Germany Herpes Simplex Treatment Industry Volume (K Unit) Forecast, by Application 2019 & 2032
- Table 21: United Kingdom Herpes Simplex Treatment Industry Revenue (Million) Forecast, by Application 2019 & 2032
- Table 22: United Kingdom Herpes Simplex Treatment Industry Volume (K Unit) Forecast, by Application 2019 & 2032
- Table 23: France Herpes Simplex Treatment Industry Revenue (Million) Forecast, by Application 2019 & 2032
- Table 24: France Herpes Simplex Treatment Industry Volume (K Unit) Forecast, by Application 2019 & 2032
- Table 25: Spain Herpes Simplex Treatment Industry Revenue (Million) Forecast, by Application 2019 & 2032
- Table 26: Spain Herpes Simplex Treatment Industry Volume (K Unit) Forecast, by Application 2019 & 2032
- Table 27: Italy Herpes Simplex Treatment Industry Revenue (Million) Forecast, by Application 2019 & 2032
- Table 28: Italy Herpes Simplex Treatment Industry Volume (K Unit) Forecast, by Application 2019 & 2032
- Table 29: Spain Herpes Simplex Treatment Industry Revenue (Million) Forecast, by Application 2019 & 2032
- Table 30: Spain Herpes Simplex Treatment Industry Volume (K Unit) Forecast, by Application 2019 & 2032
- Table 31: Belgium Herpes Simplex Treatment Industry Revenue (Million) Forecast, by Application 2019 & 2032
- Table 32: Belgium Herpes Simplex Treatment Industry Volume (K Unit) Forecast, by Application 2019 & 2032
- Table 33: Netherland Herpes Simplex Treatment Industry Revenue (Million) Forecast, by Application 2019 & 2032
- Table 34: Netherland Herpes Simplex Treatment Industry Volume (K Unit) Forecast, by Application 2019 & 2032
- Table 35: Nordics Herpes Simplex Treatment Industry Revenue (Million) Forecast, by Application 2019 & 2032
- Table 36: Nordics Herpes Simplex Treatment Industry Volume (K Unit) Forecast, by Application 2019 & 2032
- Table 37: Rest of Europe Herpes Simplex Treatment Industry Revenue (Million) Forecast, by Application 2019 & 2032
- Table 38: Rest of Europe Herpes Simplex Treatment Industry Volume (K Unit) Forecast, by Application 2019 & 2032
- Table 39: Global Herpes Simplex Treatment Industry Revenue Million Forecast, by Country 2019 & 2032
- Table 40: Global Herpes Simplex Treatment Industry Volume K Unit Forecast, by Country 2019 & 2032
- Table 41: China Herpes Simplex Treatment Industry Revenue (Million) Forecast, by Application 2019 & 2032
- Table 42: China Herpes Simplex Treatment Industry Volume (K Unit) Forecast, by Application 2019 & 2032
- Table 43: Japan Herpes Simplex Treatment Industry Revenue (Million) Forecast, by Application 2019 & 2032
- Table 44: Japan Herpes Simplex Treatment Industry Volume (K Unit) Forecast, by Application 2019 & 2032
- Table 45: India Herpes Simplex Treatment Industry Revenue (Million) Forecast, by Application 2019 & 2032
- Table 46: India Herpes Simplex Treatment Industry Volume (K Unit) Forecast, by Application 2019 & 2032
- Table 47: South Korea Herpes Simplex Treatment Industry Revenue (Million) Forecast, by Application 2019 & 2032
- Table 48: South Korea Herpes Simplex Treatment Industry Volume (K Unit) Forecast, by Application 2019 & 2032
- Table 49: Southeast Asia Herpes Simplex Treatment Industry Revenue (Million) Forecast, by Application 2019 & 2032
- Table 50: Southeast Asia Herpes Simplex Treatment Industry Volume (K Unit) Forecast, by Application 2019 & 2032
- Table 51: Australia Herpes Simplex Treatment Industry Revenue (Million) Forecast, by Application 2019 & 2032
- Table 52: Australia Herpes Simplex Treatment Industry Volume (K Unit) Forecast, by Application 2019 & 2032
- Table 53: Indonesia Herpes Simplex Treatment Industry Revenue (Million) Forecast, by Application 2019 & 2032
- Table 54: Indonesia Herpes Simplex Treatment Industry Volume (K Unit) Forecast, by Application 2019 & 2032
- Table 55: Phillipes Herpes Simplex Treatment Industry Revenue (Million) Forecast, by Application 2019 & 2032
- Table 56: Phillipes Herpes Simplex Treatment Industry Volume (K Unit) Forecast, by Application 2019 & 2032
- Table 57: Singapore Herpes Simplex Treatment Industry Revenue (Million) Forecast, by Application 2019 & 2032
- Table 58: Singapore Herpes Simplex Treatment Industry Volume (K Unit) Forecast, by Application 2019 & 2032
- Table 59: Thailandc Herpes Simplex Treatment Industry Revenue (Million) Forecast, by Application 2019 & 2032
- Table 60: Thailandc Herpes Simplex Treatment Industry Volume (K Unit) Forecast, by Application 2019 & 2032
- Table 61: Rest of Asia Pacific Herpes Simplex Treatment Industry Revenue (Million) Forecast, by Application 2019 & 2032
- Table 62: Rest of Asia Pacific Herpes Simplex Treatment Industry Volume (K Unit) Forecast, by Application 2019 & 2032
- Table 63: Global Herpes Simplex Treatment Industry Revenue Million Forecast, by Country 2019 & 2032
- Table 64: Global Herpes Simplex Treatment Industry Volume K Unit Forecast, by Country 2019 & 2032
- Table 65: Brazil Herpes Simplex Treatment Industry Revenue (Million) Forecast, by Application 2019 & 2032
- Table 66: Brazil Herpes Simplex Treatment Industry Volume (K Unit) Forecast, by Application 2019 & 2032
- Table 67: Argentina Herpes Simplex Treatment Industry Revenue (Million) Forecast, by Application 2019 & 2032
- Table 68: Argentina Herpes Simplex Treatment Industry Volume (K Unit) Forecast, by Application 2019 & 2032
- Table 69: Peru Herpes Simplex Treatment Industry Revenue (Million) Forecast, by Application 2019 & 2032
- Table 70: Peru Herpes Simplex Treatment Industry Volume (K Unit) Forecast, by Application 2019 & 2032
- Table 71: Chile Herpes Simplex Treatment Industry Revenue (Million) Forecast, by Application 2019 & 2032
- Table 72: Chile Herpes Simplex Treatment Industry Volume (K Unit) Forecast, by Application 2019 & 2032
- Table 73: Colombia Herpes Simplex Treatment Industry Revenue (Million) Forecast, by Application 2019 & 2032
- Table 74: Colombia Herpes Simplex Treatment Industry Volume (K Unit) Forecast, by Application 2019 & 2032
- Table 75: Ecuador Herpes Simplex Treatment Industry Revenue (Million) Forecast, by Application 2019 & 2032
- Table 76: Ecuador Herpes Simplex Treatment Industry Volume (K Unit) Forecast, by Application 2019 & 2032
- Table 77: Venezuela Herpes Simplex Treatment Industry Revenue (Million) Forecast, by Application 2019 & 2032
- Table 78: Venezuela Herpes Simplex Treatment Industry Volume (K Unit) Forecast, by Application 2019 & 2032
- Table 79: Rest of South America Herpes Simplex Treatment Industry Revenue (Million) Forecast, by Application 2019 & 2032
- Table 80: Rest of South America Herpes Simplex Treatment Industry Volume (K Unit) Forecast, by Application 2019 & 2032
- Table 81: Global Herpes Simplex Treatment Industry Revenue Million Forecast, by Country 2019 & 2032
- Table 82: Global Herpes Simplex Treatment Industry Volume K Unit Forecast, by Country 2019 & 2032
- Table 83: United States Herpes Simplex Treatment Industry Revenue (Million) Forecast, by Application 2019 & 2032
- Table 84: United States Herpes Simplex Treatment Industry Volume (K Unit) Forecast, by Application 2019 & 2032
- Table 85: Canada Herpes Simplex Treatment Industry Revenue (Million) Forecast, by Application 2019 & 2032
- Table 86: Canada Herpes Simplex Treatment Industry Volume (K Unit) Forecast, by Application 2019 & 2032
- Table 87: Mexico Herpes Simplex Treatment Industry Revenue (Million) Forecast, by Application 2019 & 2032
- Table 88: Mexico Herpes Simplex Treatment Industry Volume (K Unit) Forecast, by Application 2019 & 2032
- Table 89: Global Herpes Simplex Treatment Industry Revenue Million Forecast, by Country 2019 & 2032
- Table 90: Global Herpes Simplex Treatment Industry Volume K Unit Forecast, by Country 2019 & 2032
- Table 91: United Arab Emirates Herpes Simplex Treatment Industry Revenue (Million) Forecast, by Application 2019 & 2032
- Table 92: United Arab Emirates Herpes Simplex Treatment Industry Volume (K Unit) Forecast, by Application 2019 & 2032
- Table 93: Saudi Arabia Herpes Simplex Treatment Industry Revenue (Million) Forecast, by Application 2019 & 2032
- Table 94: Saudi Arabia Herpes Simplex Treatment Industry Volume (K Unit) Forecast, by Application 2019 & 2032
- Table 95: South Africa Herpes Simplex Treatment Industry Revenue (Million) Forecast, by Application 2019 & 2032
- Table 96: South Africa Herpes Simplex Treatment Industry Volume (K Unit) Forecast, by Application 2019 & 2032
- Table 97: Rest of Middle East and Africa Herpes Simplex Treatment Industry Revenue (Million) Forecast, by Application 2019 & 2032
- Table 98: Rest of Middle East and Africa Herpes Simplex Treatment Industry Volume (K Unit) Forecast, by Application 2019 & 2032
- Table 99: Global Herpes Simplex Treatment Industry Revenue Million Forecast, by Drug 2019 & 2032
- Table 100: Global Herpes Simplex Treatment Industry Volume K Unit Forecast, by Drug 2019 & 2032
- Table 101: Global Herpes Simplex Treatment Industry Revenue Million Forecast, by Route of Administration 2019 & 2032
- Table 102: Global Herpes Simplex Treatment Industry Volume K Unit Forecast, by Route of Administration 2019 & 2032
- Table 103: Global Herpes Simplex Treatment Industry Revenue Million Forecast, by Country 2019 & 2032
- Table 104: Global Herpes Simplex Treatment Industry Volume K Unit Forecast, by Country 2019 & 2032
- Table 105: United States Herpes Simplex Treatment Industry Revenue (Million) Forecast, by Application 2019 & 2032
- Table 106: United States Herpes Simplex Treatment Industry Volume (K Unit) Forecast, by Application 2019 & 2032
- Table 107: Canada Herpes Simplex Treatment Industry Revenue (Million) Forecast, by Application 2019 & 2032
- Table 108: Canada Herpes Simplex Treatment Industry Volume (K Unit) Forecast, by Application 2019 & 2032
- Table 109: Mexico Herpes Simplex Treatment Industry Revenue (Million) Forecast, by Application 2019 & 2032
- Table 110: Mexico Herpes Simplex Treatment Industry Volume (K Unit) Forecast, by Application 2019 & 2032
- Table 111: Global Herpes Simplex Treatment Industry Revenue Million Forecast, by Drug 2019 & 2032
- Table 112: Global Herpes Simplex Treatment Industry Volume K Unit Forecast, by Drug 2019 & 2032
- Table 113: Global Herpes Simplex Treatment Industry Revenue Million Forecast, by Route of Administration 2019 & 2032
- Table 114: Global Herpes Simplex Treatment Industry Volume K Unit Forecast, by Route of Administration 2019 & 2032
- Table 115: Global Herpes Simplex Treatment Industry Revenue Million Forecast, by Country 2019 & 2032
- Table 116: Global Herpes Simplex Treatment Industry Volume K Unit Forecast, by Country 2019 & 2032
- Table 117: United Kingdom Herpes Simplex Treatment Industry Revenue (Million) Forecast, by Application 2019 & 2032
- Table 118: United Kingdom Herpes Simplex Treatment Industry Volume (K Unit) Forecast, by Application 2019 & 2032
- Table 119: Germany Herpes Simplex Treatment Industry Revenue (Million) Forecast, by Application 2019 & 2032
- Table 120: Germany Herpes Simplex Treatment Industry Volume (K Unit) Forecast, by Application 2019 & 2032
- Table 121: France Herpes Simplex Treatment Industry Revenue (Million) Forecast, by Application 2019 & 2032
- Table 122: France Herpes Simplex Treatment Industry Volume (K Unit) Forecast, by Application 2019 & 2032
- Table 123: Italy Herpes Simplex Treatment Industry Revenue (Million) Forecast, by Application 2019 & 2032
- Table 124: Italy Herpes Simplex Treatment Industry Volume (K Unit) Forecast, by Application 2019 & 2032
- Table 125: Spain Herpes Simplex Treatment Industry Revenue (Million) Forecast, by Application 2019 & 2032
- Table 126: Spain Herpes Simplex Treatment Industry Volume (K Unit) Forecast, by Application 2019 & 2032
- Table 127: Rest of Europe Herpes Simplex Treatment Industry Revenue (Million) Forecast, by Application 2019 & 2032
- Table 128: Rest of Europe Herpes Simplex Treatment Industry Volume (K Unit) Forecast, by Application 2019 & 2032
- Table 129: Global Herpes Simplex Treatment Industry Revenue Million Forecast, by Drug 2019 & 2032
- Table 130: Global Herpes Simplex Treatment Industry Volume K Unit Forecast, by Drug 2019 & 2032
- Table 131: Global Herpes Simplex Treatment Industry Revenue Million Forecast, by Route of Administration 2019 & 2032
- Table 132: Global Herpes Simplex Treatment Industry Volume K Unit Forecast, by Route of Administration 2019 & 2032
- Table 133: Global Herpes Simplex Treatment Industry Revenue Million Forecast, by Country 2019 & 2032
- Table 134: Global Herpes Simplex Treatment Industry Volume K Unit Forecast, by Country 2019 & 2032
- Table 135: China Herpes Simplex Treatment Industry Revenue (Million) Forecast, by Application 2019 & 2032
- Table 136: China Herpes Simplex Treatment Industry Volume (K Unit) Forecast, by Application 2019 & 2032
- Table 137: Japan Herpes Simplex Treatment Industry Revenue (Million) Forecast, by Application 2019 & 2032
- Table 138: Japan Herpes Simplex Treatment Industry Volume (K Unit) Forecast, by Application 2019 & 2032
- Table 139: India Herpes Simplex Treatment Industry Revenue (Million) Forecast, by Application 2019 & 2032
- Table 140: India Herpes Simplex Treatment Industry Volume (K Unit) Forecast, by Application 2019 & 2032
- Table 141: Australia Herpes Simplex Treatment Industry Revenue (Million) Forecast, by Application 2019 & 2032
- Table 142: Australia Herpes Simplex Treatment Industry Volume (K Unit) Forecast, by Application 2019 & 2032
- Table 143: South Korea Herpes Simplex Treatment Industry Revenue (Million) Forecast, by Application 2019 & 2032
- Table 144: South Korea Herpes Simplex Treatment Industry Volume (K Unit) Forecast, by Application 2019 & 2032
- Table 145: Rest of Asia Pacific Herpes Simplex Treatment Industry Revenue (Million) Forecast, by Application 2019 & 2032
- Table 146: Rest of Asia Pacific Herpes Simplex Treatment Industry Volume (K Unit) Forecast, by Application 2019 & 2032
- Table 147: Global Herpes Simplex Treatment Industry Revenue Million Forecast, by Drug 2019 & 2032
- Table 148: Global Herpes Simplex Treatment Industry Volume K Unit Forecast, by Drug 2019 & 2032
- Table 149: Global Herpes Simplex Treatment Industry Revenue Million Forecast, by Route of Administration 2019 & 2032
- Table 150: Global Herpes Simplex Treatment Industry Volume K Unit Forecast, by Route of Administration 2019 & 2032
- Table 151: Global Herpes Simplex Treatment Industry Revenue Million Forecast, by Country 2019 & 2032
- Table 152: Global Herpes Simplex Treatment Industry Volume K Unit Forecast, by Country 2019 & 2032
Frequently Asked Questions
1. What is the projected Compound Annual Growth Rate (CAGR) of the Herpes Simplex Treatment Industry?
The projected CAGR is approximately 4.77%.
2. Which companies are prominent players in the Herpes Simplex Treatment Industry?
Key companies in the market include Emcure Pharmaceuticals Ltd (Avet Pharmaceuticals Inc ), Agenus Inc, BlueWillow Biologics, Glenmark Pharmaceuticals, AiCuris GmbH & Co KG, Viatris Inc, Teva Pharmaceuticals Industries Ltd, Fresenius SE & Co KGaA, Novartis AG, Carlsbad Tech, Zydus Group, Apotex Inc, GlaxoSmithKline PLC.
3. What are the main segments of the Herpes Simplex Treatment Industry?
The market segments include Drug, Route of Administration.
4. Can you provide details about the market size?
The market size is estimated to be USD 2.48 Million as of 2022.
5. What are some drivers contributing to market growth?
Growing Burden of Herpes Simplex Virus Infections; Increasing R&D Activities.
6. What are the notable trends driving market growth?
Acyclovir Segment is Expected to Hold a Significant Market Share in the Herpes Simplex Virus Treatment Market.
7. Are there any restraints impacting market growth?
Social Stigma Associated with Sexually Transmitted Diseases. Coupled with Rising Product Recalls.
8. Can you provide examples of recent developments in the market?
In October 2022, Replay, a genome writing company, reported the launch of Eudora, a herpes simplex virus (HSV) gene therapy company targeting genetic retinal diseases. It is the first of Replay's product companies to leverage its high payload capacity HSV delivery vector, synHSV.
9. What pricing options are available for accessing the report?
Pricing options include single-user, multi-user, and enterprise licenses priced at USD 4750, USD 5250, and USD 8750 respectively.
10. Is the market size provided in terms of value or volume?
The market size is provided in terms of value, measured in Million and volume, measured in K Unit.
11. Are there any specific market keywords associated with the report?
Yes, the market keyword associated with the report is "Herpes Simplex Treatment Industry," which aids in identifying and referencing the specific market segment covered.
12. How do I determine which pricing option suits my needs best?
The pricing options vary based on user requirements and access needs. Individual users may opt for single-user licenses, while businesses requiring broader access may choose multi-user or enterprise licenses for cost-effective access to the report.
13. Are there any additional resources or data provided in the Herpes Simplex Treatment Industry report?
While the report offers comprehensive insights, it's advisable to review the specific contents or supplementary materials provided to ascertain if additional resources or data are available.
14. How can I stay updated on further developments or reports in the Herpes Simplex Treatment Industry?
To stay informed about further developments, trends, and reports in the Herpes Simplex Treatment Industry, consider subscribing to industry newsletters, following relevant companies and organizations, or regularly checking reputable industry news sources and publications.
Methodology
Step 1 - Identification of Relevant Samples Size from Population Database


Step 2 - Approaches for Defining Global Market Size (Value, Volume* & Price*)

Note*: In applicable scenarios
Step 3 - Data Sources
Primary Research
- Web Analytics
- Survey Reports
- Research Institute
- Latest Research Reports
- Opinion Leaders
Secondary Research
- Annual Reports
- White Paper
- Latest Press Release
- Industry Association
- Paid Database
- Investor Presentations

Step 4 - Data Triangulation
Involves using different sources of information in order to increase the validity of a study
These sources are likely to be stakeholders in a program - participants, other researchers, program staff, other community members, and so on.
Then we put all data in single framework & apply various statistical tools to find out the dynamic on the market.
During the analysis stage, feedback from the stakeholder groups would be compared to determine areas of agreement as well as areas of divergence


