Key Insights
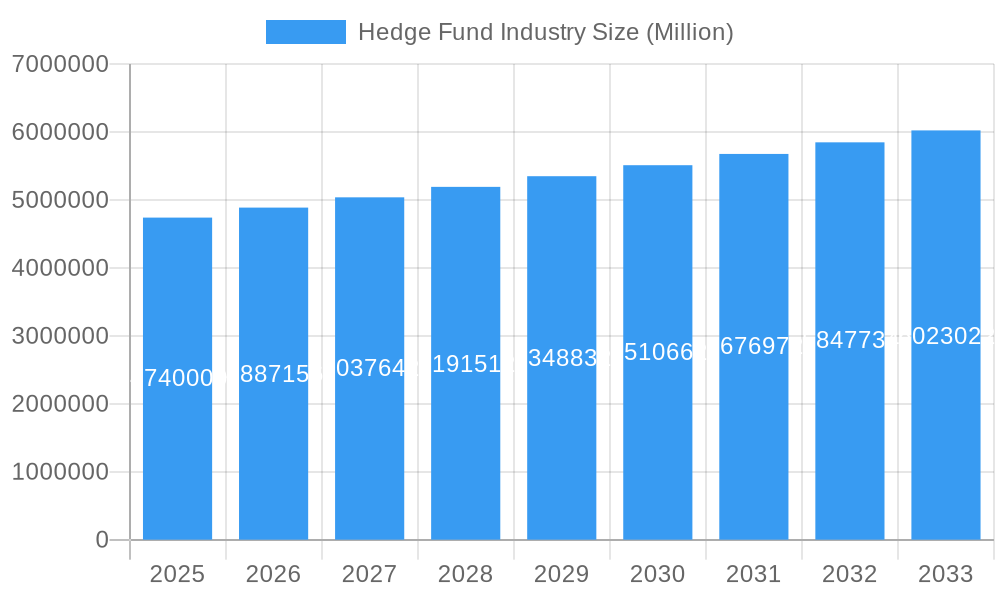
The global hedge fund industry, currently valued at $4.74 trillion (2025), is projected to experience steady growth, exhibiting a Compound Annual Growth Rate (CAGR) of 3.14% from 2025 to 2033. This growth is driven by several factors, including increasing global wealth, sophisticated investor demand for alternative investment strategies, and the persistent pursuit of higher returns beyond traditional market benchmarks. Technological advancements, particularly in areas like artificial intelligence and machine learning, are also contributing to enhanced portfolio management and risk assessment, further fueling industry expansion. However, regulatory scrutiny, evolving investor preferences, and persistent macroeconomic uncertainties pose significant challenges. The industry's competitive landscape is highly concentrated, with major players such as Bridgewater Associates, Renaissance Technologies, and BlackRock Advisors dominating the market share. These firms leverage substantial capital, advanced technologies, and experienced talent pools to maintain a competitive edge. Geographic diversification plays a crucial role, with North America and Europe remaining primary hubs for hedge fund activity, although emerging markets show potential for future growth. The industry's segmentation, while not explicitly detailed, likely encompasses various investment strategies (long/short equity, global macro, quantitative, etc.), catering to diverse investor risk appetites and objectives. The forecast period anticipates a continuation of the observed trends, with the market size expected to reach approximately $6.25 trillion by 2033, based on the provided CAGR. However, the actual trajectory will hinge on global economic conditions and regulatory developments.
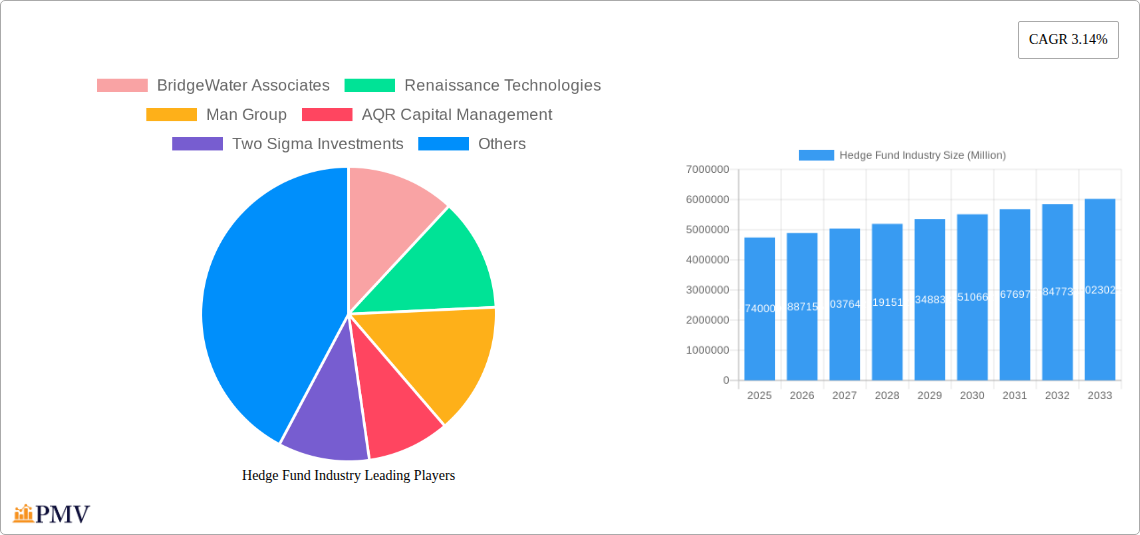
Hedge Fund Industry Market Size (In Million)
The sustained growth in the hedge fund industry underscores the enduring demand for sophisticated investment strategies among high-net-worth individuals and institutional investors. While the competitive landscape is intensely competitive, successful firms will likely be those that can effectively adapt to evolving market dynamics, integrate cutting-edge technology, and manage risk effectively within a complex regulatory environment. Future growth will be influenced by factors such as geopolitical stability, regulatory changes, and innovation within the industry's investment strategies and operational models. The long-term outlook remains positive, assuming favorable macroeconomic conditions and the continuous evolution of investment strategies to meet changing market needs. While the exact segment breakdown remains unspecified, it's reasonable to assume that various investment strategies, geographical locations, and fund sizes contribute to the overall industry’s multifaceted nature and growth trajectory.
Hedge Fund Industry Company Market Share
Hedge Fund Industry: A Comprehensive Market Report (2019-2033)
This detailed report provides a comprehensive analysis of the global hedge fund industry, covering market structure, competitive dynamics, leading players, key developments, and future growth prospects. The study period spans from 2019 to 2033, with 2025 as the base and estimated year. This report is invaluable for investors, industry professionals, and anyone seeking a deep understanding of this dynamic and complex sector. The report analyzes a market valued at $xx Million in 2025, projected to reach $xx Million by 2033, exhibiting a CAGR of xx%.
Hedge Fund Industry Market Structure & Competitive Dynamics
The hedge fund industry is characterized by a highly concentrated market structure, with a few dominant players controlling a significant portion of assets under management (AUM). Top firms like Bridgewater Associates, Renaissance Technologies, and Man Group command substantial market share, exceeding xx% collectively in 2025. This concentration is further amplified by significant barriers to entry, including substantial capital requirements, complex regulatory frameworks, and the need for specialized expertise.
The competitive landscape is intense, driven by continuous innovation in investment strategies, technological advancements, and aggressive mergers and acquisitions (M&A) activities. Recent examples include BlackRock's acquisition of Jupiter Power in November 2022 (valued at $xx Million) and Two Sigma's acquisition of Hivemind Software in August 2022. These deals illustrate the ongoing consolidation and diversification within the sector. Further analysis delves into the dynamics of smaller niche players focusing on specialized strategies. The report explores the impact of regulatory changes, specifically focusing on the influence of evolving compliance standards on market dynamics and profitability.
- Market Concentration: High, with top players controlling xx% of AUM.
- M&A Activity: Significant, with deal values exceeding $xx Million in recent years.
- Innovation Ecosystems: Driven by technological advancements and evolving investment strategies.
- Regulatory Frameworks: Complex and evolving, impacting market entry and operations.
- Product Substitutes: Limited, due to the specialized nature of hedge fund strategies.
- End-User Trends: Increasing demand for alternative investment strategies.
Hedge Fund Industry Industry Trends & Insights
The hedge fund industry is undergoing a period of significant transformation driven by several factors. Technological disruptions, including the use of artificial intelligence (AI) and machine learning (ML) in investment decision-making, are reshaping the industry. These technologies improve efficiency, speed, and data analysis. Meanwhile, increasing regulatory scrutiny and a shifting investor landscape are influencing the industry's trajectory. The demand for alternative investment solutions offering diversification and potential for high returns continues to grow. This demand is fueled by low interest rates and concerns about traditional asset classes, driving market expansion and increased competition. The report analyses the impact of economic cycles, geopolitical events, and investor sentiment on hedge fund performance and overall market growth.
Dominant Markets & Segments in Hedge Fund Industry
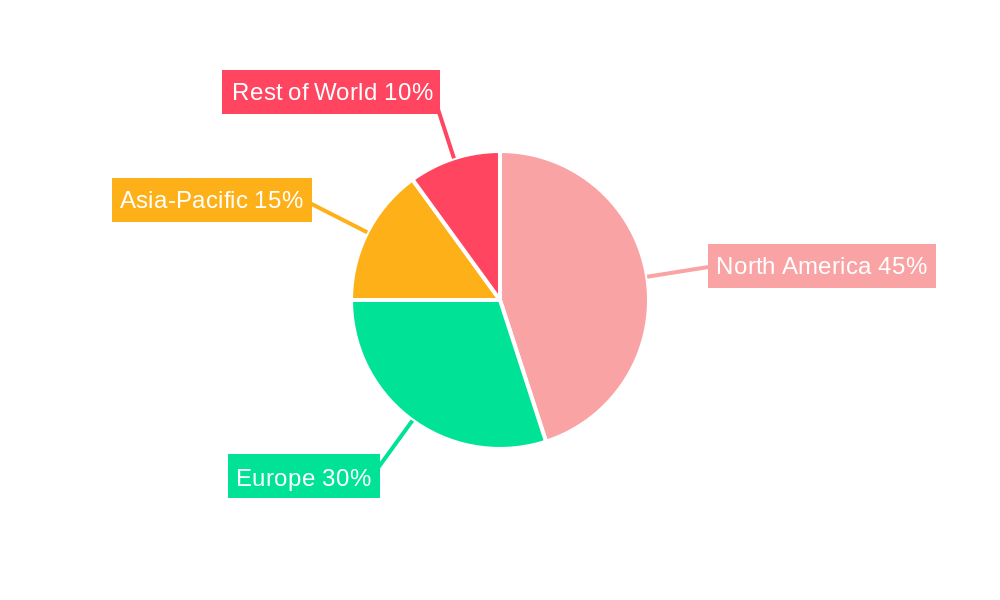
The United States remains the dominant market for hedge funds, accounting for approximately xx% of global AUM in 2025. This dominance is attributable to several factors:
- Deep capital markets: Providing access to extensive liquidity and diverse investment opportunities.
- Strong regulatory framework: Attracting significant foreign investment and facilitating business operations.
- Mature and sophisticated investor base: Providing a wide range of investors including high-net-worth individuals and institutional investors.
- Presence of leading hedge fund managers: Attract significant capital and talent.
Other significant markets include the United Kingdom, Europe, and Asia, exhibiting substantial growth potential driven by expanding investor bases and favorable regulatory environments. Detailed analysis in the report covers regional variations in investment strategies, regulatory frameworks, and competitive landscape.
Hedge Fund Industry Product Innovations
Recent product innovations within the hedge fund industry include the increased use of quantitative strategies, algorithmic trading, and AI-driven investment solutions. These innovations aim to enhance risk management, portfolio optimization, and overall investment performance. The integration of alternative data sources and advanced analytics allows for a more nuanced understanding of market trends and opportunities, generating competitive advantages and driving growth across the sector.
Report Segmentation & Scope
The report segments the hedge fund industry based on several key factors, including investment strategy (e.g., long-short equity, global macro, distressed debt, quantitative), asset class, investor type (e.g., institutional, high-net-worth individuals), and geographic region. Growth projections, market sizes, and competitive dynamics are analyzed for each segment to provide a comprehensive overview of the industry's structure and performance.
Key Drivers of Hedge Fund Industry Growth
Several key factors are driving growth within the hedge fund industry. These include:
- Growing demand for alternative investment solutions: Investors are seeking higher returns and diversification beyond traditional assets.
- Technological advancements: AI, ML, and big data analytics enhance efficiency and investment decision-making.
- Favorable regulatory environments: In certain regions, attract capital and encourage growth.
Challenges in the Hedge Fund Industry Sector
The hedge fund industry faces significant challenges including increasing regulatory scrutiny, intense competition, and the need to adapt to evolving investor demands. These factors can impact profitability and market share. Furthermore, macroeconomic uncertainty and geopolitical events add additional layers of complexity to the investment landscape.
Leading Players in the Hedge Fund Industry Market
Key Developments in Hedge Fund Industry Sector
- November 2022: BlackRock Alternatives acquired Jupiter Power LLC, expanding into the renewable energy sector. This signals the industry's diversification beyond traditional investments.
- August 2022: Two Sigma acquired Hivemind Software, enhancing its data analytics capabilities and reinforcing the importance of technology within the sector.
Strategic Hedge Fund Industry Market Outlook
The hedge fund industry is poised for continued growth, driven by technological advancements, evolving investor preferences, and the ongoing need for sophisticated investment strategies. Strategic opportunities exist for firms that can leverage technology effectively, adapt to changing regulations, and offer unique and high-performing investment solutions. The increasing importance of environmental, social, and governance (ESG) considerations will also shape future growth and investment opportunities.
Hedge Fund Industry Segmentation
-
1. Core Strategy
- 1.1. Equity Strategies
- 1.2. Macro Strategies
- 1.3. Event Driven Strategies
- 1.4. Credit Strategies
- 1.5. Relative Value Strategies
- 1.6. Niche Strategies
- 1.7. Multi-Strategy
- 1.8. Managed Futures/CTA Strategies
-
2. Manager Location
-
2.1. North America
- 2.1.1. United states
- 2.1.2. Canada
- 2.1.3. Mexico
-
2.2. Europe
- 2.2.1. United Kingdom
- 2.2.2. Sweden
- 2.2.3. France
- 2.2.4. Switzerland
- 2.2.5. Rest of Europe
-
2.3. Asia-Pacific
- 2.3.1. Hong Kong
- 2.3.2. Australia
- 2.3.3. Rest of Asia-Pacific
-
2.4. Latin America
- 2.4.1. Brazil
- 2.4.2. Rest of Latin America
-
2.5. Middle East and Africa
- 2.5.1. United Arab Emirates
- 2.5.2. Saudi Arabia
- 2.5.3. Rest of Middle East and Africa
-
2.1. North America
Hedge Fund Industry Segmentation By Geography
-
1. North America
- 1.1. United States
- 1.2. Canada
- 1.3. Mexico
-
2. South America
- 2.1. Brazil
- 2.2. Argentina
- 2.3. Rest of South America
-
3. Europe
- 3.1. United Kingdom
- 3.2. Germany
- 3.3. France
- 3.4. Italy
- 3.5. Spain
- 3.6. Russia
- 3.7. Benelux
- 3.8. Nordics
- 3.9. Rest of Europe
-
4. Middle East & Africa
- 4.1. Turkey
- 4.2. Israel
- 4.3. GCC
- 4.4. North Africa
- 4.5. South Africa
- 4.6. Rest of Middle East & Africa
-
5. Asia Pacific
- 5.1. China
- 5.2. India
- 5.3. Japan
- 5.4. South Korea
- 5.5. ASEAN
- 5.6. Oceania
- 5.7. Rest of Asia Pacific
Hedge Fund Industry Regional Market Share
Geographic Coverage of Hedge Fund Industry
Hedge Fund Industry REPORT HIGHLIGHTS
| Aspects | Details |
|---|---|
| Study Period | 2020-2034 |
| Base Year | 2025 |
| Estimated Year | 2026 |
| Forecast Period | 2026-2034 |
| Historical Period | 2020-2025 |
| Growth Rate | CAGR of 3.14% from 2020-2034 |
| Segmentation |
|
Table of Contents
- 1. Introduction
- 1.1. Research Scope
- 1.2. Market Segmentation
- 1.3. Research Objective
- 1.4. Definitions and Assumptions
- 2. Executive Summary
- 2.1. Market Snapshot
- 3. Market Dynamics
- 3.1. Market Drivers
- 3.2. Market Restrains
- 3.3. Market Trends
- 3.4. Market Opportunities
- 4. Market Factor Analysis
- 4.1. Porters Five Forces
- 4.1.1. Bargaining Power of Suppliers
- 4.1.2. Bargaining Power of Buyers
- 4.1.3. Threat of New Entrants
- 4.1.4. Threat of Substitutes
- 4.1.5. Competitive Rivalry
- 4.2. PESTEL analysis
- 4.3. BCG Analysis
- 4.3.1. Stars (High Growth, High Market Share)
- 4.3.2. Cash Cows (Low Growth, High Market Share)
- 4.3.3. Question Mark (High Growth, Low Market Share)
- 4.3.4. Dogs (Low Growth, Low Market Share)
- 4.4. Ansoff Matrix Analysis
- 4.5. Supply Chain Analysis
- 4.6. Regulatory Landscape
- 4.7. Current Market Potential and Opportunity Assessment (TAM–SAM–SOM Framework)
- 4.8. PMV Analyst Note
- 4.1. Porters Five Forces
- 5. Market Analysis, Insights and Forecast 2021-2033
- 5.1. Market Analysis, Insights and Forecast - by Core Strategy
- 5.1.1. Equity Strategies
- 5.1.2. Macro Strategies
- 5.1.3. Event Driven Strategies
- 5.1.4. Credit Strategies
- 5.1.5. Relative Value Strategies
- 5.1.6. Niche Strategies
- 5.1.7. Multi-Strategy
- 5.1.8. Managed Futures/CTA Strategies
- 5.2. Market Analysis, Insights and Forecast - by Manager Location
- 5.2.1. North America
- 5.2.1.1. United states
- 5.2.1.2. Canada
- 5.2.1.3. Mexico
- 5.2.2. Europe
- 5.2.2.1. United Kingdom
- 5.2.2.2. Sweden
- 5.2.2.3. France
- 5.2.2.4. Switzerland
- 5.2.2.5. Rest of Europe
- 5.2.3. Asia-Pacific
- 5.2.3.1. Hong Kong
- 5.2.3.2. Australia
- 5.2.3.3. Rest of Asia-Pacific
- 5.2.4. Latin America
- 5.2.4.1. Brazil
- 5.2.4.2. Rest of Latin America
- 5.2.5. Middle East and Africa
- 5.2.5.1. United Arab Emirates
- 5.2.5.2. Saudi Arabia
- 5.2.5.3. Rest of Middle East and Africa
- 5.2.1. North America
- 5.3. Market Analysis, Insights and Forecast - by Region
- 5.3.1. North America
- 5.3.2. South America
- 5.3.3. Europe
- 5.3.4. Middle East & Africa
- 5.3.5. Asia Pacific
- 5.1. Market Analysis, Insights and Forecast - by Core Strategy
- 6. Global Hedge Fund Industry Analysis, Insights and Forecast, 2021-2033
- 6.1. Market Analysis, Insights and Forecast - by Core Strategy
- 6.1.1. Equity Strategies
- 6.1.2. Macro Strategies
- 6.1.3. Event Driven Strategies
- 6.1.4. Credit Strategies
- 6.1.5. Relative Value Strategies
- 6.1.6. Niche Strategies
- 6.1.7. Multi-Strategy
- 6.1.8. Managed Futures/CTA Strategies
- 6.2. Market Analysis, Insights and Forecast - by Manager Location
- 6.2.1. North America
- 6.2.1.1. United states
- 6.2.1.2. Canada
- 6.2.1.3. Mexico
- 6.2.2. Europe
- 6.2.2.1. United Kingdom
- 6.2.2.2. Sweden
- 6.2.2.3. France
- 6.2.2.4. Switzerland
- 6.2.2.5. Rest of Europe
- 6.2.3. Asia-Pacific
- 6.2.3.1. Hong Kong
- 6.2.3.2. Australia
- 6.2.3.3. Rest of Asia-Pacific
- 6.2.4. Latin America
- 6.2.4.1. Brazil
- 6.2.4.2. Rest of Latin America
- 6.2.5. Middle East and Africa
- 6.2.5.1. United Arab Emirates
- 6.2.5.2. Saudi Arabia
- 6.2.5.3. Rest of Middle East and Africa
- 6.2.1. North America
- 6.1. Market Analysis, Insights and Forecast - by Core Strategy
- 7. North America Hedge Fund Industry Analysis, Insights and Forecast, 2020-2032
- 7.1. Market Analysis, Insights and Forecast - by Core Strategy
- 7.1.1. Equity Strategies
- 7.1.2. Macro Strategies
- 7.1.3. Event Driven Strategies
- 7.1.4. Credit Strategies
- 7.1.5. Relative Value Strategies
- 7.1.6. Niche Strategies
- 7.1.7. Multi-Strategy
- 7.1.8. Managed Futures/CTA Strategies
- 7.2. Market Analysis, Insights and Forecast - by Manager Location
- 7.2.1. North America
- 7.2.1.1. United states
- 7.2.1.2. Canada
- 7.2.1.3. Mexico
- 7.2.2. Europe
- 7.2.2.1. United Kingdom
- 7.2.2.2. Sweden
- 7.2.2.3. France
- 7.2.2.4. Switzerland
- 7.2.2.5. Rest of Europe
- 7.2.3. Asia-Pacific
- 7.2.3.1. Hong Kong
- 7.2.3.2. Australia
- 7.2.3.3. Rest of Asia-Pacific
- 7.2.4. Latin America
- 7.2.4.1. Brazil
- 7.2.4.2. Rest of Latin America
- 7.2.5. Middle East and Africa
- 7.2.5.1. United Arab Emirates
- 7.2.5.2. Saudi Arabia
- 7.2.5.3. Rest of Middle East and Africa
- 7.2.1. North America
- 7.1. Market Analysis, Insights and Forecast - by Core Strategy
- 8. South America Hedge Fund Industry Analysis, Insights and Forecast, 2020-2032
- 8.1. Market Analysis, Insights and Forecast - by Core Strategy
- 8.1.1. Equity Strategies
- 8.1.2. Macro Strategies
- 8.1.3. Event Driven Strategies
- 8.1.4. Credit Strategies
- 8.1.5. Relative Value Strategies
- 8.1.6. Niche Strategies
- 8.1.7. Multi-Strategy
- 8.1.8. Managed Futures/CTA Strategies
- 8.2. Market Analysis, Insights and Forecast - by Manager Location
- 8.2.1. North America
- 8.2.1.1. United states
- 8.2.1.2. Canada
- 8.2.1.3. Mexico
- 8.2.2. Europe
- 8.2.2.1. United Kingdom
- 8.2.2.2. Sweden
- 8.2.2.3. France
- 8.2.2.4. Switzerland
- 8.2.2.5. Rest of Europe
- 8.2.3. Asia-Pacific
- 8.2.3.1. Hong Kong
- 8.2.3.2. Australia
- 8.2.3.3. Rest of Asia-Pacific
- 8.2.4. Latin America
- 8.2.4.1. Brazil
- 8.2.4.2. Rest of Latin America
- 8.2.5. Middle East and Africa
- 8.2.5.1. United Arab Emirates
- 8.2.5.2. Saudi Arabia
- 8.2.5.3. Rest of Middle East and Africa
- 8.2.1. North America
- 8.1. Market Analysis, Insights and Forecast - by Core Strategy
- 9. Europe Hedge Fund Industry Analysis, Insights and Forecast, 2020-2032
- 9.1. Market Analysis, Insights and Forecast - by Core Strategy
- 9.1.1. Equity Strategies
- 9.1.2. Macro Strategies
- 9.1.3. Event Driven Strategies
- 9.1.4. Credit Strategies
- 9.1.5. Relative Value Strategies
- 9.1.6. Niche Strategies
- 9.1.7. Multi-Strategy
- 9.1.8. Managed Futures/CTA Strategies
- 9.2. Market Analysis, Insights and Forecast - by Manager Location
- 9.2.1. North America
- 9.2.1.1. United states
- 9.2.1.2. Canada
- 9.2.1.3. Mexico
- 9.2.2. Europe
- 9.2.2.1. United Kingdom
- 9.2.2.2. Sweden
- 9.2.2.3. France
- 9.2.2.4. Switzerland
- 9.2.2.5. Rest of Europe
- 9.2.3. Asia-Pacific
- 9.2.3.1. Hong Kong
- 9.2.3.2. Australia
- 9.2.3.3. Rest of Asia-Pacific
- 9.2.4. Latin America
- 9.2.4.1. Brazil
- 9.2.4.2. Rest of Latin America
- 9.2.5. Middle East and Africa
- 9.2.5.1. United Arab Emirates
- 9.2.5.2. Saudi Arabia
- 9.2.5.3. Rest of Middle East and Africa
- 9.2.1. North America
- 9.1. Market Analysis, Insights and Forecast - by Core Strategy
- 10. Middle East & Africa Hedge Fund Industry Analysis, Insights and Forecast, 2020-2032
- 10.1. Market Analysis, Insights and Forecast - by Core Strategy
- 10.1.1. Equity Strategies
- 10.1.2. Macro Strategies
- 10.1.3. Event Driven Strategies
- 10.1.4. Credit Strategies
- 10.1.5. Relative Value Strategies
- 10.1.6. Niche Strategies
- 10.1.7. Multi-Strategy
- 10.1.8. Managed Futures/CTA Strategies
- 10.2. Market Analysis, Insights and Forecast - by Manager Location
- 10.2.1. North America
- 10.2.1.1. United states
- 10.2.1.2. Canada
- 10.2.1.3. Mexico
- 10.2.2. Europe
- 10.2.2.1. United Kingdom
- 10.2.2.2. Sweden
- 10.2.2.3. France
- 10.2.2.4. Switzerland
- 10.2.2.5. Rest of Europe
- 10.2.3. Asia-Pacific
- 10.2.3.1. Hong Kong
- 10.2.3.2. Australia
- 10.2.3.3. Rest of Asia-Pacific
- 10.2.4. Latin America
- 10.2.4.1. Brazil
- 10.2.4.2. Rest of Latin America
- 10.2.5. Middle East and Africa
- 10.2.5.1. United Arab Emirates
- 10.2.5.2. Saudi Arabia
- 10.2.5.3. Rest of Middle East and Africa
- 10.2.1. North America
- 10.1. Market Analysis, Insights and Forecast - by Core Strategy
- 11. Asia Pacific Hedge Fund Industry Analysis, Insights and Forecast, 2020-2032
- 11.1. Market Analysis, Insights and Forecast - by Core Strategy
- 11.1.1. Equity Strategies
- 11.1.2. Macro Strategies
- 11.1.3. Event Driven Strategies
- 11.1.4. Credit Strategies
- 11.1.5. Relative Value Strategies
- 11.1.6. Niche Strategies
- 11.1.7. Multi-Strategy
- 11.1.8. Managed Futures/CTA Strategies
- 11.2. Market Analysis, Insights and Forecast - by Manager Location
- 11.2.1. North America
- 11.2.1.1. United states
- 11.2.1.2. Canada
- 11.2.1.3. Mexico
- 11.2.2. Europe
- 11.2.2.1. United Kingdom
- 11.2.2.2. Sweden
- 11.2.2.3. France
- 11.2.2.4. Switzerland
- 11.2.2.5. Rest of Europe
- 11.2.3. Asia-Pacific
- 11.2.3.1. Hong Kong
- 11.2.3.2. Australia
- 11.2.3.3. Rest of Asia-Pacific
- 11.2.4. Latin America
- 11.2.4.1. Brazil
- 11.2.4.2. Rest of Latin America
- 11.2.5. Middle East and Africa
- 11.2.5.1. United Arab Emirates
- 11.2.5.2. Saudi Arabia
- 11.2.5.3. Rest of Middle East and Africa
- 11.2.1. North America
- 11.1. Market Analysis, Insights and Forecast - by Core Strategy
- 12. Competitive Analysis
- 12.1. Company Profiles
- 12.1.1 BridgeWater Associates
- 12.1.1.1. Company Overview
- 12.1.1.2. Products
- 12.1.1.3. Company Financials
- 12.1.1.4. SWOT Analysis
- 12.1.2 Renaissance Technologies
- 12.1.2.1. Company Overview
- 12.1.2.2. Products
- 12.1.2.3. Company Financials
- 12.1.2.4. SWOT Analysis
- 12.1.3 Man Group
- 12.1.3.1. Company Overview
- 12.1.3.2. Products
- 12.1.3.3. Company Financials
- 12.1.3.4. SWOT Analysis
- 12.1.4 AQR Capital Management
- 12.1.4.1. Company Overview
- 12.1.4.2. Products
- 12.1.4.3. Company Financials
- 12.1.4.4. SWOT Analysis
- 12.1.5 Two Sigma Investments
- 12.1.5.1. Company Overview
- 12.1.5.2. Products
- 12.1.5.3. Company Financials
- 12.1.5.4. SWOT Analysis
- 12.1.6 Millennium Management
- 12.1.6.1. Company Overview
- 12.1.6.2. Products
- 12.1.6.3. Company Financials
- 12.1.6.4. SWOT Analysis
- 12.1.7 Elliot Management
- 12.1.7.1. Company Overview
- 12.1.7.2. Products
- 12.1.7.3. Company Financials
- 12.1.7.4. SWOT Analysis
- 12.1.8 BlackRock Advisors
- 12.1.8.1. Company Overview
- 12.1.8.2. Products
- 12.1.8.3. Company Financials
- 12.1.8.4. SWOT Analysis
- 12.1.9 Citadel
- 12.1.9.1. Company Overview
- 12.1.9.2. Products
- 12.1.9.3. Company Financials
- 12.1.9.4. SWOT Analysis
- 12.1.10 Davidson Kempner Capital**List Not Exhaustive
- 12.1.10.1. Company Overview
- 12.1.10.2. Products
- 12.1.10.3. Company Financials
- 12.1.10.4. SWOT Analysis
- 12.1.1 BridgeWater Associates
- 12.2. Market Entropy
- 12.2.1 Company's Key Areas Served
- 12.2.2 Recent Developments
- 12.3. Company Market Share Analysis 2025
- 12.3.1 Top 5 Companies Market Share Analysis
- 12.3.2 Top 3 Companies Market Share Analysis
- 12.4. List of Potential Customers
- 13. Research Methodology
List of Figures
- Figure 1: Global Hedge Fund Industry Revenue Breakdown (Million, %) by Region 2025 & 2033
- Figure 2: Global Hedge Fund Industry Volume Breakdown (Trillion, %) by Region 2025 & 2033
- Figure 3: North America Hedge Fund Industry Revenue (Million), by Core Strategy 2025 & 2033
- Figure 4: North America Hedge Fund Industry Volume (Trillion), by Core Strategy 2025 & 2033
- Figure 5: North America Hedge Fund Industry Revenue Share (%), by Core Strategy 2025 & 2033
- Figure 6: North America Hedge Fund Industry Volume Share (%), by Core Strategy 2025 & 2033
- Figure 7: North America Hedge Fund Industry Revenue (Million), by Manager Location 2025 & 2033
- Figure 8: North America Hedge Fund Industry Volume (Trillion), by Manager Location 2025 & 2033
- Figure 9: North America Hedge Fund Industry Revenue Share (%), by Manager Location 2025 & 2033
- Figure 10: North America Hedge Fund Industry Volume Share (%), by Manager Location 2025 & 2033
- Figure 11: North America Hedge Fund Industry Revenue (Million), by Country 2025 & 2033
- Figure 12: North America Hedge Fund Industry Volume (Trillion), by Country 2025 & 2033
- Figure 13: North America Hedge Fund Industry Revenue Share (%), by Country 2025 & 2033
- Figure 14: North America Hedge Fund Industry Volume Share (%), by Country 2025 & 2033
- Figure 15: South America Hedge Fund Industry Revenue (Million), by Core Strategy 2025 & 2033
- Figure 16: South America Hedge Fund Industry Volume (Trillion), by Core Strategy 2025 & 2033
- Figure 17: South America Hedge Fund Industry Revenue Share (%), by Core Strategy 2025 & 2033
- Figure 18: South America Hedge Fund Industry Volume Share (%), by Core Strategy 2025 & 2033
- Figure 19: South America Hedge Fund Industry Revenue (Million), by Manager Location 2025 & 2033
- Figure 20: South America Hedge Fund Industry Volume (Trillion), by Manager Location 2025 & 2033
- Figure 21: South America Hedge Fund Industry Revenue Share (%), by Manager Location 2025 & 2033
- Figure 22: South America Hedge Fund Industry Volume Share (%), by Manager Location 2025 & 2033
- Figure 23: South America Hedge Fund Industry Revenue (Million), by Country 2025 & 2033
- Figure 24: South America Hedge Fund Industry Volume (Trillion), by Country 2025 & 2033
- Figure 25: South America Hedge Fund Industry Revenue Share (%), by Country 2025 & 2033
- Figure 26: South America Hedge Fund Industry Volume Share (%), by Country 2025 & 2033
- Figure 27: Europe Hedge Fund Industry Revenue (Million), by Core Strategy 2025 & 2033
- Figure 28: Europe Hedge Fund Industry Volume (Trillion), by Core Strategy 2025 & 2033
- Figure 29: Europe Hedge Fund Industry Revenue Share (%), by Core Strategy 2025 & 2033
- Figure 30: Europe Hedge Fund Industry Volume Share (%), by Core Strategy 2025 & 2033
- Figure 31: Europe Hedge Fund Industry Revenue (Million), by Manager Location 2025 & 2033
- Figure 32: Europe Hedge Fund Industry Volume (Trillion), by Manager Location 2025 & 2033
- Figure 33: Europe Hedge Fund Industry Revenue Share (%), by Manager Location 2025 & 2033
- Figure 34: Europe Hedge Fund Industry Volume Share (%), by Manager Location 2025 & 2033
- Figure 35: Europe Hedge Fund Industry Revenue (Million), by Country 2025 & 2033
- Figure 36: Europe Hedge Fund Industry Volume (Trillion), by Country 2025 & 2033
- Figure 37: Europe Hedge Fund Industry Revenue Share (%), by Country 2025 & 2033
- Figure 38: Europe Hedge Fund Industry Volume Share (%), by Country 2025 & 2033
- Figure 39: Middle East & Africa Hedge Fund Industry Revenue (Million), by Core Strategy 2025 & 2033
- Figure 40: Middle East & Africa Hedge Fund Industry Volume (Trillion), by Core Strategy 2025 & 2033
- Figure 41: Middle East & Africa Hedge Fund Industry Revenue Share (%), by Core Strategy 2025 & 2033
- Figure 42: Middle East & Africa Hedge Fund Industry Volume Share (%), by Core Strategy 2025 & 2033
- Figure 43: Middle East & Africa Hedge Fund Industry Revenue (Million), by Manager Location 2025 & 2033
- Figure 44: Middle East & Africa Hedge Fund Industry Volume (Trillion), by Manager Location 2025 & 2033
- Figure 45: Middle East & Africa Hedge Fund Industry Revenue Share (%), by Manager Location 2025 & 2033
- Figure 46: Middle East & Africa Hedge Fund Industry Volume Share (%), by Manager Location 2025 & 2033
- Figure 47: Middle East & Africa Hedge Fund Industry Revenue (Million), by Country 2025 & 2033
- Figure 48: Middle East & Africa Hedge Fund Industry Volume (Trillion), by Country 2025 & 2033
- Figure 49: Middle East & Africa Hedge Fund Industry Revenue Share (%), by Country 2025 & 2033
- Figure 50: Middle East & Africa Hedge Fund Industry Volume Share (%), by Country 2025 & 2033
- Figure 51: Asia Pacific Hedge Fund Industry Revenue (Million), by Core Strategy 2025 & 2033
- Figure 52: Asia Pacific Hedge Fund Industry Volume (Trillion), by Core Strategy 2025 & 2033
- Figure 53: Asia Pacific Hedge Fund Industry Revenue Share (%), by Core Strategy 2025 & 2033
- Figure 54: Asia Pacific Hedge Fund Industry Volume Share (%), by Core Strategy 2025 & 2033
- Figure 55: Asia Pacific Hedge Fund Industry Revenue (Million), by Manager Location 2025 & 2033
- Figure 56: Asia Pacific Hedge Fund Industry Volume (Trillion), by Manager Location 2025 & 2033
- Figure 57: Asia Pacific Hedge Fund Industry Revenue Share (%), by Manager Location 2025 & 2033
- Figure 58: Asia Pacific Hedge Fund Industry Volume Share (%), by Manager Location 2025 & 2033
- Figure 59: Asia Pacific Hedge Fund Industry Revenue (Million), by Country 2025 & 2033
- Figure 60: Asia Pacific Hedge Fund Industry Volume (Trillion), by Country 2025 & 2033
- Figure 61: Asia Pacific Hedge Fund Industry Revenue Share (%), by Country 2025 & 2033
- Figure 62: Asia Pacific Hedge Fund Industry Volume Share (%), by Country 2025 & 2033
List of Tables
- Table 1: Global Hedge Fund Industry Revenue Million Forecast, by Core Strategy 2020 & 2033
- Table 2: Global Hedge Fund Industry Volume Trillion Forecast, by Core Strategy 2020 & 2033
- Table 3: Global Hedge Fund Industry Revenue Million Forecast, by Manager Location 2020 & 2033
- Table 4: Global Hedge Fund Industry Volume Trillion Forecast, by Manager Location 2020 & 2033
- Table 5: Global Hedge Fund Industry Revenue Million Forecast, by Region 2020 & 2033
- Table 6: Global Hedge Fund Industry Volume Trillion Forecast, by Region 2020 & 2033
- Table 7: Global Hedge Fund Industry Revenue Million Forecast, by Core Strategy 2020 & 2033
- Table 8: Global Hedge Fund Industry Volume Trillion Forecast, by Core Strategy 2020 & 2033
- Table 9: Global Hedge Fund Industry Revenue Million Forecast, by Manager Location 2020 & 2033
- Table 10: Global Hedge Fund Industry Volume Trillion Forecast, by Manager Location 2020 & 2033
- Table 11: Global Hedge Fund Industry Revenue Million Forecast, by Country 2020 & 2033
- Table 12: Global Hedge Fund Industry Volume Trillion Forecast, by Country 2020 & 2033
- Table 13: United States Hedge Fund Industry Revenue (Million) Forecast, by Application 2020 & 2033
- Table 14: United States Hedge Fund Industry Volume (Trillion) Forecast, by Application 2020 & 2033
- Table 15: Canada Hedge Fund Industry Revenue (Million) Forecast, by Application 2020 & 2033
- Table 16: Canada Hedge Fund Industry Volume (Trillion) Forecast, by Application 2020 & 2033
- Table 17: Mexico Hedge Fund Industry Revenue (Million) Forecast, by Application 2020 & 2033
- Table 18: Mexico Hedge Fund Industry Volume (Trillion) Forecast, by Application 2020 & 2033
- Table 19: Global Hedge Fund Industry Revenue Million Forecast, by Core Strategy 2020 & 2033
- Table 20: Global Hedge Fund Industry Volume Trillion Forecast, by Core Strategy 2020 & 2033
- Table 21: Global Hedge Fund Industry Revenue Million Forecast, by Manager Location 2020 & 2033
- Table 22: Global Hedge Fund Industry Volume Trillion Forecast, by Manager Location 2020 & 2033
- Table 23: Global Hedge Fund Industry Revenue Million Forecast, by Country 2020 & 2033
- Table 24: Global Hedge Fund Industry Volume Trillion Forecast, by Country 2020 & 2033
- Table 25: Brazil Hedge Fund Industry Revenue (Million) Forecast, by Application 2020 & 2033
- Table 26: Brazil Hedge Fund Industry Volume (Trillion) Forecast, by Application 2020 & 2033
- Table 27: Argentina Hedge Fund Industry Revenue (Million) Forecast, by Application 2020 & 2033
- Table 28: Argentina Hedge Fund Industry Volume (Trillion) Forecast, by Application 2020 & 2033
- Table 29: Rest of South America Hedge Fund Industry Revenue (Million) Forecast, by Application 2020 & 2033
- Table 30: Rest of South America Hedge Fund Industry Volume (Trillion) Forecast, by Application 2020 & 2033
- Table 31: Global Hedge Fund Industry Revenue Million Forecast, by Core Strategy 2020 & 2033
- Table 32: Global Hedge Fund Industry Volume Trillion Forecast, by Core Strategy 2020 & 2033
- Table 33: Global Hedge Fund Industry Revenue Million Forecast, by Manager Location 2020 & 2033
- Table 34: Global Hedge Fund Industry Volume Trillion Forecast, by Manager Location 2020 & 2033
- Table 35: Global Hedge Fund Industry Revenue Million Forecast, by Country 2020 & 2033
- Table 36: Global Hedge Fund Industry Volume Trillion Forecast, by Country 2020 & 2033
- Table 37: United Kingdom Hedge Fund Industry Revenue (Million) Forecast, by Application 2020 & 2033
- Table 38: United Kingdom Hedge Fund Industry Volume (Trillion) Forecast, by Application 2020 & 2033
- Table 39: Germany Hedge Fund Industry Revenue (Million) Forecast, by Application 2020 & 2033
- Table 40: Germany Hedge Fund Industry Volume (Trillion) Forecast, by Application 2020 & 2033
- Table 41: France Hedge Fund Industry Revenue (Million) Forecast, by Application 2020 & 2033
- Table 42: France Hedge Fund Industry Volume (Trillion) Forecast, by Application 2020 & 2033
- Table 43: Italy Hedge Fund Industry Revenue (Million) Forecast, by Application 2020 & 2033
- Table 44: Italy Hedge Fund Industry Volume (Trillion) Forecast, by Application 2020 & 2033
- Table 45: Spain Hedge Fund Industry Revenue (Million) Forecast, by Application 2020 & 2033
- Table 46: Spain Hedge Fund Industry Volume (Trillion) Forecast, by Application 2020 & 2033
- Table 47: Russia Hedge Fund Industry Revenue (Million) Forecast, by Application 2020 & 2033
- Table 48: Russia Hedge Fund Industry Volume (Trillion) Forecast, by Application 2020 & 2033
- Table 49: Benelux Hedge Fund Industry Revenue (Million) Forecast, by Application 2020 & 2033
- Table 50: Benelux Hedge Fund Industry Volume (Trillion) Forecast, by Application 2020 & 2033
- Table 51: Nordics Hedge Fund Industry Revenue (Million) Forecast, by Application 2020 & 2033
- Table 52: Nordics Hedge Fund Industry Volume (Trillion) Forecast, by Application 2020 & 2033
- Table 53: Rest of Europe Hedge Fund Industry Revenue (Million) Forecast, by Application 2020 & 2033
- Table 54: Rest of Europe Hedge Fund Industry Volume (Trillion) Forecast, by Application 2020 & 2033
- Table 55: Global Hedge Fund Industry Revenue Million Forecast, by Core Strategy 2020 & 2033
- Table 56: Global Hedge Fund Industry Volume Trillion Forecast, by Core Strategy 2020 & 2033
- Table 57: Global Hedge Fund Industry Revenue Million Forecast, by Manager Location 2020 & 2033
- Table 58: Global Hedge Fund Industry Volume Trillion Forecast, by Manager Location 2020 & 2033
- Table 59: Global Hedge Fund Industry Revenue Million Forecast, by Country 2020 & 2033
- Table 60: Global Hedge Fund Industry Volume Trillion Forecast, by Country 2020 & 2033
- Table 61: Turkey Hedge Fund Industry Revenue (Million) Forecast, by Application 2020 & 2033
- Table 62: Turkey Hedge Fund Industry Volume (Trillion) Forecast, by Application 2020 & 2033
- Table 63: Israel Hedge Fund Industry Revenue (Million) Forecast, by Application 2020 & 2033
- Table 64: Israel Hedge Fund Industry Volume (Trillion) Forecast, by Application 2020 & 2033
- Table 65: GCC Hedge Fund Industry Revenue (Million) Forecast, by Application 2020 & 2033
- Table 66: GCC Hedge Fund Industry Volume (Trillion) Forecast, by Application 2020 & 2033
- Table 67: North Africa Hedge Fund Industry Revenue (Million) Forecast, by Application 2020 & 2033
- Table 68: North Africa Hedge Fund Industry Volume (Trillion) Forecast, by Application 2020 & 2033
- Table 69: South Africa Hedge Fund Industry Revenue (Million) Forecast, by Application 2020 & 2033
- Table 70: South Africa Hedge Fund Industry Volume (Trillion) Forecast, by Application 2020 & 2033
- Table 71: Rest of Middle East & Africa Hedge Fund Industry Revenue (Million) Forecast, by Application 2020 & 2033
- Table 72: Rest of Middle East & Africa Hedge Fund Industry Volume (Trillion) Forecast, by Application 2020 & 2033
- Table 73: Global Hedge Fund Industry Revenue Million Forecast, by Core Strategy 2020 & 2033
- Table 74: Global Hedge Fund Industry Volume Trillion Forecast, by Core Strategy 2020 & 2033
- Table 75: Global Hedge Fund Industry Revenue Million Forecast, by Manager Location 2020 & 2033
- Table 76: Global Hedge Fund Industry Volume Trillion Forecast, by Manager Location 2020 & 2033
- Table 77: Global Hedge Fund Industry Revenue Million Forecast, by Country 2020 & 2033
- Table 78: Global Hedge Fund Industry Volume Trillion Forecast, by Country 2020 & 2033
- Table 79: China Hedge Fund Industry Revenue (Million) Forecast, by Application 2020 & 2033
- Table 80: China Hedge Fund Industry Volume (Trillion) Forecast, by Application 2020 & 2033
- Table 81: India Hedge Fund Industry Revenue (Million) Forecast, by Application 2020 & 2033
- Table 82: India Hedge Fund Industry Volume (Trillion) Forecast, by Application 2020 & 2033
- Table 83: Japan Hedge Fund Industry Revenue (Million) Forecast, by Application 2020 & 2033
- Table 84: Japan Hedge Fund Industry Volume (Trillion) Forecast, by Application 2020 & 2033
- Table 85: South Korea Hedge Fund Industry Revenue (Million) Forecast, by Application 2020 & 2033
- Table 86: South Korea Hedge Fund Industry Volume (Trillion) Forecast, by Application 2020 & 2033
- Table 87: ASEAN Hedge Fund Industry Revenue (Million) Forecast, by Application 2020 & 2033
- Table 88: ASEAN Hedge Fund Industry Volume (Trillion) Forecast, by Application 2020 & 2033
- Table 89: Oceania Hedge Fund Industry Revenue (Million) Forecast, by Application 2020 & 2033
- Table 90: Oceania Hedge Fund Industry Volume (Trillion) Forecast, by Application 2020 & 2033
- Table 91: Rest of Asia Pacific Hedge Fund Industry Revenue (Million) Forecast, by Application 2020 & 2033
- Table 92: Rest of Asia Pacific Hedge Fund Industry Volume (Trillion) Forecast, by Application 2020 & 2033
Frequently Asked Questions
1. What is the projected Compound Annual Growth Rate (CAGR) of the Hedge Fund Industry?
The projected CAGR is approximately 3.14%.
2. Which companies are prominent players in the Hedge Fund Industry?
Key companies in the market include BridgeWater Associates, Renaissance Technologies, Man Group, AQR Capital Management, Two Sigma Investments, Millennium Management, Elliot Management, BlackRock Advisors, Citadel, Davidson Kempner Capital**List Not Exhaustive.
3. What are the main segments of the Hedge Fund Industry?
The market segments include Core Strategy, Manager Location.
4. Can you provide details about the market size?
The market size is estimated to be USD 4.74 Million as of 2022.
5. What are some drivers contributing to market growth?
Emerging Demand for Smaller or Newer Fund Managers; Recovering Performance of Existing Hedge Funds.
6. What are the notable trends driving market growth?
Investments in Digital Assets is Driving the Market.
7. Are there any restraints impacting market growth?
Emerging Demand for Smaller or Newer Fund Managers; Recovering Performance of Existing Hedge Funds.
8. Can you provide examples of recent developments in the market?
November 2022: BlackRock Alternatives (BlackRock), through a fund managed by its diversified infrastructure business, agreed to acquire Jupiter Power LLC (Jupiter). Jupiter Power is a leading United States operator and developer of stand-alone, utility-scale battery energy storage systems.
9. What pricing options are available for accessing the report?
Pricing options include single-user, multi-user, and enterprise licenses priced at USD 3800, USD 4500, and USD 5800 respectively.
10. Is the market size provided in terms of value or volume?
The market size is provided in terms of value, measured in Million and volume, measured in Trillion.
11. Are there any specific market keywords associated with the report?
Yes, the market keyword associated with the report is "Hedge Fund Industry," which aids in identifying and referencing the specific market segment covered.
12. How do I determine which pricing option suits my needs best?
The pricing options vary based on user requirements and access needs. Individual users may opt for single-user licenses, while businesses requiring broader access may choose multi-user or enterprise licenses for cost-effective access to the report.
13. Are there any additional resources or data provided in the Hedge Fund Industry report?
While the report offers comprehensive insights, it's advisable to review the specific contents or supplementary materials provided to ascertain if additional resources or data are available.
14. How can I stay updated on further developments or reports in the Hedge Fund Industry?
To stay informed about further developments, trends, and reports in the Hedge Fund Industry, consider subscribing to industry newsletters, following relevant companies and organizations, or regularly checking reputable industry news sources and publications.
Methodology
Step 1 - Identification of Relevant Samples Size from Population Database


Step 2 - Approaches for Defining Global Market Size (Value, Volume* & Price*)

Note*: In applicable scenarios
Step 3 - Data Sources
Primary Research
- Web Analytics
- Survey Reports
- Research Institute
- Latest Research Reports
- Opinion Leaders
Secondary Research
- Annual Reports
- White Paper
- Latest Press Release
- Industry Association
- Paid Database
- Investor Presentations

Step 4 - Data Triangulation
Involves using different sources of information in order to increase the validity of a study
These sources are likely to be stakeholders in a program - participants, other researchers, program staff, other community members, and so on.
Then we put all data in single framework & apply various statistical tools to find out the dynamic on the market.
During the analysis stage, feedback from the stakeholder groups would be compared to determine areas of agreement as well as areas of divergence

