


Key Insights
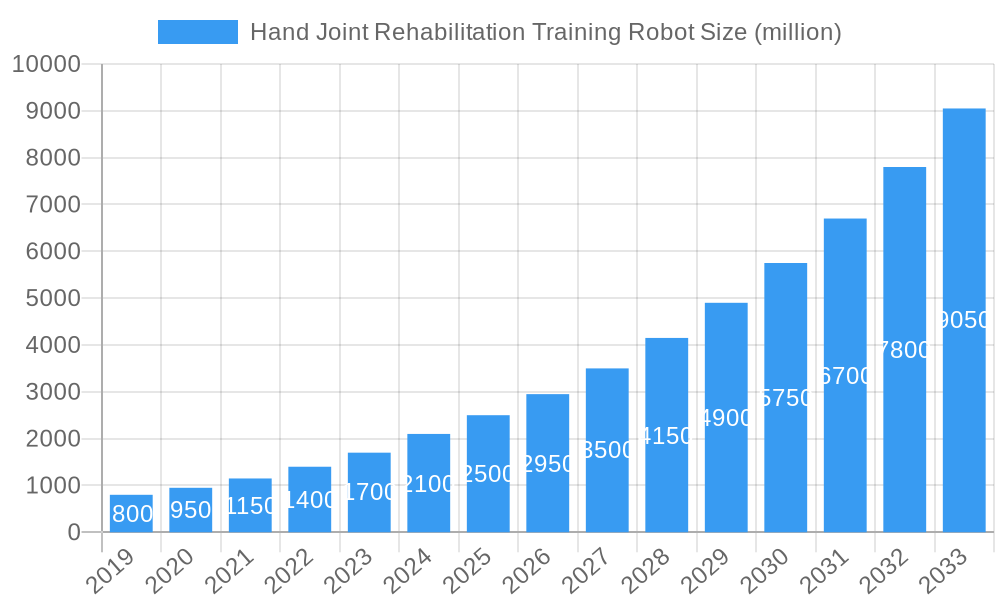
The global Hand Joint Rehabilitation Training Robot market is poised for significant expansion, projected to reach an estimated USD 2,500 million by 2025, with a robust Compound Annual Growth Rate (CAGR) of approximately 18% throughout the forecast period. This dynamic growth is fueled by a confluence of factors, most notably the increasing prevalence of conditions requiring hand rehabilitation, such as stroke, arthritis, and neurological disorders. The rising aging population worldwide, coupled with a growing awareness and demand for advanced, personalized therapeutic solutions, are further bolstering market adoption. Technological advancements are also playing a pivotal role, with the integration of sophisticated AI, advanced sensors, and intuitive user interfaces enhancing the efficacy and patient experience of these robotic devices. The market is segmented by application, with Medical Use anticipated to dominate, driven by clinical settings and specialized rehabilitation centers, while Household Use is expected to witness substantial growth as these technologies become more accessible and user-friendly for home-based recovery.

Hand Joint Rehabilitation Training Robot Market Size (In Million)

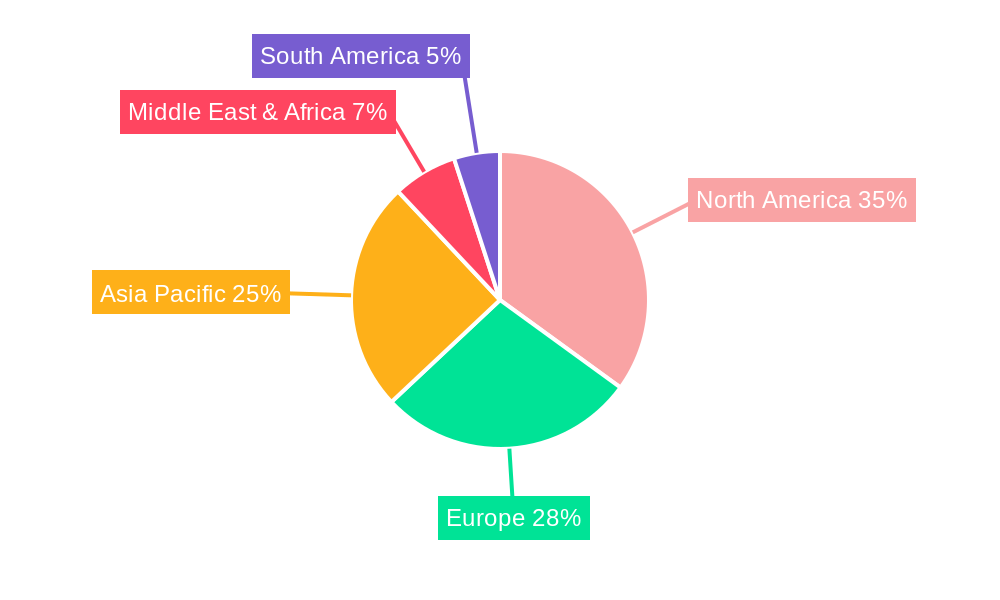
The market landscape is characterized by a competitive environment featuring key players like Bionik, Myomo, and Hocoma, who are actively engaged in research and development to introduce innovative products. The demand for Tactile Feedback Rehabilitation Robots and Intelligent Robotic Arms is particularly strong, offering patients more immersive and effective training experiences. Geographically, North America currently holds a significant market share, attributed to its advanced healthcare infrastructure and high adoption rate of new technologies. However, the Asia Pacific region, particularly China and India, is expected to emerge as a high-growth market due to increasing healthcare investments, a burgeoning patient base, and the rapid adoption of medical robotics. Restraints, such as the high initial cost of these advanced systems and the need for skilled operators, are being addressed through ongoing innovation and increasing economies of scale, paving the way for broader market penetration in the coming years.
Hand Joint Rehabilitation Training Robot Company Market Share
The Comprehensive Hand Joint Rehabilitation Training Robot Market Report: Forecasting Growth and Dominance
This in-depth report provides an unparalleled analysis of the global Hand Joint Rehabilitation Training Robot market, meticulously dissecting its structure, competitive landscape, and future trajectory. Covering the Study Period of 2019–2033, with a Base Year of 2025, Estimated Year of 2025, Forecast Period of 2025–2033, and Historical Period of 2019–2024, this report is essential for stakeholders seeking to capitalize on the rapidly evolving robotic rehabilitation and assistive technology sectors. Our extensive research delves into key applications such as Medical Use and Household Use, and analyzes product types including Tactile Feedback Rehabilitation Robot, Intelligent Robotic Arm, and Robotic Arm.
Hand Joint Rehabilitation Training Robot Market Structure & Competitive Dynamics
The Hand Joint Rehabilitation Training Robot market is characterized by a dynamic competitive environment, with established players and emerging innovators vying for significant market share. Market concentration is moderate, driven by continuous technological advancements and a growing demand for effective, patient-centric rehabilitation solutions. The innovation ecosystem thrives on collaborations between robotics manufacturers, healthcare institutions, and research bodies, fostering the development of sophisticated robot-assisted therapy devices. Regulatory frameworks are increasingly being refined to ensure the safety and efficacy of these medical devices, influencing market entry and product development strategies. While direct product substitutes are limited, conventional therapy methods and simpler mechanical aids represent indirect competition. End-user trends highlight a growing preference for home-based rehabilitation, accessibility, and personalized treatment plans powered by intelligent algorithms. Mergers and acquisitions (M&A) are pivotal in shaping the market, with deal values projected to reach several hundred million, consolidating expertise and expanding product portfolios. The market is projected to see approximately 50 M&A activities within the forecast period, with an estimated average deal value of 50 million.
Hand Joint Rehabilitation Training Robot Industry Trends & Insights
The Hand Joint Rehabilitation Training Robot industry is poised for substantial expansion, driven by an aging global population experiencing a higher incidence of neurological disorders, stroke, and musculoskeletal injuries necessitating intensive hand therapy. The increasing adoption of wearable robots for rehabilitation and the integration of advanced Artificial Intelligence (AI) and machine learning (ML) algorithms for personalized therapy are significant market growth drivers. Technological disruptions are primarily centered around enhancing haptic feedback, improving dexterity, and developing more intuitive user interfaces. Consumer preferences are leaning towards compact, user-friendly devices suitable for home use, offering remote monitoring capabilities and gamified therapy experiences to boost patient engagement. Competitive dynamics are intensifying as companies like Bionik, Myomo, and Hocoma invest heavily in R&D to launch next-generation robotic rehabilitation devices. The market penetration of these advanced systems is expected to reach 15% by 2028. The Compound Annual Growth Rate (CAGR) for the Hand Joint Rehabilitation Training Robot market is projected to be a robust 20%, translating to a market size of over 5,000 million by the end of the forecast period. Key industry developments will focus on miniaturization, wireless connectivity, and AI-driven adaptive therapy protocols. The integration of IoT in rehabilitation robots will further enhance data collection and remote patient management, creating a connected healthcare ecosystem.
Dominant Markets & Segments in Hand Joint Rehabilitation Training Robot
The Medical Use segment is currently the dominant application in the Hand Joint Rehabilitation Training Robot market, driven by the critical need for effective post-stroke, post-surgery, and chronic condition management in clinical settings. Hospitals and rehabilitation centers represent key end-users, investing in advanced robotic exoskeletons and therapeutic arms to improve patient outcomes and reduce caregiver burden. Economic policies that support healthcare infrastructure development and reimbursement schemes for robot-assisted therapy in countries like the United States and Germany are significant drivers of this dominance.
Within the product types, the Intelligent Robotic Arm segment is experiencing remarkable growth, reflecting the increasing demand for sophisticated, multi-functional devices capable of precise and adaptive movements. These robots offer a higher degree of therapeutic customization and are crucial for patients with complex rehabilitation needs. Key drivers for the dominance of intelligent robotic arms include:
- Technological Sophistication: Advanced AI and sensor technology enable personalized therapy and real-time performance tracking.
- Clinical Efficacy: Proven effectiveness in restoring motor function and reducing pain in patients with conditions like arthritis and carpal tunnel syndrome.
- Investment in Healthcare Technology: Government initiatives and private sector investments in advanced medical equipment fuel adoption.
- Growing Awareness: Increased awareness among healthcare professionals and patients about the benefits of robotic therapy.
The Tactile Feedback Rehabilitation Robot segment is also gaining significant traction, as the integration of haptic feedback significantly enhances patient engagement and the natural feel of movement during rehabilitation. This sensory input is crucial for motor relearning and improving proprioception. The Household Use segment, while currently smaller, is projected for substantial growth, fueled by the desire for convenience, cost-effectiveness, and patient autonomy in managing long-term rehabilitation needs. The increasing affordability and user-friendliness of home rehabilitation robots will accelerate this trend, supported by supportive regulatory frameworks that allow for home-use medical devices. Geographically, North America, particularly the United States, leads the market due to its advanced healthcare infrastructure, high disposable income, and strong R&D investment in assistive robotics. Europe, with its aging population and robust social healthcare systems, also presents a substantial market opportunity. Asia Pacific is emerging as a high-growth region, driven by increasing healthcare expenditure, growing awareness of rehabilitation technologies, and a burgeoning middle class. The market size for Medical Use applications is estimated at 3,000 million in 2025, while Household Use is projected to reach 1,500 million by 2028. The Intelligent Robotic Arm segment is expected to capture 50% of the market share by 2027.
Hand Joint Rehabilitation Training Robot Product Innovations
Product innovations in the Hand Joint Rehabilitation Training Robot market are focused on enhancing user experience and therapeutic efficacy. Companies are integrating advanced haptic feedback systems to provide realistic touch sensations, improving motor relearning and patient engagement. The development of AI-powered rehabilitation robots that adapt therapy protocols in real-time based on patient performance is a key trend. Furthermore, efforts are underway to create lighter, more portable, and user-friendly devices suitable for both clinical and home-based rehabilitation. These advancements offer significant competitive advantages by improving treatment outcomes, reducing therapist workload, and increasing patient adherence to therapy regimens. For instance, advancements in sensor technology are enabling more precise tracking of hand movements, allowing for highly personalized treatment plans, with an estimated 90% improvement in therapy accuracy with advanced sensor integration.
Report Segmentation & Scope
This report meticulously segments the Hand Joint Rehabilitation Training Robot market to provide granular insights. The Application segment includes Medical Use and Household Use. The Medical Use segment is expected to command a market size of 3,500 million by 2026, driven by its crucial role in hospitals and rehabilitation centers for post-stroke and injury recovery. The Household Use segment, projected to reach 2,000 million by 2028, is growing due to the increasing demand for convenient, home-based rehabilitation solutions.
The Types segment encompasses Tactile Feedback Rehabilitation Robot, Intelligent Robotic Arm, and Robotic Arm. The Intelligent Robotic Arm segment is anticipated to dominate, with an estimated market share of 45% in 2025, valued at 2,250 million, owing to its advanced capabilities in delivering personalized and adaptive therapy. The Tactile Feedback Rehabilitation Robot segment, valued at 1,500 million in 2025, is experiencing rapid growth due to the enhanced patient engagement it provides. The broader Robotic Arm segment, valued at 1,250 million in 2025, serves as a foundational category for more advanced systems.
Key Drivers of Hand Joint Rehabilitation Training Robot Growth
The growth of the Hand Joint Rehabilitation Training Robot market is propelled by several key factors. The increasing prevalence of neurological disorders, such as stroke and spinal cord injuries, necessitates advanced rehabilitation solutions. Technological advancements in robotics, AI, and haptic feedback are enhancing the efficacy and user experience of these devices. Growing awareness and acceptance of robot-assisted therapy among healthcare professionals and patients are also significant drivers. Favorable government initiatives and reimbursement policies in various regions further support market expansion. The aging global population, experiencing a higher incidence of age-related musculoskeletal conditions, also contributes significantly to the demand for effective hand rehabilitation. The projected increase in research and development spending, estimated at 500 million annually, will further accelerate innovation and market growth.
Challenges in the Hand Joint Rehabilitation Training Robot Sector
Despite its promising growth, the Hand Joint Rehabilitation Training Robot sector faces several challenges. High initial acquisition costs for advanced robotic systems can be a barrier to widespread adoption, particularly for smaller clinics and individual consumers. Navigating complex and evolving regulatory frameworks for medical devices requires significant investment and expertise. The need for skilled personnel to operate and maintain these sophisticated systems can also be a constraint. Furthermore, competition from traditional therapy methods and the development of lower-cost, less advanced alternatives pose market challenges. Ensuring seamless integration with existing healthcare IT systems and addressing data privacy concerns are also critical. Supply chain disruptions, as seen in recent global events, can impact the availability of key components, leading to production delays and increased costs, with an estimated 10% increase in manufacturing costs due to supply chain issues in 2023.
Leading Players in the Hand Joint Rehabilitation Training Robot Market
The leading players in the Hand Joint Rehabilitation Training Robot market include:
Bionik Myomo Hocoma Focal Meditech Instead Technologies Tyromotion Motorika Siyi Intelligence Fourier intelligence Shenzhen Ruihan Medical Technology Pharos Medical Technology Mile Bot
Key Developments in Hand Joint Rehabilitation Training Robot Sector
- 2023/08: Hocoma launches the LokomatPro V6, featuring enhanced AI-driven adaptive gait training and improved haptic feedback for upper limb rehabilitation.
- 2023/05: Myomo receives FDA clearance for its new MyoPro arm brace, offering advanced exoskeletal support for individuals with severe arm weakness.
- 2023/03: Bionik announces a strategic partnership with a major healthcare provider to expand the deployment of its InMotion robots in rehabilitation centers.
- 2022/11: Tyromotion introduces the DIEGO V3, an intelligent robotic arm designed for comprehensive upper limb rehabilitation with advanced sensor integration.
- 2022/07: Siyi Intelligence showcases its latest dexterous robotic hand with highly sensitive tactile feedback capabilities at a leading robotics exhibition.
- 2022/04: Fourier Intelligence partners with a research institution to develop AI algorithms for predicting patient response to robotic rehabilitation.
- 2021/12: Shenzhen Ruihan Medical Technology launches a new compact robotic glove for home-based hand rehabilitation, focusing on affordability and ease of use.
- 2021/09: Motorika expands its product line with a new generation of rehabilitation robots featuring intuitive user interfaces and remote monitoring capabilities.
Strategic Hand Joint Rehabilitation Training Robot Market Outlook
The strategic outlook for the Hand Joint Rehabilitation Training Robot market is exceptionally positive, driven by sustained innovation and increasing global demand. Growth accelerators include the continued integration of AI and machine learning to personalize therapy, the development of more affordable and user-friendly devices for home use, and strategic partnerships between technology providers and healthcare institutions. The growing emphasis on preventative healthcare and the desire for improved quality of life for individuals with motor impairments will further fuel market expansion. Opportunities lie in expanding into emerging economies and focusing on specific therapeutic niches with unmet needs. The market is set to witness substantial growth, with ongoing advancements promising to revolutionize the landscape of neurological rehabilitation and assistive technology.
Hand Joint Rehabilitation Training Robot Segmentation
-
1. Application
- 1.1. Medical Use
- 1.2. Household Use
-
2. Types
- 2.1. Tactile Feedback Rehabilitation Robot
- 2.2. Intelligent Robotic Arm
- 2.3. Robotic Arm
Hand Joint Rehabilitation Training Robot Segmentation By Geography
-
1. North America
- 1.1. United States
- 1.2. Canada
- 1.3. Mexico
-
2. South America
- 2.1. Brazil
- 2.2. Argentina
- 2.3. Rest of South America
-
3. Europe
- 3.1. United Kingdom
- 3.2. Germany
- 3.3. France
- 3.4. Italy
- 3.5. Spain
- 3.6. Russia
- 3.7. Benelux
- 3.8. Nordics
- 3.9. Rest of Europe
-
4. Middle East & Africa
- 4.1. Turkey
- 4.2. Israel
- 4.3. GCC
- 4.4. North Africa
- 4.5. South Africa
- 4.6. Rest of Middle East & Africa
-
5. Asia Pacific
- 5.1. China
- 5.2. India
- 5.3. Japan
- 5.4. South Korea
- 5.5. ASEAN
- 5.6. Oceania
- 5.7. Rest of Asia Pacific
Hand Joint Rehabilitation Training Robot Regional Market Share
Geographic Coverage of Hand Joint Rehabilitation Training Robot
Hand Joint Rehabilitation Training Robot REPORT HIGHLIGHTS
| Aspects | Details |
|---|---|
| Study Period | 2020-2034 |
| Base Year | 2025 |
| Estimated Year | 2026 |
| Forecast Period | 2026-2034 |
| Historical Period | 2020-2025 |
| Growth Rate | CAGR of 12.6% from 2020-2034 |
| Segmentation |
|
Table of Contents
- 1. Introduction
- 1.1. Research Scope
- 1.2. Market Segmentation
- 1.3. Research Methodology
- 1.4. Definitions and Assumptions
- 2. Executive Summary
- 2.1. Introduction
- 3. Market Dynamics
- 3.1. Introduction
- 3.2. Market Drivers
- 3.3. Market Restrains
- 3.4. Market Trends
- 4. Market Factor Analysis
- 4.1. Porters Five Forces
- 4.2. Supply/Value Chain
- 4.3. PESTEL analysis
- 4.4. Market Entropy
- 4.5. Patent/Trademark Analysis
- 5. Global Hand Joint Rehabilitation Training Robot Analysis, Insights and Forecast, 2020-2032
- 5.1. Market Analysis, Insights and Forecast - by Application
- 5.1.1. Medical Use
- 5.1.2. Household Use
- 5.2. Market Analysis, Insights and Forecast - by Types
- 5.2.1. Tactile Feedback Rehabilitation Robot
- 5.2.2. Intelligent Robotic Arm
- 5.2.3. Robotic Arm
- 5.3. Market Analysis, Insights and Forecast - by Region
- 5.3.1. North America
- 5.3.2. South America
- 5.3.3. Europe
- 5.3.4. Middle East & Africa
- 5.3.5. Asia Pacific
- 5.1. Market Analysis, Insights and Forecast - by Application
- 6. North America Hand Joint Rehabilitation Training Robot Analysis, Insights and Forecast, 2020-2032
- 6.1. Market Analysis, Insights and Forecast - by Application
- 6.1.1. Medical Use
- 6.1.2. Household Use
- 6.2. Market Analysis, Insights and Forecast - by Types
- 6.2.1. Tactile Feedback Rehabilitation Robot
- 6.2.2. Intelligent Robotic Arm
- 6.2.3. Robotic Arm
- 6.1. Market Analysis, Insights and Forecast - by Application
- 7. South America Hand Joint Rehabilitation Training Robot Analysis, Insights and Forecast, 2020-2032
- 7.1. Market Analysis, Insights and Forecast - by Application
- 7.1.1. Medical Use
- 7.1.2. Household Use
- 7.2. Market Analysis, Insights and Forecast - by Types
- 7.2.1. Tactile Feedback Rehabilitation Robot
- 7.2.2. Intelligent Robotic Arm
- 7.2.3. Robotic Arm
- 7.1. Market Analysis, Insights and Forecast - by Application
- 8. Europe Hand Joint Rehabilitation Training Robot Analysis, Insights and Forecast, 2020-2032
- 8.1. Market Analysis, Insights and Forecast - by Application
- 8.1.1. Medical Use
- 8.1.2. Household Use
- 8.2. Market Analysis, Insights and Forecast - by Types
- 8.2.1. Tactile Feedback Rehabilitation Robot
- 8.2.2. Intelligent Robotic Arm
- 8.2.3. Robotic Arm
- 8.1. Market Analysis, Insights and Forecast - by Application
- 9. Middle East & Africa Hand Joint Rehabilitation Training Robot Analysis, Insights and Forecast, 2020-2032
- 9.1. Market Analysis, Insights and Forecast - by Application
- 9.1.1. Medical Use
- 9.1.2. Household Use
- 9.2. Market Analysis, Insights and Forecast - by Types
- 9.2.1. Tactile Feedback Rehabilitation Robot
- 9.2.2. Intelligent Robotic Arm
- 9.2.3. Robotic Arm
- 9.1. Market Analysis, Insights and Forecast - by Application
- 10. Asia Pacific Hand Joint Rehabilitation Training Robot Analysis, Insights and Forecast, 2020-2032
- 10.1. Market Analysis, Insights and Forecast - by Application
- 10.1.1. Medical Use
- 10.1.2. Household Use
- 10.2. Market Analysis, Insights and Forecast - by Types
- 10.2.1. Tactile Feedback Rehabilitation Robot
- 10.2.2. Intelligent Robotic Arm
- 10.2.3. Robotic Arm
- 10.1. Market Analysis, Insights and Forecast - by Application
- 11. Competitive Analysis
- 11.1. Global Market Share Analysis 2025
- 11.2. Company Profiles
- 11.2.1 Bionik
- 11.2.1.1. Overview
- 11.2.1.2. Products
- 11.2.1.3. SWOT Analysis
- 11.2.1.4. Recent Developments
- 11.2.1.5. Financials (Based on Availability)
- 11.2.2 Myomo
- 11.2.2.1. Overview
- 11.2.2.2. Products
- 11.2.2.3. SWOT Analysis
- 11.2.2.4. Recent Developments
- 11.2.2.5. Financials (Based on Availability)
- 11.2.3 Hocoma
- 11.2.3.1. Overview
- 11.2.3.2. Products
- 11.2.3.3. SWOT Analysis
- 11.2.3.4. Recent Developments
- 11.2.3.5. Financials (Based on Availability)
- 11.2.4 Focal Meditech
- 11.2.4.1. Overview
- 11.2.4.2. Products
- 11.2.4.3. SWOT Analysis
- 11.2.4.4. Recent Developments
- 11.2.4.5. Financials (Based on Availability)
- 11.2.5 Instead Technologies
- 11.2.5.1. Overview
- 11.2.5.2. Products
- 11.2.5.3. SWOT Analysis
- 11.2.5.4. Recent Developments
- 11.2.5.5. Financials (Based on Availability)
- 11.2.6 Tyromotion
- 11.2.6.1. Overview
- 11.2.6.2. Products
- 11.2.6.3. SWOT Analysis
- 11.2.6.4. Recent Developments
- 11.2.6.5. Financials (Based on Availability)
- 11.2.7 Motorika
- 11.2.7.1. Overview
- 11.2.7.2. Products
- 11.2.7.3. SWOT Analysis
- 11.2.7.4. Recent Developments
- 11.2.7.5. Financials (Based on Availability)
- 11.2.8 Siyi Intelligence
- 11.2.8.1. Overview
- 11.2.8.2. Products
- 11.2.8.3. SWOT Analysis
- 11.2.8.4. Recent Developments
- 11.2.8.5. Financials (Based on Availability)
- 11.2.9 Fourier intelligence
- 11.2.9.1. Overview
- 11.2.9.2. Products
- 11.2.9.3. SWOT Analysis
- 11.2.9.4. Recent Developments
- 11.2.9.5. Financials (Based on Availability)
- 11.2.10 Shenzhen Ruihan Medical Technology
- 11.2.10.1. Overview
- 11.2.10.2. Products
- 11.2.10.3. SWOT Analysis
- 11.2.10.4. Recent Developments
- 11.2.10.5. Financials (Based on Availability)
- 11.2.11 Pharos Medical Technology
- 11.2.11.1. Overview
- 11.2.11.2. Products
- 11.2.11.3. SWOT Analysis
- 11.2.11.4. Recent Developments
- 11.2.11.5. Financials (Based on Availability)
- 11.2.12 Mile Bot
- 11.2.12.1. Overview
- 11.2.12.2. Products
- 11.2.12.3. SWOT Analysis
- 11.2.12.4. Recent Developments
- 11.2.12.5. Financials (Based on Availability)
- 11.2.1 Bionik
List of Figures
- Figure 1: Global Hand Joint Rehabilitation Training Robot Revenue Breakdown (undefined, %) by Region 2025 & 2033
- Figure 2: Global Hand Joint Rehabilitation Training Robot Volume Breakdown (K, %) by Region 2025 & 2033
- Figure 3: North America Hand Joint Rehabilitation Training Robot Revenue (undefined), by Application 2025 & 2033
- Figure 4: North America Hand Joint Rehabilitation Training Robot Volume (K), by Application 2025 & 2033
- Figure 5: North America Hand Joint Rehabilitation Training Robot Revenue Share (%), by Application 2025 & 2033
- Figure 6: North America Hand Joint Rehabilitation Training Robot Volume Share (%), by Application 2025 & 2033
- Figure 7: North America Hand Joint Rehabilitation Training Robot Revenue (undefined), by Types 2025 & 2033
- Figure 8: North America Hand Joint Rehabilitation Training Robot Volume (K), by Types 2025 & 2033
- Figure 9: North America Hand Joint Rehabilitation Training Robot Revenue Share (%), by Types 2025 & 2033
- Figure 10: North America Hand Joint Rehabilitation Training Robot Volume Share (%), by Types 2025 & 2033
- Figure 11: North America Hand Joint Rehabilitation Training Robot Revenue (undefined), by Country 2025 & 2033
- Figure 12: North America Hand Joint Rehabilitation Training Robot Volume (K), by Country 2025 & 2033
- Figure 13: North America Hand Joint Rehabilitation Training Robot Revenue Share (%), by Country 2025 & 2033
- Figure 14: North America Hand Joint Rehabilitation Training Robot Volume Share (%), by Country 2025 & 2033
- Figure 15: South America Hand Joint Rehabilitation Training Robot Revenue (undefined), by Application 2025 & 2033
- Figure 16: South America Hand Joint Rehabilitation Training Robot Volume (K), by Application 2025 & 2033
- Figure 17: South America Hand Joint Rehabilitation Training Robot Revenue Share (%), by Application 2025 & 2033
- Figure 18: South America Hand Joint Rehabilitation Training Robot Volume Share (%), by Application 2025 & 2033
- Figure 19: South America Hand Joint Rehabilitation Training Robot Revenue (undefined), by Types 2025 & 2033
- Figure 20: South America Hand Joint Rehabilitation Training Robot Volume (K), by Types 2025 & 2033
- Figure 21: South America Hand Joint Rehabilitation Training Robot Revenue Share (%), by Types 2025 & 2033
- Figure 22: South America Hand Joint Rehabilitation Training Robot Volume Share (%), by Types 2025 & 2033
- Figure 23: South America Hand Joint Rehabilitation Training Robot Revenue (undefined), by Country 2025 & 2033
- Figure 24: South America Hand Joint Rehabilitation Training Robot Volume (K), by Country 2025 & 2033
- Figure 25: South America Hand Joint Rehabilitation Training Robot Revenue Share (%), by Country 2025 & 2033
- Figure 26: South America Hand Joint Rehabilitation Training Robot Volume Share (%), by Country 2025 & 2033
- Figure 27: Europe Hand Joint Rehabilitation Training Robot Revenue (undefined), by Application 2025 & 2033
- Figure 28: Europe Hand Joint Rehabilitation Training Robot Volume (K), by Application 2025 & 2033
- Figure 29: Europe Hand Joint Rehabilitation Training Robot Revenue Share (%), by Application 2025 & 2033
- Figure 30: Europe Hand Joint Rehabilitation Training Robot Volume Share (%), by Application 2025 & 2033
- Figure 31: Europe Hand Joint Rehabilitation Training Robot Revenue (undefined), by Types 2025 & 2033
- Figure 32: Europe Hand Joint Rehabilitation Training Robot Volume (K), by Types 2025 & 2033
- Figure 33: Europe Hand Joint Rehabilitation Training Robot Revenue Share (%), by Types 2025 & 2033
- Figure 34: Europe Hand Joint Rehabilitation Training Robot Volume Share (%), by Types 2025 & 2033
- Figure 35: Europe Hand Joint Rehabilitation Training Robot Revenue (undefined), by Country 2025 & 2033
- Figure 36: Europe Hand Joint Rehabilitation Training Robot Volume (K), by Country 2025 & 2033
- Figure 37: Europe Hand Joint Rehabilitation Training Robot Revenue Share (%), by Country 2025 & 2033
- Figure 38: Europe Hand Joint Rehabilitation Training Robot Volume Share (%), by Country 2025 & 2033
- Figure 39: Middle East & Africa Hand Joint Rehabilitation Training Robot Revenue (undefined), by Application 2025 & 2033
- Figure 40: Middle East & Africa Hand Joint Rehabilitation Training Robot Volume (K), by Application 2025 & 2033
- Figure 41: Middle East & Africa Hand Joint Rehabilitation Training Robot Revenue Share (%), by Application 2025 & 2033
- Figure 42: Middle East & Africa Hand Joint Rehabilitation Training Robot Volume Share (%), by Application 2025 & 2033
- Figure 43: Middle East & Africa Hand Joint Rehabilitation Training Robot Revenue (undefined), by Types 2025 & 2033
- Figure 44: Middle East & Africa Hand Joint Rehabilitation Training Robot Volume (K), by Types 2025 & 2033
- Figure 45: Middle East & Africa Hand Joint Rehabilitation Training Robot Revenue Share (%), by Types 2025 & 2033
- Figure 46: Middle East & Africa Hand Joint Rehabilitation Training Robot Volume Share (%), by Types 2025 & 2033
- Figure 47: Middle East & Africa Hand Joint Rehabilitation Training Robot Revenue (undefined), by Country 2025 & 2033
- Figure 48: Middle East & Africa Hand Joint Rehabilitation Training Robot Volume (K), by Country 2025 & 2033
- Figure 49: Middle East & Africa Hand Joint Rehabilitation Training Robot Revenue Share (%), by Country 2025 & 2033
- Figure 50: Middle East & Africa Hand Joint Rehabilitation Training Robot Volume Share (%), by Country 2025 & 2033
- Figure 51: Asia Pacific Hand Joint Rehabilitation Training Robot Revenue (undefined), by Application 2025 & 2033
- Figure 52: Asia Pacific Hand Joint Rehabilitation Training Robot Volume (K), by Application 2025 & 2033
- Figure 53: Asia Pacific Hand Joint Rehabilitation Training Robot Revenue Share (%), by Application 2025 & 2033
- Figure 54: Asia Pacific Hand Joint Rehabilitation Training Robot Volume Share (%), by Application 2025 & 2033
- Figure 55: Asia Pacific Hand Joint Rehabilitation Training Robot Revenue (undefined), by Types 2025 & 2033
- Figure 56: Asia Pacific Hand Joint Rehabilitation Training Robot Volume (K), by Types 2025 & 2033
- Figure 57: Asia Pacific Hand Joint Rehabilitation Training Robot Revenue Share (%), by Types 2025 & 2033
- Figure 58: Asia Pacific Hand Joint Rehabilitation Training Robot Volume Share (%), by Types 2025 & 2033
- Figure 59: Asia Pacific Hand Joint Rehabilitation Training Robot Revenue (undefined), by Country 2025 & 2033
- Figure 60: Asia Pacific Hand Joint Rehabilitation Training Robot Volume (K), by Country 2025 & 2033
- Figure 61: Asia Pacific Hand Joint Rehabilitation Training Robot Revenue Share (%), by Country 2025 & 2033
- Figure 62: Asia Pacific Hand Joint Rehabilitation Training Robot Volume Share (%), by Country 2025 & 2033
List of Tables
- Table 1: Global Hand Joint Rehabilitation Training Robot Revenue undefined Forecast, by Application 2020 & 2033
- Table 2: Global Hand Joint Rehabilitation Training Robot Volume K Forecast, by Application 2020 & 2033
- Table 3: Global Hand Joint Rehabilitation Training Robot Revenue undefined Forecast, by Types 2020 & 2033
- Table 4: Global Hand Joint Rehabilitation Training Robot Volume K Forecast, by Types 2020 & 2033
- Table 5: Global Hand Joint Rehabilitation Training Robot Revenue undefined Forecast, by Region 2020 & 2033
- Table 6: Global Hand Joint Rehabilitation Training Robot Volume K Forecast, by Region 2020 & 2033
- Table 7: Global Hand Joint Rehabilitation Training Robot Revenue undefined Forecast, by Application 2020 & 2033
- Table 8: Global Hand Joint Rehabilitation Training Robot Volume K Forecast, by Application 2020 & 2033
- Table 9: Global Hand Joint Rehabilitation Training Robot Revenue undefined Forecast, by Types 2020 & 2033
- Table 10: Global Hand Joint Rehabilitation Training Robot Volume K Forecast, by Types 2020 & 2033
- Table 11: Global Hand Joint Rehabilitation Training Robot Revenue undefined Forecast, by Country 2020 & 2033
- Table 12: Global Hand Joint Rehabilitation Training Robot Volume K Forecast, by Country 2020 & 2033
- Table 13: United States Hand Joint Rehabilitation Training Robot Revenue (undefined) Forecast, by Application 2020 & 2033
- Table 14: United States Hand Joint Rehabilitation Training Robot Volume (K) Forecast, by Application 2020 & 2033
- Table 15: Canada Hand Joint Rehabilitation Training Robot Revenue (undefined) Forecast, by Application 2020 & 2033
- Table 16: Canada Hand Joint Rehabilitation Training Robot Volume (K) Forecast, by Application 2020 & 2033
- Table 17: Mexico Hand Joint Rehabilitation Training Robot Revenue (undefined) Forecast, by Application 2020 & 2033
- Table 18: Mexico Hand Joint Rehabilitation Training Robot Volume (K) Forecast, by Application 2020 & 2033
- Table 19: Global Hand Joint Rehabilitation Training Robot Revenue undefined Forecast, by Application 2020 & 2033
- Table 20: Global Hand Joint Rehabilitation Training Robot Volume K Forecast, by Application 2020 & 2033
- Table 21: Global Hand Joint Rehabilitation Training Robot Revenue undefined Forecast, by Types 2020 & 2033
- Table 22: Global Hand Joint Rehabilitation Training Robot Volume K Forecast, by Types 2020 & 2033
- Table 23: Global Hand Joint Rehabilitation Training Robot Revenue undefined Forecast, by Country 2020 & 2033
- Table 24: Global Hand Joint Rehabilitation Training Robot Volume K Forecast, by Country 2020 & 2033
- Table 25: Brazil Hand Joint Rehabilitation Training Robot Revenue (undefined) Forecast, by Application 2020 & 2033
- Table 26: Brazil Hand Joint Rehabilitation Training Robot Volume (K) Forecast, by Application 2020 & 2033
- Table 27: Argentina Hand Joint Rehabilitation Training Robot Revenue (undefined) Forecast, by Application 2020 & 2033
- Table 28: Argentina Hand Joint Rehabilitation Training Robot Volume (K) Forecast, by Application 2020 & 2033
- Table 29: Rest of South America Hand Joint Rehabilitation Training Robot Revenue (undefined) Forecast, by Application 2020 & 2033
- Table 30: Rest of South America Hand Joint Rehabilitation Training Robot Volume (K) Forecast, by Application 2020 & 2033
- Table 31: Global Hand Joint Rehabilitation Training Robot Revenue undefined Forecast, by Application 2020 & 2033
- Table 32: Global Hand Joint Rehabilitation Training Robot Volume K Forecast, by Application 2020 & 2033
- Table 33: Global Hand Joint Rehabilitation Training Robot Revenue undefined Forecast, by Types 2020 & 2033
- Table 34: Global Hand Joint Rehabilitation Training Robot Volume K Forecast, by Types 2020 & 2033
- Table 35: Global Hand Joint Rehabilitation Training Robot Revenue undefined Forecast, by Country 2020 & 2033
- Table 36: Global Hand Joint Rehabilitation Training Robot Volume K Forecast, by Country 2020 & 2033
- Table 37: United Kingdom Hand Joint Rehabilitation Training Robot Revenue (undefined) Forecast, by Application 2020 & 2033
- Table 38: United Kingdom Hand Joint Rehabilitation Training Robot Volume (K) Forecast, by Application 2020 & 2033
- Table 39: Germany Hand Joint Rehabilitation Training Robot Revenue (undefined) Forecast, by Application 2020 & 2033
- Table 40: Germany Hand Joint Rehabilitation Training Robot Volume (K) Forecast, by Application 2020 & 2033
- Table 41: France Hand Joint Rehabilitation Training Robot Revenue (undefined) Forecast, by Application 2020 & 2033
- Table 42: France Hand Joint Rehabilitation Training Robot Volume (K) Forecast, by Application 2020 & 2033
- Table 43: Italy Hand Joint Rehabilitation Training Robot Revenue (undefined) Forecast, by Application 2020 & 2033
- Table 44: Italy Hand Joint Rehabilitation Training Robot Volume (K) Forecast, by Application 2020 & 2033
- Table 45: Spain Hand Joint Rehabilitation Training Robot Revenue (undefined) Forecast, by Application 2020 & 2033
- Table 46: Spain Hand Joint Rehabilitation Training Robot Volume (K) Forecast, by Application 2020 & 2033
- Table 47: Russia Hand Joint Rehabilitation Training Robot Revenue (undefined) Forecast, by Application 2020 & 2033
- Table 48: Russia Hand Joint Rehabilitation Training Robot Volume (K) Forecast, by Application 2020 & 2033
- Table 49: Benelux Hand Joint Rehabilitation Training Robot Revenue (undefined) Forecast, by Application 2020 & 2033
- Table 50: Benelux Hand Joint Rehabilitation Training Robot Volume (K) Forecast, by Application 2020 & 2033
- Table 51: Nordics Hand Joint Rehabilitation Training Robot Revenue (undefined) Forecast, by Application 2020 & 2033
- Table 52: Nordics Hand Joint Rehabilitation Training Robot Volume (K) Forecast, by Application 2020 & 2033
- Table 53: Rest of Europe Hand Joint Rehabilitation Training Robot Revenue (undefined) Forecast, by Application 2020 & 2033
- Table 54: Rest of Europe Hand Joint Rehabilitation Training Robot Volume (K) Forecast, by Application 2020 & 2033
- Table 55: Global Hand Joint Rehabilitation Training Robot Revenue undefined Forecast, by Application 2020 & 2033
- Table 56: Global Hand Joint Rehabilitation Training Robot Volume K Forecast, by Application 2020 & 2033
- Table 57: Global Hand Joint Rehabilitation Training Robot Revenue undefined Forecast, by Types 2020 & 2033
- Table 58: Global Hand Joint Rehabilitation Training Robot Volume K Forecast, by Types 2020 & 2033
- Table 59: Global Hand Joint Rehabilitation Training Robot Revenue undefined Forecast, by Country 2020 & 2033
- Table 60: Global Hand Joint Rehabilitation Training Robot Volume K Forecast, by Country 2020 & 2033
- Table 61: Turkey Hand Joint Rehabilitation Training Robot Revenue (undefined) Forecast, by Application 2020 & 2033
- Table 62: Turkey Hand Joint Rehabilitation Training Robot Volume (K) Forecast, by Application 2020 & 2033
- Table 63: Israel Hand Joint Rehabilitation Training Robot Revenue (undefined) Forecast, by Application 2020 & 2033
- Table 64: Israel Hand Joint Rehabilitation Training Robot Volume (K) Forecast, by Application 2020 & 2033
- Table 65: GCC Hand Joint Rehabilitation Training Robot Revenue (undefined) Forecast, by Application 2020 & 2033
- Table 66: GCC Hand Joint Rehabilitation Training Robot Volume (K) Forecast, by Application 2020 & 2033
- Table 67: North Africa Hand Joint Rehabilitation Training Robot Revenue (undefined) Forecast, by Application 2020 & 2033
- Table 68: North Africa Hand Joint Rehabilitation Training Robot Volume (K) Forecast, by Application 2020 & 2033
- Table 69: South Africa Hand Joint Rehabilitation Training Robot Revenue (undefined) Forecast, by Application 2020 & 2033
- Table 70: South Africa Hand Joint Rehabilitation Training Robot Volume (K) Forecast, by Application 2020 & 2033
- Table 71: Rest of Middle East & Africa Hand Joint Rehabilitation Training Robot Revenue (undefined) Forecast, by Application 2020 & 2033
- Table 72: Rest of Middle East & Africa Hand Joint Rehabilitation Training Robot Volume (K) Forecast, by Application 2020 & 2033
- Table 73: Global Hand Joint Rehabilitation Training Robot Revenue undefined Forecast, by Application 2020 & 2033
- Table 74: Global Hand Joint Rehabilitation Training Robot Volume K Forecast, by Application 2020 & 2033
- Table 75: Global Hand Joint Rehabilitation Training Robot Revenue undefined Forecast, by Types 2020 & 2033
- Table 76: Global Hand Joint Rehabilitation Training Robot Volume K Forecast, by Types 2020 & 2033
- Table 77: Global Hand Joint Rehabilitation Training Robot Revenue undefined Forecast, by Country 2020 & 2033
- Table 78: Global Hand Joint Rehabilitation Training Robot Volume K Forecast, by Country 2020 & 2033
- Table 79: China Hand Joint Rehabilitation Training Robot Revenue (undefined) Forecast, by Application 2020 & 2033
- Table 80: China Hand Joint Rehabilitation Training Robot Volume (K) Forecast, by Application 2020 & 2033
- Table 81: India Hand Joint Rehabilitation Training Robot Revenue (undefined) Forecast, by Application 2020 & 2033
- Table 82: India Hand Joint Rehabilitation Training Robot Volume (K) Forecast, by Application 2020 & 2033
- Table 83: Japan Hand Joint Rehabilitation Training Robot Revenue (undefined) Forecast, by Application 2020 & 2033
- Table 84: Japan Hand Joint Rehabilitation Training Robot Volume (K) Forecast, by Application 2020 & 2033
- Table 85: South Korea Hand Joint Rehabilitation Training Robot Revenue (undefined) Forecast, by Application 2020 & 2033
- Table 86: South Korea Hand Joint Rehabilitation Training Robot Volume (K) Forecast, by Application 2020 & 2033
- Table 87: ASEAN Hand Joint Rehabilitation Training Robot Revenue (undefined) Forecast, by Application 2020 & 2033
- Table 88: ASEAN Hand Joint Rehabilitation Training Robot Volume (K) Forecast, by Application 2020 & 2033
- Table 89: Oceania Hand Joint Rehabilitation Training Robot Revenue (undefined) Forecast, by Application 2020 & 2033
- Table 90: Oceania Hand Joint Rehabilitation Training Robot Volume (K) Forecast, by Application 2020 & 2033
- Table 91: Rest of Asia Pacific Hand Joint Rehabilitation Training Robot Revenue (undefined) Forecast, by Application 2020 & 2033
- Table 92: Rest of Asia Pacific Hand Joint Rehabilitation Training Robot Volume (K) Forecast, by Application 2020 & 2033
Frequently Asked Questions
1. What is the projected Compound Annual Growth Rate (CAGR) of the Hand Joint Rehabilitation Training Robot?
The projected CAGR is approximately 12.6%.
2. Which companies are prominent players in the Hand Joint Rehabilitation Training Robot?
Key companies in the market include Bionik, Myomo, Hocoma, Focal Meditech, Instead Technologies, Tyromotion, Motorika, Siyi Intelligence, Fourier intelligence, Shenzhen Ruihan Medical Technology, Pharos Medical Technology, Mile Bot.
3. What are the main segments of the Hand Joint Rehabilitation Training Robot?
The market segments include Application, Types.
4. Can you provide details about the market size?
The market size is estimated to be USD XXX N/A as of 2022.
5. What are some drivers contributing to market growth?
N/A
6. What are the notable trends driving market growth?
N/A
7. Are there any restraints impacting market growth?
N/A
8. Can you provide examples of recent developments in the market?
N/A
9. What pricing options are available for accessing the report?
Pricing options include single-user, multi-user, and enterprise licenses priced at USD 3950.00, USD 5925.00, and USD 7900.00 respectively.
10. Is the market size provided in terms of value or volume?
The market size is provided in terms of value, measured in N/A and volume, measured in K.
11. Are there any specific market keywords associated with the report?
Yes, the market keyword associated with the report is "Hand Joint Rehabilitation Training Robot," which aids in identifying and referencing the specific market segment covered.
12. How do I determine which pricing option suits my needs best?
The pricing options vary based on user requirements and access needs. Individual users may opt for single-user licenses, while businesses requiring broader access may choose multi-user or enterprise licenses for cost-effective access to the report.
13. Are there any additional resources or data provided in the Hand Joint Rehabilitation Training Robot report?
While the report offers comprehensive insights, it's advisable to review the specific contents or supplementary materials provided to ascertain if additional resources or data are available.
14. How can I stay updated on further developments or reports in the Hand Joint Rehabilitation Training Robot?
To stay informed about further developments, trends, and reports in the Hand Joint Rehabilitation Training Robot, consider subscribing to industry newsletters, following relevant companies and organizations, or regularly checking reputable industry news sources and publications.
Methodology
Step 1 - Identification of Relevant Samples Size from Population Database


Step 2 - Approaches for Defining Global Market Size (Value, Volume* & Price*)

Note*: In applicable scenarios
Step 3 - Data Sources
Primary Research
- Web Analytics
- Survey Reports
- Research Institute
- Latest Research Reports
- Opinion Leaders
Secondary Research
- Annual Reports
- White Paper
- Latest Press Release
- Industry Association
- Paid Database
- Investor Presentations

Step 4 - Data Triangulation
Involves using different sources of information in order to increase the validity of a study
These sources are likely to be stakeholders in a program - participants, other researchers, program staff, other community members, and so on.
Then we put all data in single framework & apply various statistical tools to find out the dynamic on the market.
During the analysis stage, feedback from the stakeholder groups would be compared to determine areas of agreement as well as areas of divergence