
Key Insights
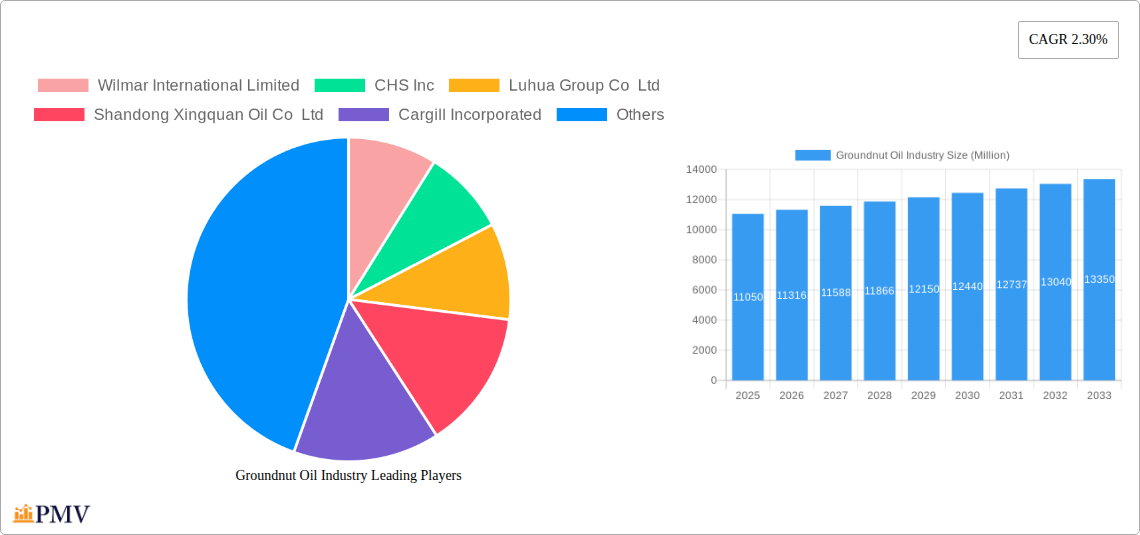
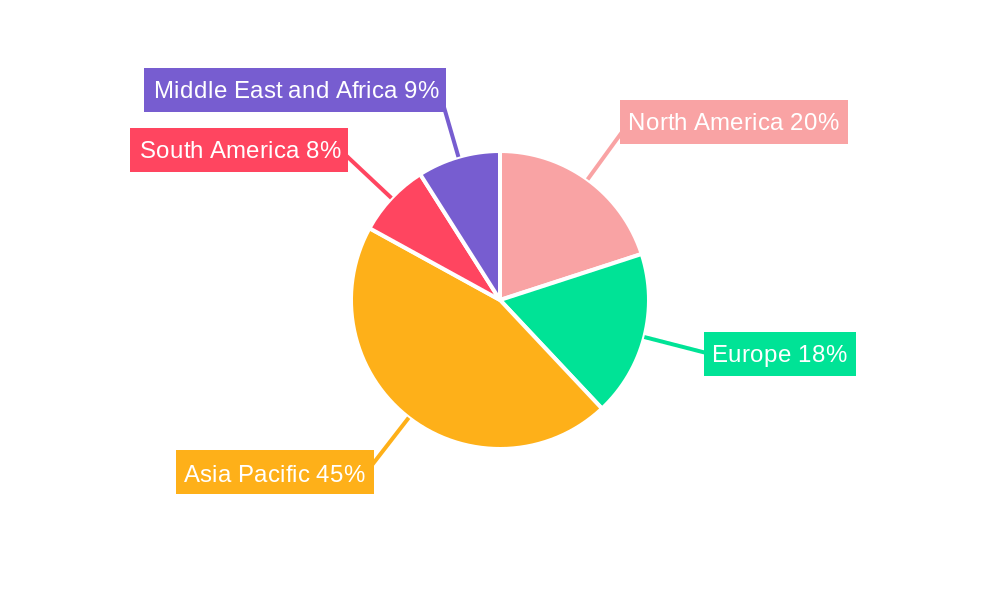
The global groundnut oil market, valued at $11.05 billion in 2025, is projected to experience steady growth, exhibiting a compound annual growth rate (CAGR) of 2.30% from 2025 to 2033. This growth is fueled by several key factors. Increasing consumer demand for healthy cooking oils, driven by rising awareness of the health benefits associated with monounsaturated fats and the nutritional profile of groundnut oil, is a primary driver. The versatile nature of groundnut oil, suitable for both cooking and personal care applications (like cosmetics and skincare products), further broadens its market appeal. Growth in the food industry, particularly in emerging economies, is also contributing significantly to the market expansion. However, fluctuating groundnut prices and competition from other vegetable oils like sunflower and soybean oil pose significant challenges to consistent market growth. The refined groundnut oil segment currently dominates the market due to its superior quality and longer shelf life, although the unrefined segment is witnessing a niche resurgence driven by consumers seeking natural and minimally processed products. Geographically, Asia-Pacific, particularly India and China, represents a major market share due to high consumption and substantial production. North America and Europe also contribute significantly, albeit with varying levels of demand depending on consumer preferences and health trends.
The market segmentation reveals a diverse landscape. The refined segment commands a larger market share compared to unrefined oil, driven by factors like improved shelf life and consumer preference for clarity and refined taste. Within applications, the food industry holds the largest share, followed by personal care products, and pharmaceuticals. The "other applications" segment incorporates industrial uses and niche markets, which are anticipated to experience moderate growth. Leading players like Wilmar International Limited, Cargill Incorporated, and Bunge Ltd. are focusing on strategies such as product diversification, capacity expansion, and strategic partnerships to maintain market competitiveness and capitalize on emerging market trends. The increasing adoption of sustainable sourcing practices and fair-trade initiatives is also expected to gain traction, influencing consumer purchasing decisions and shaping industry practices in the coming years.
Groundnut Oil Industry: A Comprehensive Market Report (2019-2033)
This in-depth report provides a comprehensive analysis of the global groundnut oil industry, offering invaluable insights for stakeholders seeking to navigate this dynamic market. Covering the period from 2019 to 2033, with a base year of 2025 and a forecast period of 2025-2033, this report utilizes rigorous data analysis and market intelligence to deliver actionable strategies. The market size is estimated at xx Million in 2025 and is projected to reach xx Million by 2033.
Groundnut Oil Industry Market Structure & Competitive Dynamics
This section analyzes the competitive landscape of the groundnut oil industry, examining market concentration, innovation, regulations, and market dynamics. The global groundnut oil market is moderately concentrated, with key players holding significant market share. Companies like Wilmar International Limited, Cargill Incorporated, and Bunge Ltd. dominate the refined segment, while smaller regional players often control unrefined oil production. Innovation is driven by improvements in extraction techniques, refining processes, and the development of value-added products. Regulatory frameworks vary across regions, influencing production costs and market access. Product substitutes, such as soybean oil and sunflower oil, pose significant competitive pressure, necessitating continuous innovation and strategic marketing.
- Market Concentration: The top five players account for approximately xx% of the global market share in 2025.
- Innovation Ecosystems: Significant investments in R&D focus on optimizing extraction yields, improving refining processes, and enhancing product quality.
- Regulatory Frameworks: Varying regulations regarding food safety and labeling impact market entry and operations.
- Product Substitutes: Competition from other vegetable oils necessitates continuous product differentiation and cost optimization.
- M&A Activities: The industry has witnessed several mergers and acquisitions in recent years, with deal values totaling xx Million in the historical period (2019-2024). This trend is expected to continue, driven by consolidation and expansion strategies.
Groundnut Oil Industry Industry Trends & Insights
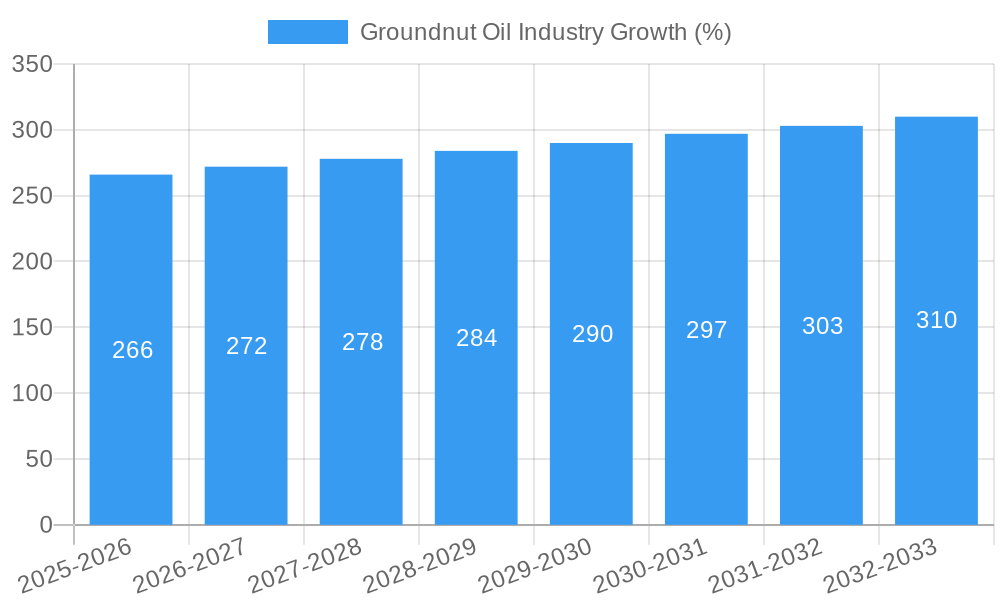
The groundnut oil market is experiencing significant growth driven by rising consumer demand, particularly in developing economies. The increasing health awareness, however, is driving demand for refined, healthier options. Technological advancements in extraction and refining are improving efficiency and reducing costs. Changing consumer preferences towards healthier fats and oils present both challenges and opportunities. The industry's CAGR during the forecast period (2025-2033) is estimated at xx%, indicating substantial market expansion. Market penetration in key regions continues to rise, driven by factors like rising disposable incomes and increasing urbanization. Competitive dynamics remain intense, with companies focusing on brand building, product differentiation, and strategic partnerships.
Dominant Markets & Segments in Groundnut Oil Industry
The food application segment dominates the groundnut oil market, followed by the personal care segment. India and China are the leading markets due to large populations and high consumption rates.
Dominant Regions and Countries:
- India: High consumption of groundnut oil in traditional cooking, coupled with a large population, makes it the leading market. Key drivers include strong cultural preference, favorable government policies, and established infrastructure.
- China: Increasing demand driven by rising disposable incomes and urbanization contributes to China's strong position in the market. Infrastructure development and supportive economic policies further fuel growth.
- Africa: Significant growth potential exists in Africa due to increasing population and rising demand for cooking oils. However, challenges include limited infrastructure and inconsistent supply chains.
Dominant Segments:
- Refined Groundnut Oil: This segment holds the largest market share due to its superior quality and longer shelf life, attracting price-sensitive consumers.
- Food Application: This remains the most significant application, driven by traditional culinary practices and widespread usage across various cuisines.
Groundnut Oil Industry Product Innovations
Recent innovations focus on enhancing the quality and value proposition of groundnut oil. This includes developing refined oils with higher oleic acid content, extending shelf life, and incorporating value-added attributes. Technological advancements in extraction and refining techniques aim to improve yields and reduce environmental impact. These innovations cater to growing consumer preferences for healthier and sustainable food products, boosting market competitiveness.
Report Segmentation & Scope
This report provides a detailed segmentation of the groundnut oil market based on type (refined and unrefined) and application (food, personal care, pharmaceuticals, and other). Each segment's market size, growth projections, and competitive dynamics are analyzed. The refined segment is expected to register higher growth due to its enhanced properties and increasing demand from the food and personal care industries. The food segment remains dominant, with consistent growth projected across all regions, while personal care and pharmaceuticals are projected to showcase moderate growth, driven by the adoption of groundnut oil in specialized cosmetic and therapeutic formulations.
Key Drivers of Groundnut Oil Industry Growth
Several factors contribute to the growth of the groundnut oil industry. Rising disposable incomes in developing countries are increasing demand for cooking oils. Favorable government policies supporting the agricultural sector boost groundnut production. Technological advancements in extraction and refining processes enhance efficiency and reduce production costs. Growing awareness of the health benefits of groundnut oil is also fueling demand.
Challenges in the Groundnut Oil Industry Sector
The groundnut oil industry faces challenges, including fluctuations in groundnut production due to weather conditions. Supply chain disruptions and increasing input costs impact profitability. Competition from substitute oils and stringent regulatory requirements present hurdles. These factors can affect market stability and growth projections. For example, a xx% decrease in groundnut yield in 2022 resulted in a xx Million loss in potential revenue.
Leading Players in the Groundnut Oil Industry Market
- Wilmar International Limited
- CHS Inc
- Luhua Group Co Ltd
- Shandong Xingquan Oil Co Ltd
- Cargill Incorporated
- Bunge Ltd
- Archer Daniels Midland Company
- Hain Celestial Group Inc
- Olam International
- Liberty Oil Mills Limited
- Lorenzati Group
Key Developments in Groundnut Oil Industry Sector
- January 2023: Wilmar International announced a new investment in sustainable groundnut farming in Africa.
- June 2022: Cargill launched a new range of refined groundnut oils with enhanced nutritional value.
- October 2021: A significant merger occurred between two smaller groundnut oil producers in India, leading to increased market consolidation.
- (Further key developments can be added here with specific year/month)
Strategic Groundnut Oil Industry Market Outlook
The future of the groundnut oil industry appears promising, with continued growth driven by several factors. Increasing consumer preference for healthy cooking oils, coupled with rising disposable incomes, especially in developing economies, fuels demand. Innovation in sustainable farming practices and advanced extraction techniques promises a greener and more efficient future. Strategic partnerships and investments in supply chain optimization will enhance market competitiveness and ensure sustainable growth in this important sector.
Groundnut Oil Industry Segmentation
-
1. Type
- 1.1. Refined
- 1.2. Unrefined
-
2. Application
- 2.1. Personal Care
- 2.2. Food
- 2.3. Pharmaceuticals
- 2.4. Other Applications
Groundnut Oil Industry Segmentation By Geography
-
1. North America
- 1.1. United States
- 1.2. Canada
- 1.3. Mexico
- 1.4. Rest of North America
-
2. Europe
- 2.1. Spain
- 2.2. United Kingdom
- 2.3. Germany
- 2.4. France
- 2.5. Italy
- 2.6. Russia
- 2.7. Rest of Europe
-
3. Asia Pacific
- 3.1. China
- 3.2. Japan
- 3.3. India
- 3.4. Australia
- 3.5. Rest of Asia Pacific
-
4. South America
- 4.1. Brazil
- 4.2. Argentina
- 4.3. Rest of South America
-
5. Middle East and Africa
- 5.1. South Africa
- 5.2. Saudi Arabia
- 5.3. Rest of Middle East and Africa
Groundnut Oil Industry REPORT HIGHLIGHTS
| Aspects | Details |
|---|---|
| Study Period | 2019-2033 |
| Base Year | 2024 |
| Estimated Year | 2025 |
| Forecast Period | 2025-2033 |
| Historical Period | 2019-2024 |
| Growth Rate | CAGR of 2.30% from 2019-2033 |
| Segmentation |
|
Table of Contents
- 1. Introduction
- 1.1. Research Scope
- 1.2. Market Segmentation
- 1.3. Research Methodology
- 1.4. Definitions and Assumptions
- 2. Executive Summary
- 2.1. Introduction
- 3. Market Dynamics
- 3.1. Introduction
- 3.2. Market Drivers
- 3.2.1. Inclination Towards Fitness and Increasing Intake of Plant-based Protein; Increase in Consumer Inclination Towards Meat Substitutes
- 3.3. Market Restrains
- 3.3.1. Gluten-Intolerance Among the Population Hindering the Market
- 3.4. Market Trends
- 3.4.1. Increasing Awareness of Peanut Oil Benefits in Skincare Products
- 4. Market Factor Analysis
- 4.1. Porters Five Forces
- 4.2. Supply/Value Chain
- 4.3. PESTEL analysis
- 4.4. Market Entropy
- 4.5. Patent/Trademark Analysis
- 5. Global Groundnut Oil Industry Analysis, Insights and Forecast, 2019-2031
- 5.1. Market Analysis, Insights and Forecast - by Type
- 5.1.1. Refined
- 5.1.2. Unrefined
- 5.2. Market Analysis, Insights and Forecast - by Application
- 5.2.1. Personal Care
- 5.2.2. Food
- 5.2.3. Pharmaceuticals
- 5.2.4. Other Applications
- 5.3. Market Analysis, Insights and Forecast - by Region
- 5.3.1. North America
- 5.3.2. Europe
- 5.3.3. Asia Pacific
- 5.3.4. South America
- 5.3.5. Middle East and Africa
- 5.1. Market Analysis, Insights and Forecast - by Type
- 6. North America Groundnut Oil Industry Analysis, Insights and Forecast, 2019-2031
- 6.1. Market Analysis, Insights and Forecast - by Type
- 6.1.1. Refined
- 6.1.2. Unrefined
- 6.2. Market Analysis, Insights and Forecast - by Application
- 6.2.1. Personal Care
- 6.2.2. Food
- 6.2.3. Pharmaceuticals
- 6.2.4. Other Applications
- 6.1. Market Analysis, Insights and Forecast - by Type
- 7. Europe Groundnut Oil Industry Analysis, Insights and Forecast, 2019-2031
- 7.1. Market Analysis, Insights and Forecast - by Type
- 7.1.1. Refined
- 7.1.2. Unrefined
- 7.2. Market Analysis, Insights and Forecast - by Application
- 7.2.1. Personal Care
- 7.2.2. Food
- 7.2.3. Pharmaceuticals
- 7.2.4. Other Applications
- 7.1. Market Analysis, Insights and Forecast - by Type
- 8. Asia Pacific Groundnut Oil Industry Analysis, Insights and Forecast, 2019-2031
- 8.1. Market Analysis, Insights and Forecast - by Type
- 8.1.1. Refined
- 8.1.2. Unrefined
- 8.2. Market Analysis, Insights and Forecast - by Application
- 8.2.1. Personal Care
- 8.2.2. Food
- 8.2.3. Pharmaceuticals
- 8.2.4. Other Applications
- 8.1. Market Analysis, Insights and Forecast - by Type
- 9. South America Groundnut Oil Industry Analysis, Insights and Forecast, 2019-2031
- 9.1. Market Analysis, Insights and Forecast - by Type
- 9.1.1. Refined
- 9.1.2. Unrefined
- 9.2. Market Analysis, Insights and Forecast - by Application
- 9.2.1. Personal Care
- 9.2.2. Food
- 9.2.3. Pharmaceuticals
- 9.2.4. Other Applications
- 9.1. Market Analysis, Insights and Forecast - by Type
- 10. Middle East and Africa Groundnut Oil Industry Analysis, Insights and Forecast, 2019-2031
- 10.1. Market Analysis, Insights and Forecast - by Type
- 10.1.1. Refined
- 10.1.2. Unrefined
- 10.2. Market Analysis, Insights and Forecast - by Application
- 10.2.1. Personal Care
- 10.2.2. Food
- 10.2.3. Pharmaceuticals
- 10.2.4. Other Applications
- 10.1. Market Analysis, Insights and Forecast - by Type
- 11. North America Groundnut Oil Industry Analysis, Insights and Forecast, 2019-2031
- 11.1. Market Analysis, Insights and Forecast - By Country/Sub-region
- 11.1.1 United States
- 11.1.2 Canada
- 11.1.3 Mexico
- 11.1.4 Rest of North America
- 12. Europe Groundnut Oil Industry Analysis, Insights and Forecast, 2019-2031
- 12.1. Market Analysis, Insights and Forecast - By Country/Sub-region
- 12.1.1 Spain
- 12.1.2 United Kingdom
- 12.1.3 Germany
- 12.1.4 France
- 12.1.5 Italy
- 12.1.6 Russia
- 12.1.7 Rest of Europe
- 13. Asia Pacific Groundnut Oil Industry Analysis, Insights and Forecast, 2019-2031
- 13.1. Market Analysis, Insights and Forecast - By Country/Sub-region
- 13.1.1 China
- 13.1.2 Japan
- 13.1.3 India
- 13.1.4 Australia
- 13.1.5 Rest of Asia Pacific
- 14. South America Groundnut Oil Industry Analysis, Insights and Forecast, 2019-2031
- 14.1. Market Analysis, Insights and Forecast - By Country/Sub-region
- 14.1.1 Brazil
- 14.1.2 Argentina
- 14.1.3 Rest of South America
- 15. Middle East and Africa Groundnut Oil Industry Analysis, Insights and Forecast, 2019-2031
- 15.1. Market Analysis, Insights and Forecast - By Country/Sub-region
- 15.1.1 South Africa
- 15.1.2 Saudi Arabia
- 15.1.3 Rest of Middle East and Africa
- 16. Competitive Analysis
- 16.1. Global Market Share Analysis 2024
- 16.2. Company Profiles
- 16.2.1 Wilmar International Limited
- 16.2.1.1. Overview
- 16.2.1.2. Products
- 16.2.1.3. SWOT Analysis
- 16.2.1.4. Recent Developments
- 16.2.1.5. Financials (Based on Availability)
- 16.2.2 CHS Inc
- 16.2.2.1. Overview
- 16.2.2.2. Products
- 16.2.2.3. SWOT Analysis
- 16.2.2.4. Recent Developments
- 16.2.2.5. Financials (Based on Availability)
- 16.2.3 Luhua Group Co Ltd
- 16.2.3.1. Overview
- 16.2.3.2. Products
- 16.2.3.3. SWOT Analysis
- 16.2.3.4. Recent Developments
- 16.2.3.5. Financials (Based on Availability)
- 16.2.4 Shandong Xingquan Oil Co Ltd
- 16.2.4.1. Overview
- 16.2.4.2. Products
- 16.2.4.3. SWOT Analysis
- 16.2.4.4. Recent Developments
- 16.2.4.5. Financials (Based on Availability)
- 16.2.5 Cargill Incorporated
- 16.2.5.1. Overview
- 16.2.5.2. Products
- 16.2.5.3. SWOT Analysis
- 16.2.5.4. Recent Developments
- 16.2.5.5. Financials (Based on Availability)
- 16.2.6 Bunge Ltd
- 16.2.6.1. Overview
- 16.2.6.2. Products
- 16.2.6.3. SWOT Analysis
- 16.2.6.4. Recent Developments
- 16.2.6.5. Financials (Based on Availability)
- 16.2.7 Archer Daniels Midland Company
- 16.2.7.1. Overview
- 16.2.7.2. Products
- 16.2.7.3. SWOT Analysis
- 16.2.7.4. Recent Developments
- 16.2.7.5. Financials (Based on Availability)
- 16.2.8 Hain Celestial Group Inc
- 16.2.8.1. Overview
- 16.2.8.2. Products
- 16.2.8.3. SWOT Analysis
- 16.2.8.4. Recent Developments
- 16.2.8.5. Financials (Based on Availability)
- 16.2.9 Olam International
- 16.2.9.1. Overview
- 16.2.9.2. Products
- 16.2.9.3. SWOT Analysis
- 16.2.9.4. Recent Developments
- 16.2.9.5. Financials (Based on Availability)
- 16.2.10 Liberty Oil Mills Limited
- 16.2.10.1. Overview
- 16.2.10.2. Products
- 16.2.10.3. SWOT Analysis
- 16.2.10.4. Recent Developments
- 16.2.10.5. Financials (Based on Availability)
- 16.2.11 Lorenzati Group*List Not Exhaustive
- 16.2.11.1. Overview
- 16.2.11.2. Products
- 16.2.11.3. SWOT Analysis
- 16.2.11.4. Recent Developments
- 16.2.11.5. Financials (Based on Availability)
- 16.2.1 Wilmar International Limited
List of Figures
- Figure 1: Global Groundnut Oil Industry Revenue Breakdown (Million, %) by Region 2024 & 2032
- Figure 2: Global Groundnut Oil Industry Volume Breakdown (K Tons, %) by Region 2024 & 2032
- Figure 3: North America Groundnut Oil Industry Revenue (Million), by Country 2024 & 2032
- Figure 4: North America Groundnut Oil Industry Volume (K Tons), by Country 2024 & 2032
- Figure 5: North America Groundnut Oil Industry Revenue Share (%), by Country 2024 & 2032
- Figure 6: North America Groundnut Oil Industry Volume Share (%), by Country 2024 & 2032
- Figure 7: Europe Groundnut Oil Industry Revenue (Million), by Country 2024 & 2032
- Figure 8: Europe Groundnut Oil Industry Volume (K Tons), by Country 2024 & 2032
- Figure 9: Europe Groundnut Oil Industry Revenue Share (%), by Country 2024 & 2032
- Figure 10: Europe Groundnut Oil Industry Volume Share (%), by Country 2024 & 2032
- Figure 11: Asia Pacific Groundnut Oil Industry Revenue (Million), by Country 2024 & 2032
- Figure 12: Asia Pacific Groundnut Oil Industry Volume (K Tons), by Country 2024 & 2032
- Figure 13: Asia Pacific Groundnut Oil Industry Revenue Share (%), by Country 2024 & 2032
- Figure 14: Asia Pacific Groundnut Oil Industry Volume Share (%), by Country 2024 & 2032
- Figure 15: South America Groundnut Oil Industry Revenue (Million), by Country 2024 & 2032
- Figure 16: South America Groundnut Oil Industry Volume (K Tons), by Country 2024 & 2032
- Figure 17: South America Groundnut Oil Industry Revenue Share (%), by Country 2024 & 2032
- Figure 18: South America Groundnut Oil Industry Volume Share (%), by Country 2024 & 2032
- Figure 19: Middle East and Africa Groundnut Oil Industry Revenue (Million), by Country 2024 & 2032
- Figure 20: Middle East and Africa Groundnut Oil Industry Volume (K Tons), by Country 2024 & 2032
- Figure 21: Middle East and Africa Groundnut Oil Industry Revenue Share (%), by Country 2024 & 2032
- Figure 22: Middle East and Africa Groundnut Oil Industry Volume Share (%), by Country 2024 & 2032
- Figure 23: North America Groundnut Oil Industry Revenue (Million), by Type 2024 & 2032
- Figure 24: North America Groundnut Oil Industry Volume (K Tons), by Type 2024 & 2032
- Figure 25: North America Groundnut Oil Industry Revenue Share (%), by Type 2024 & 2032
- Figure 26: North America Groundnut Oil Industry Volume Share (%), by Type 2024 & 2032
- Figure 27: North America Groundnut Oil Industry Revenue (Million), by Application 2024 & 2032
- Figure 28: North America Groundnut Oil Industry Volume (K Tons), by Application 2024 & 2032
- Figure 29: North America Groundnut Oil Industry Revenue Share (%), by Application 2024 & 2032
- Figure 30: North America Groundnut Oil Industry Volume Share (%), by Application 2024 & 2032
- Figure 31: North America Groundnut Oil Industry Revenue (Million), by Country 2024 & 2032
- Figure 32: North America Groundnut Oil Industry Volume (K Tons), by Country 2024 & 2032
- Figure 33: North America Groundnut Oil Industry Revenue Share (%), by Country 2024 & 2032
- Figure 34: North America Groundnut Oil Industry Volume Share (%), by Country 2024 & 2032
- Figure 35: Europe Groundnut Oil Industry Revenue (Million), by Type 2024 & 2032
- Figure 36: Europe Groundnut Oil Industry Volume (K Tons), by Type 2024 & 2032
- Figure 37: Europe Groundnut Oil Industry Revenue Share (%), by Type 2024 & 2032
- Figure 38: Europe Groundnut Oil Industry Volume Share (%), by Type 2024 & 2032
- Figure 39: Europe Groundnut Oil Industry Revenue (Million), by Application 2024 & 2032
- Figure 40: Europe Groundnut Oil Industry Volume (K Tons), by Application 2024 & 2032
- Figure 41: Europe Groundnut Oil Industry Revenue Share (%), by Application 2024 & 2032
- Figure 42: Europe Groundnut Oil Industry Volume Share (%), by Application 2024 & 2032
- Figure 43: Europe Groundnut Oil Industry Revenue (Million), by Country 2024 & 2032
- Figure 44: Europe Groundnut Oil Industry Volume (K Tons), by Country 2024 & 2032
- Figure 45: Europe Groundnut Oil Industry Revenue Share (%), by Country 2024 & 2032
- Figure 46: Europe Groundnut Oil Industry Volume Share (%), by Country 2024 & 2032
- Figure 47: Asia Pacific Groundnut Oil Industry Revenue (Million), by Type 2024 & 2032
- Figure 48: Asia Pacific Groundnut Oil Industry Volume (K Tons), by Type 2024 & 2032
- Figure 49: Asia Pacific Groundnut Oil Industry Revenue Share (%), by Type 2024 & 2032
- Figure 50: Asia Pacific Groundnut Oil Industry Volume Share (%), by Type 2024 & 2032
- Figure 51: Asia Pacific Groundnut Oil Industry Revenue (Million), by Application 2024 & 2032
- Figure 52: Asia Pacific Groundnut Oil Industry Volume (K Tons), by Application 2024 & 2032
- Figure 53: Asia Pacific Groundnut Oil Industry Revenue Share (%), by Application 2024 & 2032
- Figure 54: Asia Pacific Groundnut Oil Industry Volume Share (%), by Application 2024 & 2032
- Figure 55: Asia Pacific Groundnut Oil Industry Revenue (Million), by Country 2024 & 2032
- Figure 56: Asia Pacific Groundnut Oil Industry Volume (K Tons), by Country 2024 & 2032
- Figure 57: Asia Pacific Groundnut Oil Industry Revenue Share (%), by Country 2024 & 2032
- Figure 58: Asia Pacific Groundnut Oil Industry Volume Share (%), by Country 2024 & 2032
- Figure 59: South America Groundnut Oil Industry Revenue (Million), by Type 2024 & 2032
- Figure 60: South America Groundnut Oil Industry Volume (K Tons), by Type 2024 & 2032
- Figure 61: South America Groundnut Oil Industry Revenue Share (%), by Type 2024 & 2032
- Figure 62: South America Groundnut Oil Industry Volume Share (%), by Type 2024 & 2032
- Figure 63: South America Groundnut Oil Industry Revenue (Million), by Application 2024 & 2032
- Figure 64: South America Groundnut Oil Industry Volume (K Tons), by Application 2024 & 2032
- Figure 65: South America Groundnut Oil Industry Revenue Share (%), by Application 2024 & 2032
- Figure 66: South America Groundnut Oil Industry Volume Share (%), by Application 2024 & 2032
- Figure 67: South America Groundnut Oil Industry Revenue (Million), by Country 2024 & 2032
- Figure 68: South America Groundnut Oil Industry Volume (K Tons), by Country 2024 & 2032
- Figure 69: South America Groundnut Oil Industry Revenue Share (%), by Country 2024 & 2032
- Figure 70: South America Groundnut Oil Industry Volume Share (%), by Country 2024 & 2032
- Figure 71: Middle East and Africa Groundnut Oil Industry Revenue (Million), by Type 2024 & 2032
- Figure 72: Middle East and Africa Groundnut Oil Industry Volume (K Tons), by Type 2024 & 2032
- Figure 73: Middle East and Africa Groundnut Oil Industry Revenue Share (%), by Type 2024 & 2032
- Figure 74: Middle East and Africa Groundnut Oil Industry Volume Share (%), by Type 2024 & 2032
- Figure 75: Middle East and Africa Groundnut Oil Industry Revenue (Million), by Application 2024 & 2032
- Figure 76: Middle East and Africa Groundnut Oil Industry Volume (K Tons), by Application 2024 & 2032
- Figure 77: Middle East and Africa Groundnut Oil Industry Revenue Share (%), by Application 2024 & 2032
- Figure 78: Middle East and Africa Groundnut Oil Industry Volume Share (%), by Application 2024 & 2032
- Figure 79: Middle East and Africa Groundnut Oil Industry Revenue (Million), by Country 2024 & 2032
- Figure 80: Middle East and Africa Groundnut Oil Industry Volume (K Tons), by Country 2024 & 2032
- Figure 81: Middle East and Africa Groundnut Oil Industry Revenue Share (%), by Country 2024 & 2032
- Figure 82: Middle East and Africa Groundnut Oil Industry Volume Share (%), by Country 2024 & 2032
List of Tables
- Table 1: Global Groundnut Oil Industry Revenue Million Forecast, by Region 2019 & 2032
- Table 2: Global Groundnut Oil Industry Volume K Tons Forecast, by Region 2019 & 2032
- Table 3: Global Groundnut Oil Industry Revenue Million Forecast, by Type 2019 & 2032
- Table 4: Global Groundnut Oil Industry Volume K Tons Forecast, by Type 2019 & 2032
- Table 5: Global Groundnut Oil Industry Revenue Million Forecast, by Application 2019 & 2032
- Table 6: Global Groundnut Oil Industry Volume K Tons Forecast, by Application 2019 & 2032
- Table 7: Global Groundnut Oil Industry Revenue Million Forecast, by Region 2019 & 2032
- Table 8: Global Groundnut Oil Industry Volume K Tons Forecast, by Region 2019 & 2032
- Table 9: Global Groundnut Oil Industry Revenue Million Forecast, by Country 2019 & 2032
- Table 10: Global Groundnut Oil Industry Volume K Tons Forecast, by Country 2019 & 2032
- Table 11: United States Groundnut Oil Industry Revenue (Million) Forecast, by Application 2019 & 2032
- Table 12: United States Groundnut Oil Industry Volume (K Tons) Forecast, by Application 2019 & 2032
- Table 13: Canada Groundnut Oil Industry Revenue (Million) Forecast, by Application 2019 & 2032
- Table 14: Canada Groundnut Oil Industry Volume (K Tons) Forecast, by Application 2019 & 2032
- Table 15: Mexico Groundnut Oil Industry Revenue (Million) Forecast, by Application 2019 & 2032
- Table 16: Mexico Groundnut Oil Industry Volume (K Tons) Forecast, by Application 2019 & 2032
- Table 17: Rest of North America Groundnut Oil Industry Revenue (Million) Forecast, by Application 2019 & 2032
- Table 18: Rest of North America Groundnut Oil Industry Volume (K Tons) Forecast, by Application 2019 & 2032
- Table 19: Global Groundnut Oil Industry Revenue Million Forecast, by Country 2019 & 2032
- Table 20: Global Groundnut Oil Industry Volume K Tons Forecast, by Country 2019 & 2032
- Table 21: Spain Groundnut Oil Industry Revenue (Million) Forecast, by Application 2019 & 2032
- Table 22: Spain Groundnut Oil Industry Volume (K Tons) Forecast, by Application 2019 & 2032
- Table 23: United Kingdom Groundnut Oil Industry Revenue (Million) Forecast, by Application 2019 & 2032
- Table 24: United Kingdom Groundnut Oil Industry Volume (K Tons) Forecast, by Application 2019 & 2032
- Table 25: Germany Groundnut Oil Industry Revenue (Million) Forecast, by Application 2019 & 2032
- Table 26: Germany Groundnut Oil Industry Volume (K Tons) Forecast, by Application 2019 & 2032
- Table 27: France Groundnut Oil Industry Revenue (Million) Forecast, by Application 2019 & 2032
- Table 28: France Groundnut Oil Industry Volume (K Tons) Forecast, by Application 2019 & 2032
- Table 29: Italy Groundnut Oil Industry Revenue (Million) Forecast, by Application 2019 & 2032
- Table 30: Italy Groundnut Oil Industry Volume (K Tons) Forecast, by Application 2019 & 2032
- Table 31: Russia Groundnut Oil Industry Revenue (Million) Forecast, by Application 2019 & 2032
- Table 32: Russia Groundnut Oil Industry Volume (K Tons) Forecast, by Application 2019 & 2032
- Table 33: Rest of Europe Groundnut Oil Industry Revenue (Million) Forecast, by Application 2019 & 2032
- Table 34: Rest of Europe Groundnut Oil Industry Volume (K Tons) Forecast, by Application 2019 & 2032
- Table 35: Global Groundnut Oil Industry Revenue Million Forecast, by Country 2019 & 2032
- Table 36: Global Groundnut Oil Industry Volume K Tons Forecast, by Country 2019 & 2032
- Table 37: China Groundnut Oil Industry Revenue (Million) Forecast, by Application 2019 & 2032
- Table 38: China Groundnut Oil Industry Volume (K Tons) Forecast, by Application 2019 & 2032
- Table 39: Japan Groundnut Oil Industry Revenue (Million) Forecast, by Application 2019 & 2032
- Table 40: Japan Groundnut Oil Industry Volume (K Tons) Forecast, by Application 2019 & 2032
- Table 41: India Groundnut Oil Industry Revenue (Million) Forecast, by Application 2019 & 2032
- Table 42: India Groundnut Oil Industry Volume (K Tons) Forecast, by Application 2019 & 2032
- Table 43: Australia Groundnut Oil Industry Revenue (Million) Forecast, by Application 2019 & 2032
- Table 44: Australia Groundnut Oil Industry Volume (K Tons) Forecast, by Application 2019 & 2032
- Table 45: Rest of Asia Pacific Groundnut Oil Industry Revenue (Million) Forecast, by Application 2019 & 2032
- Table 46: Rest of Asia Pacific Groundnut Oil Industry Volume (K Tons) Forecast, by Application 2019 & 2032
- Table 47: Global Groundnut Oil Industry Revenue Million Forecast, by Country 2019 & 2032
- Table 48: Global Groundnut Oil Industry Volume K Tons Forecast, by Country 2019 & 2032
- Table 49: Brazil Groundnut Oil Industry Revenue (Million) Forecast, by Application 2019 & 2032
- Table 50: Brazil Groundnut Oil Industry Volume (K Tons) Forecast, by Application 2019 & 2032
- Table 51: Argentina Groundnut Oil Industry Revenue (Million) Forecast, by Application 2019 & 2032
- Table 52: Argentina Groundnut Oil Industry Volume (K Tons) Forecast, by Application 2019 & 2032
- Table 53: Rest of South America Groundnut Oil Industry Revenue (Million) Forecast, by Application 2019 & 2032
- Table 54: Rest of South America Groundnut Oil Industry Volume (K Tons) Forecast, by Application 2019 & 2032
- Table 55: Global Groundnut Oil Industry Revenue Million Forecast, by Country 2019 & 2032
- Table 56: Global Groundnut Oil Industry Volume K Tons Forecast, by Country 2019 & 2032
- Table 57: South Africa Groundnut Oil Industry Revenue (Million) Forecast, by Application 2019 & 2032
- Table 58: South Africa Groundnut Oil Industry Volume (K Tons) Forecast, by Application 2019 & 2032
- Table 59: Saudi Arabia Groundnut Oil Industry Revenue (Million) Forecast, by Application 2019 & 2032
- Table 60: Saudi Arabia Groundnut Oil Industry Volume (K Tons) Forecast, by Application 2019 & 2032
- Table 61: Rest of Middle East and Africa Groundnut Oil Industry Revenue (Million) Forecast, by Application 2019 & 2032
- Table 62: Rest of Middle East and Africa Groundnut Oil Industry Volume (K Tons) Forecast, by Application 2019 & 2032
- Table 63: Global Groundnut Oil Industry Revenue Million Forecast, by Type 2019 & 2032
- Table 64: Global Groundnut Oil Industry Volume K Tons Forecast, by Type 2019 & 2032
- Table 65: Global Groundnut Oil Industry Revenue Million Forecast, by Application 2019 & 2032
- Table 66: Global Groundnut Oil Industry Volume K Tons Forecast, by Application 2019 & 2032
- Table 67: Global Groundnut Oil Industry Revenue Million Forecast, by Country 2019 & 2032
- Table 68: Global Groundnut Oil Industry Volume K Tons Forecast, by Country 2019 & 2032
- Table 69: United States Groundnut Oil Industry Revenue (Million) Forecast, by Application 2019 & 2032
- Table 70: United States Groundnut Oil Industry Volume (K Tons) Forecast, by Application 2019 & 2032
- Table 71: Canada Groundnut Oil Industry Revenue (Million) Forecast, by Application 2019 & 2032
- Table 72: Canada Groundnut Oil Industry Volume (K Tons) Forecast, by Application 2019 & 2032
- Table 73: Mexico Groundnut Oil Industry Revenue (Million) Forecast, by Application 2019 & 2032
- Table 74: Mexico Groundnut Oil Industry Volume (K Tons) Forecast, by Application 2019 & 2032
- Table 75: Rest of North America Groundnut Oil Industry Revenue (Million) Forecast, by Application 2019 & 2032
- Table 76: Rest of North America Groundnut Oil Industry Volume (K Tons) Forecast, by Application 2019 & 2032
- Table 77: Global Groundnut Oil Industry Revenue Million Forecast, by Type 2019 & 2032
- Table 78: Global Groundnut Oil Industry Volume K Tons Forecast, by Type 2019 & 2032
- Table 79: Global Groundnut Oil Industry Revenue Million Forecast, by Application 2019 & 2032
- Table 80: Global Groundnut Oil Industry Volume K Tons Forecast, by Application 2019 & 2032
- Table 81: Global Groundnut Oil Industry Revenue Million Forecast, by Country 2019 & 2032
- Table 82: Global Groundnut Oil Industry Volume K Tons Forecast, by Country 2019 & 2032
- Table 83: Spain Groundnut Oil Industry Revenue (Million) Forecast, by Application 2019 & 2032
- Table 84: Spain Groundnut Oil Industry Volume (K Tons) Forecast, by Application 2019 & 2032
- Table 85: United Kingdom Groundnut Oil Industry Revenue (Million) Forecast, by Application 2019 & 2032
- Table 86: United Kingdom Groundnut Oil Industry Volume (K Tons) Forecast, by Application 2019 & 2032
- Table 87: Germany Groundnut Oil Industry Revenue (Million) Forecast, by Application 2019 & 2032
- Table 88: Germany Groundnut Oil Industry Volume (K Tons) Forecast, by Application 2019 & 2032
- Table 89: France Groundnut Oil Industry Revenue (Million) Forecast, by Application 2019 & 2032
- Table 90: France Groundnut Oil Industry Volume (K Tons) Forecast, by Application 2019 & 2032
- Table 91: Italy Groundnut Oil Industry Revenue (Million) Forecast, by Application 2019 & 2032
- Table 92: Italy Groundnut Oil Industry Volume (K Tons) Forecast, by Application 2019 & 2032
- Table 93: Russia Groundnut Oil Industry Revenue (Million) Forecast, by Application 2019 & 2032
- Table 94: Russia Groundnut Oil Industry Volume (K Tons) Forecast, by Application 2019 & 2032
- Table 95: Rest of Europe Groundnut Oil Industry Revenue (Million) Forecast, by Application 2019 & 2032
- Table 96: Rest of Europe Groundnut Oil Industry Volume (K Tons) Forecast, by Application 2019 & 2032
- Table 97: Global Groundnut Oil Industry Revenue Million Forecast, by Type 2019 & 2032
- Table 98: Global Groundnut Oil Industry Volume K Tons Forecast, by Type 2019 & 2032
- Table 99: Global Groundnut Oil Industry Revenue Million Forecast, by Application 2019 & 2032
- Table 100: Global Groundnut Oil Industry Volume K Tons Forecast, by Application 2019 & 2032
- Table 101: Global Groundnut Oil Industry Revenue Million Forecast, by Country 2019 & 2032
- Table 102: Global Groundnut Oil Industry Volume K Tons Forecast, by Country 2019 & 2032
- Table 103: China Groundnut Oil Industry Revenue (Million) Forecast, by Application 2019 & 2032
- Table 104: China Groundnut Oil Industry Volume (K Tons) Forecast, by Application 2019 & 2032
- Table 105: Japan Groundnut Oil Industry Revenue (Million) Forecast, by Application 2019 & 2032
- Table 106: Japan Groundnut Oil Industry Volume (K Tons) Forecast, by Application 2019 & 2032
- Table 107: India Groundnut Oil Industry Revenue (Million) Forecast, by Application 2019 & 2032
- Table 108: India Groundnut Oil Industry Volume (K Tons) Forecast, by Application 2019 & 2032
- Table 109: Australia Groundnut Oil Industry Revenue (Million) Forecast, by Application 2019 & 2032
- Table 110: Australia Groundnut Oil Industry Volume (K Tons) Forecast, by Application 2019 & 2032
- Table 111: Rest of Asia Pacific Groundnut Oil Industry Revenue (Million) Forecast, by Application 2019 & 2032
- Table 112: Rest of Asia Pacific Groundnut Oil Industry Volume (K Tons) Forecast, by Application 2019 & 2032
- Table 113: Global Groundnut Oil Industry Revenue Million Forecast, by Type 2019 & 2032
- Table 114: Global Groundnut Oil Industry Volume K Tons Forecast, by Type 2019 & 2032
- Table 115: Global Groundnut Oil Industry Revenue Million Forecast, by Application 2019 & 2032
- Table 116: Global Groundnut Oil Industry Volume K Tons Forecast, by Application 2019 & 2032
- Table 117: Global Groundnut Oil Industry Revenue Million Forecast, by Country 2019 & 2032
- Table 118: Global Groundnut Oil Industry Volume K Tons Forecast, by Country 2019 & 2032
- Table 119: Brazil Groundnut Oil Industry Revenue (Million) Forecast, by Application 2019 & 2032
- Table 120: Brazil Groundnut Oil Industry Volume (K Tons) Forecast, by Application 2019 & 2032
- Table 121: Argentina Groundnut Oil Industry Revenue (Million) Forecast, by Application 2019 & 2032
- Table 122: Argentina Groundnut Oil Industry Volume (K Tons) Forecast, by Application 2019 & 2032
- Table 123: Rest of South America Groundnut Oil Industry Revenue (Million) Forecast, by Application 2019 & 2032
- Table 124: Rest of South America Groundnut Oil Industry Volume (K Tons) Forecast, by Application 2019 & 2032
- Table 125: Global Groundnut Oil Industry Revenue Million Forecast, by Type 2019 & 2032
- Table 126: Global Groundnut Oil Industry Volume K Tons Forecast, by Type 2019 & 2032
- Table 127: Global Groundnut Oil Industry Revenue Million Forecast, by Application 2019 & 2032
- Table 128: Global Groundnut Oil Industry Volume K Tons Forecast, by Application 2019 & 2032
- Table 129: Global Groundnut Oil Industry Revenue Million Forecast, by Country 2019 & 2032
- Table 130: Global Groundnut Oil Industry Volume K Tons Forecast, by Country 2019 & 2032
- Table 131: South Africa Groundnut Oil Industry Revenue (Million) Forecast, by Application 2019 & 2032
- Table 132: South Africa Groundnut Oil Industry Volume (K Tons) Forecast, by Application 2019 & 2032
- Table 133: Saudi Arabia Groundnut Oil Industry Revenue (Million) Forecast, by Application 2019 & 2032
- Table 134: Saudi Arabia Groundnut Oil Industry Volume (K Tons) Forecast, by Application 2019 & 2032
- Table 135: Rest of Middle East and Africa Groundnut Oil Industry Revenue (Million) Forecast, by Application 2019 & 2032
- Table 136: Rest of Middle East and Africa Groundnut Oil Industry Volume (K Tons) Forecast, by Application 2019 & 2032
Frequently Asked Questions
1. What is the projected Compound Annual Growth Rate (CAGR) of the Groundnut Oil Industry?
The projected CAGR is approximately 2.30%.
2. Which companies are prominent players in the Groundnut Oil Industry?
Key companies in the market include Wilmar International Limited, CHS Inc, Luhua Group Co Ltd, Shandong Xingquan Oil Co Ltd, Cargill Incorporated, Bunge Ltd, Archer Daniels Midland Company, Hain Celestial Group Inc, Olam International, Liberty Oil Mills Limited, Lorenzati Group*List Not Exhaustive.
3. What are the main segments of the Groundnut Oil Industry?
The market segments include Type, Application.
4. Can you provide details about the market size?
The market size is estimated to be USD 11.05 Million as of 2022.
5. What are some drivers contributing to market growth?
Inclination Towards Fitness and Increasing Intake of Plant-based Protein; Increase in Consumer Inclination Towards Meat Substitutes.
6. What are the notable trends driving market growth?
Increasing Awareness of Peanut Oil Benefits in Skincare Products.
7. Are there any restraints impacting market growth?
Gluten-Intolerance Among the Population Hindering the Market.
8. Can you provide examples of recent developments in the market?
N/A
9. What pricing options are available for accessing the report?
Pricing options include single-user, multi-user, and enterprise licenses priced at USD 4750, USD 5250, and USD 8750 respectively.
10. Is the market size provided in terms of value or volume?
The market size is provided in terms of value, measured in Million and volume, measured in K Tons.
11. Are there any specific market keywords associated with the report?
Yes, the market keyword associated with the report is "Groundnut Oil Industry," which aids in identifying and referencing the specific market segment covered.
12. How do I determine which pricing option suits my needs best?
The pricing options vary based on user requirements and access needs. Individual users may opt for single-user licenses, while businesses requiring broader access may choose multi-user or enterprise licenses for cost-effective access to the report.
13. Are there any additional resources or data provided in the Groundnut Oil Industry report?
While the report offers comprehensive insights, it's advisable to review the specific contents or supplementary materials provided to ascertain if additional resources or data are available.
14. How can I stay updated on further developments or reports in the Groundnut Oil Industry?
To stay informed about further developments, trends, and reports in the Groundnut Oil Industry, consider subscribing to industry newsletters, following relevant companies and organizations, or regularly checking reputable industry news sources and publications.
Methodology
Step 1 - Identification of Relevant Samples Size from Population Database


Step 2 - Approaches for Defining Global Market Size (Value, Volume* & Price*)

Note*: In applicable scenarios
Step 3 - Data Sources
Primary Research
- Web Analytics
- Survey Reports
- Research Institute
- Latest Research Reports
- Opinion Leaders
Secondary Research
- Annual Reports
- White Paper
- Latest Press Release
- Industry Association
- Paid Database
- Investor Presentations

Step 4 - Data Triangulation
Involves using different sources of information in order to increase the validity of a study
These sources are likely to be stakeholders in a program - participants, other researchers, program staff, other community members, and so on.
Then we put all data in single framework & apply various statistical tools to find out the dynamic on the market.
During the analysis stage, feedback from the stakeholder groups would be compared to determine areas of agreement as well as areas of divergence


