
Key Insights
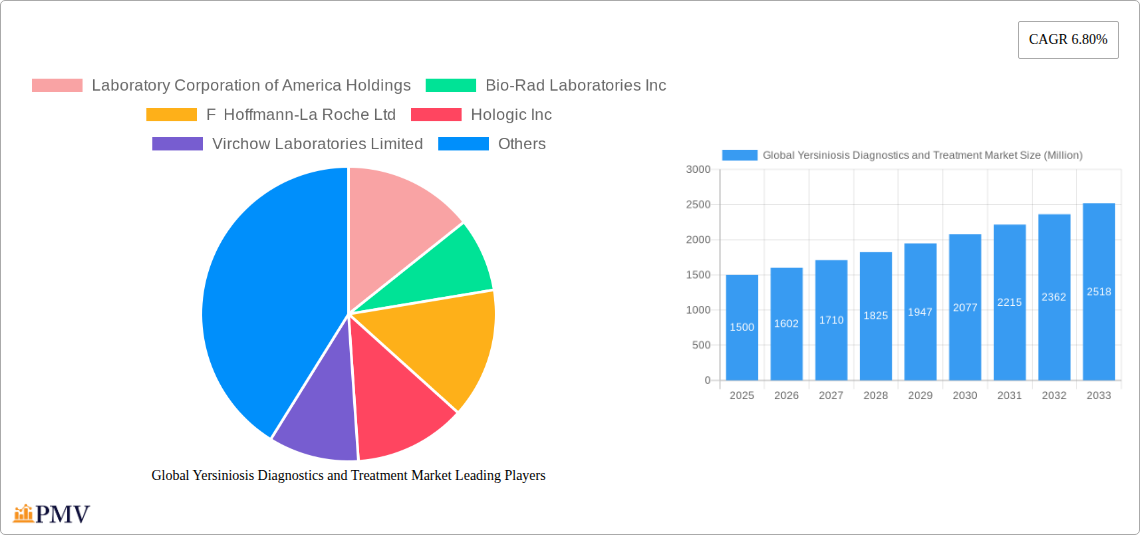
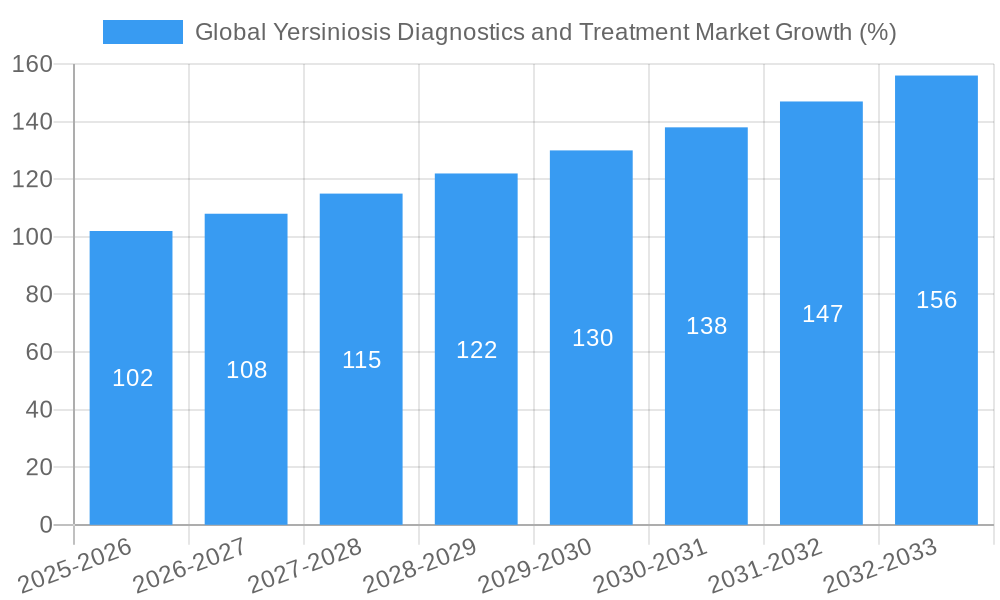
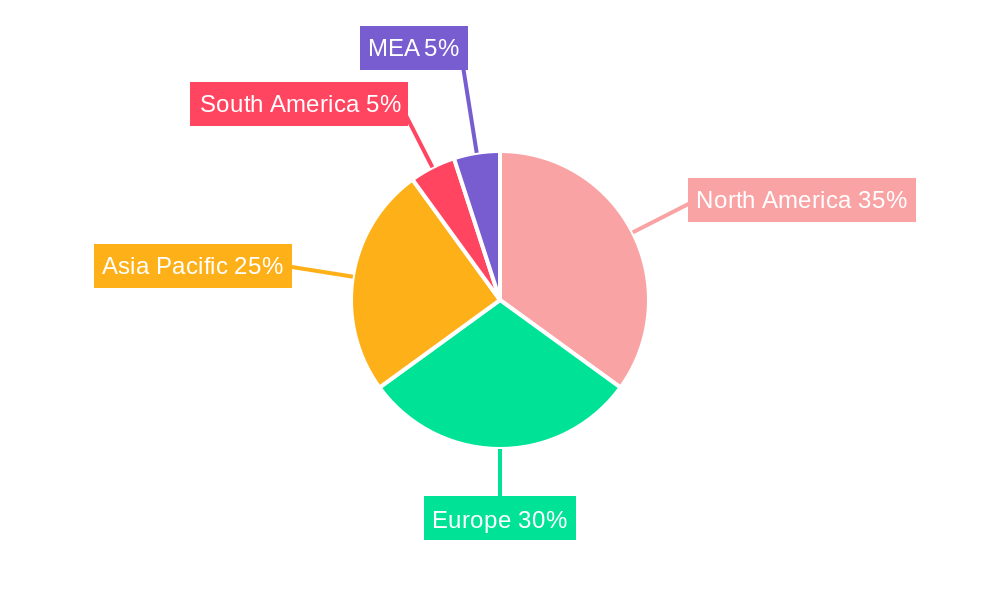
The global Yersiniosis diagnostics and treatment market is experiencing steady growth, projected to maintain a Compound Annual Growth Rate (CAGR) of 6.80% from 2025 to 2033. This expansion is driven by several key factors. Increasing prevalence of Yersinia infections, particularly Yersinia enterocolitica and Yersinia pseudotuberculosis, coupled with improved diagnostic techniques and a rising awareness among healthcare professionals, are significant contributors. The market is segmented by diagnosis techniques (including serological tests, PCR, and culture methods), bacterial species, and product type (diagnostic kits, therapeutic drugs). The development and adoption of more rapid, sensitive, and specific diagnostic tests are fueling market growth, particularly in regions with limited access to advanced healthcare infrastructure. Furthermore, the introduction of novel therapeutic agents and improved treatment protocols are enhancing patient outcomes and driving market expansion. The North American and European markets currently hold significant shares, attributed to established healthcare systems and robust research & development activities. However, emerging economies in Asia-Pacific are showing promising growth potential due to increasing healthcare spending and rising disease prevalence. Challenges to market expansion include the relatively low incidence of severe Yersiniosis cases in many parts of the world and the potential for cross-reactivity in diagnostic tests.
The competitive landscape is shaped by a mix of large multinational corporations like Roche, Bio-Rad, and Thermo Fisher Scientific, alongside specialized diagnostic companies and smaller pharmaceutical players. These companies are actively engaged in developing and commercializing advanced diagnostic tools and treatments. Strategic partnerships, mergers and acquisitions, and investments in research and development are common strategies for gaining market share. Future growth will likely depend on the successful development of point-of-care diagnostic tests, advancements in therapeutic options, including targeted therapies, and expansion into underserved markets. The market will also benefit from initiatives to improve surveillance and control of Yersinia infections. This includes enhancing public health programs focused on food safety and hygiene practices to reduce the incidence of infections and subsequent demand for diagnostics and treatment.
Global Yersiniosis Diagnostics and Treatment Market Report: 2019-2033
This comprehensive report provides a detailed analysis of the Global Yersiniosis Diagnostics and Treatment Market, offering invaluable insights for stakeholders across the healthcare industry. The study period covers 2019-2033, with 2025 serving as the base and estimated year. The forecast period spans 2025-2033, and the historical period encompasses 2019-2024. The report examines market segmentation by bacterial species (Yersinia enterocolitica, Yersinia pseudotuberculosis), product type (Diagnosis Technique), and therapeutic approaches. Key players like Laboratory Corporation of America Holdings, Bio-Rad Laboratories Inc, F Hoffmann-La Roche Ltd, and others are analyzed in detail. The report is meticulously crafted to boost search visibility with high-ranking keywords, including "Yersiniosis Diagnostics," "Yersinia enterocolitica Treatment," "Yersiniosis Therapeutics Market," and more.
Global Yersiniosis Diagnostics and Treatment Market Market Structure & Competitive Dynamics
The Global Yersiniosis Diagnostics and Treatment Market exhibits a moderately consolidated structure, with a few major players holding significant market share. The market is characterized by intense competition, driven by ongoing innovation in diagnostic techniques and therapeutic approaches. Regulatory frameworks, particularly concerning the approval of new diagnostic tests and therapies, play a crucial role in shaping market dynamics. The presence of substitute treatments and evolving end-user preferences (e.g., preference for rapid, point-of-care diagnostics) further influence market competition.
- Market Concentration: The top 5 players account for approximately xx% of the global market share in 2025, indicating a moderately concentrated market.
- Innovation Ecosystems: Significant investments in R&D by leading companies are fueling the development of advanced diagnostic tools and more effective therapies.
- Regulatory Frameworks: Stringent regulatory requirements for diagnostic and therapeutic approvals create barriers to entry but also ensure high product quality and safety.
- Product Substitutes: The availability of alternative treatments and diagnostic methods can limit market growth for specific products.
- End-User Trends: Growing demand for rapid and accurate diagnostic tests is driving innovation in point-of-care diagnostics.
- M&A Activities: The market has witnessed xx M&A deals in the past five years, with an average deal value of xx Million. These transactions often focus on enhancing product portfolios and expanding market reach.
Global Yersiniosis Diagnostics and Treatment Market Industry Trends & Insights
The Global Yersiniosis Diagnostics and Treatment Market is projected to experience a CAGR of xx% during the forecast period (2025-2033). This growth is fueled by several factors, including rising prevalence of Yersiniosis, increasing awareness of the disease, advancements in diagnostic technologies (e.g., PCR-based assays, ELISA tests), and the development of novel therapeutic strategies. Technological disruptions, such as the integration of AI and machine learning in diagnostics, are also contributing to market expansion. Consumer preference for faster, more accurate, and less invasive diagnostic methods is another key driver. The competitive landscape is marked by continuous product innovation, strategic partnerships, and expansion into emerging markets. Market penetration of advanced diagnostic tests is increasing gradually, projected to reach xx% by 2033.
Dominant Markets & Segments in Global Yersiniosis Diagnostics and Treatment Market
The North American region holds the dominant position in the Global Yersiniosis Diagnostics and Treatment Market, driven by factors such as well-established healthcare infrastructure, high healthcare expenditure, and increased adoption of advanced diagnostic technologies. Within North America, the United States exhibits the strongest market presence.
Key Drivers in North America:
- Well-developed healthcare infrastructure: Facilitates the adoption of advanced diagnostic tools and therapies.
- High healthcare expenditure: Supports investments in diagnostic testing and treatment.
- Stringent regulatory frameworks: Ensure product quality and safety.
- High awareness of Yersiniosis: Leads to increased demand for diagnostic tests and treatment.
Dominant Segment: The Diagnosis Technique segment holds the largest market share, driven by the increasing demand for accurate and rapid diagnostic tests. Within the bacterial species segment, Yersinia enterocolitica dominates due to its higher prevalence compared to Yersinia pseudotuberculosis.
Global Yersiniosis Diagnostics and Treatment Market Product Innovations
Recent years have witnessed significant advancements in Yersiniosis diagnostics, with a focus on developing rapid, sensitive, and specific tests. These innovations include the development of advanced molecular diagnostic techniques, such as PCR-based assays, improving the accuracy and speed of diagnosis. Furthermore, new therapeutic strategies are emerging, focusing on targeted therapies and personalized medicine approaches. This progress provides a competitive advantage to companies with innovative products, particularly those meeting the growing demand for accurate and rapid diagnostics.
Report Segmentation & Scope
This report provides a detailed segmentation of the Global Yersiniosis Diagnostics and Treatment Market.
By Bacterial Species: The market is segmented into Yersinia enterocolitica and Yersinia pseudotuberculosis. Yersinia enterocolitica is projected to hold a larger market share due to its higher prevalence. Competitive dynamics vary between these segments, with some companies specializing in diagnostics for specific species.
By Product Type: The market is segmented into Diagnosis Technique and Therapeutics. The Diagnosis Technique segment is currently larger, driven by the increasing adoption of advanced diagnostic tests. The Therapeutics segment is expected to grow at a faster rate due to ongoing research into new treatment modalities.
Other Diagnosis Techniques: This segment includes various diagnostic approaches, showing moderate growth driven by evolving diagnostic needs and technological advancements. Competition is fragmented within this segment.
Key Drivers of Global Yersiniosis Diagnostics and Treatment Market Growth
Several factors are driving the growth of the Global Yersiniosis Diagnostics and Treatment Market. Increased awareness of Yersiniosis and its potential complications is leading to higher diagnostic testing rates. Advancements in diagnostic technologies, such as rapid molecular tests, are enabling faster and more accurate diagnosis, improving patient outcomes. The development of new therapeutic strategies, including targeted therapies, contributes significantly to market growth. Finally, supportive government initiatives and funding for research and development further accelerate market expansion.
Challenges in the Global Yersiniosis Diagnostics and Treatment Market Sector
Despite the market's growth potential, several challenges exist. The high cost of advanced diagnostic tests and therapies can limit access for some patients, particularly in low- and middle-income countries. Moreover, the lack of standardized diagnostic protocols and treatment guidelines can hinder consistent care delivery. The need for effective disease surveillance and prevention programs to mitigate future outbreaks is also a significant challenge. Competition from existing treatments and the development of new therapies introduce further complexities.
Leading Players in the Global Yersiniosis Diagnostics and Treatment Market Market
- Laboratory Corporation of America Holdings
- Bio-Rad Laboratories Inc
- F Hoffmann-La Roche Ltd
- Hologic Inc
- Virchow Laboratories Limited
- Surmodics IVD Inc
- Thermo Fisher Scientific
- Zhejiang Jinhua CONBA Bio-pharm
- CerTest Biotec
- Pfizer Inc
- Mikrogen GmbH
Key Developments in Global Yersiniosis Diagnostics and Treatment Market Sector
- May 2021: CerTest Biotec expands production capacity for various diagnostic tests. This signifies a significant investment in meeting growing demand.
- November 2019: CerTest Biotec receives the Aragon Social Responsibility mark, enhancing its credibility and commitment to ethical practices.
Strategic Global Yersiniosis Diagnostics and Treatment Market Market Outlook
The Global Yersiniosis Diagnostics and Treatment Market is poised for significant growth, driven by ongoing technological advancements, increased disease awareness, and supportive regulatory environments. Strategic opportunities exist for companies focused on developing innovative diagnostic tools and therapies, particularly those targeting unmet needs in rapid diagnostics and personalized treatment. Expansion into emerging markets and strategic collaborations offer further potential for market growth and enhanced market share.
Global Yersiniosis Diagnostics and Treatment Market Segmentation
-
1. Bacterial Species
- 1.1. Yersinia enterocolitica
- 1.2. Yersinia pseudotuberculosis
-
2. Product Type
-
2.1. Diagnosis Technique
- 2.1.1. Real-Time PCR
- 2.1.2. ELISA
- 2.1.3. Immunoassay
- 2.1.4. Protein Microarray
- 2.1.5. Stool Culture
- 2.1.6. Other Diagnosis Technique
-
2.2. Therapeutics
- 2.2.1. Aminoglycosides
- 2.2.2. Sulfonamides
- 2.2.3. Cephalosporins
- 2.2.4. Fluoroquinolones
- 2.2.5. Tetracyclines
- 2.2.6. Other Therapeutics
-
2.1. Diagnosis Technique
Global Yersiniosis Diagnostics and Treatment Market Segmentation By Geography
-
1. North America
- 1.1. United States
- 1.2. Canada
- 1.3. Mexico
-
2. Europe
- 2.1. Germany
- 2.2. United Kingdom
- 2.3. France
- 2.4. Italy
- 2.5. Spain
- 2.6. Rest of Europe
-
3. Asia Pacific
- 3.1. China
- 3.2. Japan
- 3.3. India
- 3.4. Australia
- 3.5. South Korea
- 3.6. Rest of Asia Pacific
- 4. Rest of the World
Global Yersiniosis Diagnostics and Treatment Market REPORT HIGHLIGHTS
| Aspects | Details |
|---|---|
| Study Period | 2019-2033 |
| Base Year | 2024 |
| Estimated Year | 2025 |
| Forecast Period | 2025-2033 |
| Historical Period | 2019-2024 |
| Growth Rate | CAGR of 6.80% from 2019-2033 |
| Segmentation |
|
Table of Contents
- 1. Introduction
- 1.1. Research Scope
- 1.2. Market Segmentation
- 1.3. Research Methodology
- 1.4. Definitions and Assumptions
- 2. Executive Summary
- 2.1. Introduction
- 3. Market Dynamics
- 3.1. Introduction
- 3.2. Market Drivers
- 3.2.1. High Prevalence of Yersiniosis; Advent of More Advanced Diagnostic Technologies
- 3.3. Market Restrains
- 3.3.1. Lack of Awareness in Developing and Underdeveloped Countries
- 3.4. Market Trends
- 3.4.1. ELISA is Expected to Have a Major Share Over the Forecast Period
- 4. Market Factor Analysis
- 4.1. Porters Five Forces
- 4.2. Supply/Value Chain
- 4.3. PESTEL analysis
- 4.4. Market Entropy
- 4.5. Patent/Trademark Analysis
- 5. Global Yersiniosis Diagnostics and Treatment Market Analysis, Insights and Forecast, 2019-2031
- 5.1. Market Analysis, Insights and Forecast - by Bacterial Species
- 5.1.1. Yersinia enterocolitica
- 5.1.2. Yersinia pseudotuberculosis
- 5.2. Market Analysis, Insights and Forecast - by Product Type
- 5.2.1. Diagnosis Technique
- 5.2.1.1. Real-Time PCR
- 5.2.1.2. ELISA
- 5.2.1.3. Immunoassay
- 5.2.1.4. Protein Microarray
- 5.2.1.5. Stool Culture
- 5.2.1.6. Other Diagnosis Technique
- 5.2.2. Therapeutics
- 5.2.2.1. Aminoglycosides
- 5.2.2.2. Sulfonamides
- 5.2.2.3. Cephalosporins
- 5.2.2.4. Fluoroquinolones
- 5.2.2.5. Tetracyclines
- 5.2.2.6. Other Therapeutics
- 5.2.1. Diagnosis Technique
- 5.3. Market Analysis, Insights and Forecast - by Region
- 5.3.1. North America
- 5.3.2. Europe
- 5.3.3. Asia Pacific
- 5.3.4. Rest of the World
- 5.1. Market Analysis, Insights and Forecast - by Bacterial Species
- 6. North America Global Yersiniosis Diagnostics and Treatment Market Analysis, Insights and Forecast, 2019-2031
- 6.1. Market Analysis, Insights and Forecast - by Bacterial Species
- 6.1.1. Yersinia enterocolitica
- 6.1.2. Yersinia pseudotuberculosis
- 6.2. Market Analysis, Insights and Forecast - by Product Type
- 6.2.1. Diagnosis Technique
- 6.2.1.1. Real-Time PCR
- 6.2.1.2. ELISA
- 6.2.1.3. Immunoassay
- 6.2.1.4. Protein Microarray
- 6.2.1.5. Stool Culture
- 6.2.1.6. Other Diagnosis Technique
- 6.2.2. Therapeutics
- 6.2.2.1. Aminoglycosides
- 6.2.2.2. Sulfonamides
- 6.2.2.3. Cephalosporins
- 6.2.2.4. Fluoroquinolones
- 6.2.2.5. Tetracyclines
- 6.2.2.6. Other Therapeutics
- 6.2.1. Diagnosis Technique
- 6.1. Market Analysis, Insights and Forecast - by Bacterial Species
- 7. Europe Global Yersiniosis Diagnostics and Treatment Market Analysis, Insights and Forecast, 2019-2031
- 7.1. Market Analysis, Insights and Forecast - by Bacterial Species
- 7.1.1. Yersinia enterocolitica
- 7.1.2. Yersinia pseudotuberculosis
- 7.2. Market Analysis, Insights and Forecast - by Product Type
- 7.2.1. Diagnosis Technique
- 7.2.1.1. Real-Time PCR
- 7.2.1.2. ELISA
- 7.2.1.3. Immunoassay
- 7.2.1.4. Protein Microarray
- 7.2.1.5. Stool Culture
- 7.2.1.6. Other Diagnosis Technique
- 7.2.2. Therapeutics
- 7.2.2.1. Aminoglycosides
- 7.2.2.2. Sulfonamides
- 7.2.2.3. Cephalosporins
- 7.2.2.4. Fluoroquinolones
- 7.2.2.5. Tetracyclines
- 7.2.2.6. Other Therapeutics
- 7.2.1. Diagnosis Technique
- 7.1. Market Analysis, Insights and Forecast - by Bacterial Species
- 8. Asia Pacific Global Yersiniosis Diagnostics and Treatment Market Analysis, Insights and Forecast, 2019-2031
- 8.1. Market Analysis, Insights and Forecast - by Bacterial Species
- 8.1.1. Yersinia enterocolitica
- 8.1.2. Yersinia pseudotuberculosis
- 8.2. Market Analysis, Insights and Forecast - by Product Type
- 8.2.1. Diagnosis Technique
- 8.2.1.1. Real-Time PCR
- 8.2.1.2. ELISA
- 8.2.1.3. Immunoassay
- 8.2.1.4. Protein Microarray
- 8.2.1.5. Stool Culture
- 8.2.1.6. Other Diagnosis Technique
- 8.2.2. Therapeutics
- 8.2.2.1. Aminoglycosides
- 8.2.2.2. Sulfonamides
- 8.2.2.3. Cephalosporins
- 8.2.2.4. Fluoroquinolones
- 8.2.2.5. Tetracyclines
- 8.2.2.6. Other Therapeutics
- 8.2.1. Diagnosis Technique
- 8.1. Market Analysis, Insights and Forecast - by Bacterial Species
- 9. Rest of the World Global Yersiniosis Diagnostics and Treatment Market Analysis, Insights and Forecast, 2019-2031
- 9.1. Market Analysis, Insights and Forecast - by Bacterial Species
- 9.1.1. Yersinia enterocolitica
- 9.1.2. Yersinia pseudotuberculosis
- 9.2. Market Analysis, Insights and Forecast - by Product Type
- 9.2.1. Diagnosis Technique
- 9.2.1.1. Real-Time PCR
- 9.2.1.2. ELISA
- 9.2.1.3. Immunoassay
- 9.2.1.4. Protein Microarray
- 9.2.1.5. Stool Culture
- 9.2.1.6. Other Diagnosis Technique
- 9.2.2. Therapeutics
- 9.2.2.1. Aminoglycosides
- 9.2.2.2. Sulfonamides
- 9.2.2.3. Cephalosporins
- 9.2.2.4. Fluoroquinolones
- 9.2.2.5. Tetracyclines
- 9.2.2.6. Other Therapeutics
- 9.2.1. Diagnosis Technique
- 9.1. Market Analysis, Insights and Forecast - by Bacterial Species
- 10. North America Global Yersiniosis Diagnostics and Treatment Market Analysis, Insights and Forecast, 2019-2031
- 10.1. Market Analysis, Insights and Forecast - By Country/Sub-region
- 10.1.1 United States
- 10.1.2 Canada
- 10.1.3 Mexico
- 11. Europe Global Yersiniosis Diagnostics and Treatment Market Analysis, Insights and Forecast, 2019-2031
- 11.1. Market Analysis, Insights and Forecast - By Country/Sub-region
- 11.1.1 Germany
- 11.1.2 United Kingdom
- 11.1.3 France
- 11.1.4 Spain
- 11.1.5 Italy
- 11.1.6 Spain
- 11.1.7 Belgium
- 11.1.8 Netherland
- 11.1.9 Nordics
- 11.1.10 Rest of Europe
- 12. Asia Pacific Global Yersiniosis Diagnostics and Treatment Market Analysis, Insights and Forecast, 2019-2031
- 12.1. Market Analysis, Insights and Forecast - By Country/Sub-region
- 12.1.1 China
- 12.1.2 Japan
- 12.1.3 India
- 12.1.4 South Korea
- 12.1.5 Southeast Asia
- 12.1.6 Australia
- 12.1.7 Indonesia
- 12.1.8 Phillipes
- 12.1.9 Singapore
- 12.1.10 Thailandc
- 12.1.11 Rest of Asia Pacific
- 13. South America Global Yersiniosis Diagnostics and Treatment Market Analysis, Insights and Forecast, 2019-2031
- 13.1. Market Analysis, Insights and Forecast - By Country/Sub-region
- 13.1.1 Brazil
- 13.1.2 Argentina
- 13.1.3 Peru
- 13.1.4 Chile
- 13.1.5 Colombia
- 13.1.6 Ecuador
- 13.1.7 Venezuela
- 13.1.8 Rest of South America
- 14. North America Global Yersiniosis Diagnostics and Treatment Market Analysis, Insights and Forecast, 2019-2031
- 14.1. Market Analysis, Insights and Forecast - By Country/Sub-region
- 14.1.1 United States
- 14.1.2 Canada
- 14.1.3 Mexico
- 15. MEA Global Yersiniosis Diagnostics and Treatment Market Analysis, Insights and Forecast, 2019-2031
- 15.1. Market Analysis, Insights and Forecast - By Country/Sub-region
- 15.1.1 United Arab Emirates
- 15.1.2 Saudi Arabia
- 15.1.3 South Africa
- 15.1.4 Rest of Middle East and Africa
- 16. Competitive Analysis
- 16.1. Market Share Analysis 2024
- 16.2. Company Profiles
- 16.2.1 Laboratory Corporation of America Holdings
- 16.2.1.1. Overview
- 16.2.1.2. Products
- 16.2.1.3. SWOT Analysis
- 16.2.1.4. Recent Developments
- 16.2.1.5. Financials (Based on Availability)
- 16.2.2 Bio-Rad Laboratories Inc
- 16.2.2.1. Overview
- 16.2.2.2. Products
- 16.2.2.3. SWOT Analysis
- 16.2.2.4. Recent Developments
- 16.2.2.5. Financials (Based on Availability)
- 16.2.3 F Hoffmann-La Roche Ltd
- 16.2.3.1. Overview
- 16.2.3.2. Products
- 16.2.3.3. SWOT Analysis
- 16.2.3.4. Recent Developments
- 16.2.3.5. Financials (Based on Availability)
- 16.2.4 Hologic Inc
- 16.2.4.1. Overview
- 16.2.4.2. Products
- 16.2.4.3. SWOT Analysis
- 16.2.4.4. Recent Developments
- 16.2.4.5. Financials (Based on Availability)
- 16.2.5 Virchow Laboratories Limited
- 16.2.5.1. Overview
- 16.2.5.2. Products
- 16.2.5.3. SWOT Analysis
- 16.2.5.4. Recent Developments
- 16.2.5.5. Financials (Based on Availability)
- 16.2.6 Surmodics IVD Inc
- 16.2.6.1. Overview
- 16.2.6.2. Products
- 16.2.6.3. SWOT Analysis
- 16.2.6.4. Recent Developments
- 16.2.6.5. Financials (Based on Availability)
- 16.2.7 Thermo Fisher Scientific
- 16.2.7.1. Overview
- 16.2.7.2. Products
- 16.2.7.3. SWOT Analysis
- 16.2.7.4. Recent Developments
- 16.2.7.5. Financials (Based on Availability)
- 16.2.8 Zhejiang Jinhua CONBA Bio-pharm
- 16.2.8.1. Overview
- 16.2.8.2. Products
- 16.2.8.3. SWOT Analysis
- 16.2.8.4. Recent Developments
- 16.2.8.5. Financials (Based on Availability)
- 16.2.9 CerTest Biotec
- 16.2.9.1. Overview
- 16.2.9.2. Products
- 16.2.9.3. SWOT Analysis
- 16.2.9.4. Recent Developments
- 16.2.9.5. Financials (Based on Availability)
- 16.2.10 Pfizer Inc
- 16.2.10.1. Overview
- 16.2.10.2. Products
- 16.2.10.3. SWOT Analysis
- 16.2.10.4. Recent Developments
- 16.2.10.5. Financials (Based on Availability)
- 16.2.11 Mikrogen GmbH
- 16.2.11.1. Overview
- 16.2.11.2. Products
- 16.2.11.3. SWOT Analysis
- 16.2.11.4. Recent Developments
- 16.2.11.5. Financials (Based on Availability)
- 16.2.1 Laboratory Corporation of America Holdings
List of Figures
- Figure 1: Global Global Yersiniosis Diagnostics and Treatment Market Revenue Breakdown (Million, %) by Region 2024 & 2032
- Figure 2: North America Global Yersiniosis Diagnostics and Treatment Market Revenue (Million), by Country 2024 & 2032
- Figure 3: North America Global Yersiniosis Diagnostics and Treatment Market Revenue Share (%), by Country 2024 & 2032
- Figure 4: Europe Global Yersiniosis Diagnostics and Treatment Market Revenue (Million), by Country 2024 & 2032
- Figure 5: Europe Global Yersiniosis Diagnostics and Treatment Market Revenue Share (%), by Country 2024 & 2032
- Figure 6: Asia Pacific Global Yersiniosis Diagnostics and Treatment Market Revenue (Million), by Country 2024 & 2032
- Figure 7: Asia Pacific Global Yersiniosis Diagnostics and Treatment Market Revenue Share (%), by Country 2024 & 2032
- Figure 8: South America Global Yersiniosis Diagnostics and Treatment Market Revenue (Million), by Country 2024 & 2032
- Figure 9: South America Global Yersiniosis Diagnostics and Treatment Market Revenue Share (%), by Country 2024 & 2032
- Figure 10: North America Global Yersiniosis Diagnostics and Treatment Market Revenue (Million), by Country 2024 & 2032
- Figure 11: North America Global Yersiniosis Diagnostics and Treatment Market Revenue Share (%), by Country 2024 & 2032
- Figure 12: MEA Global Yersiniosis Diagnostics and Treatment Market Revenue (Million), by Country 2024 & 2032
- Figure 13: MEA Global Yersiniosis Diagnostics and Treatment Market Revenue Share (%), by Country 2024 & 2032
- Figure 14: North America Global Yersiniosis Diagnostics and Treatment Market Revenue (Million), by Bacterial Species 2024 & 2032
- Figure 15: North America Global Yersiniosis Diagnostics and Treatment Market Revenue Share (%), by Bacterial Species 2024 & 2032
- Figure 16: North America Global Yersiniosis Diagnostics and Treatment Market Revenue (Million), by Product Type 2024 & 2032
- Figure 17: North America Global Yersiniosis Diagnostics and Treatment Market Revenue Share (%), by Product Type 2024 & 2032
- Figure 18: North America Global Yersiniosis Diagnostics and Treatment Market Revenue (Million), by Country 2024 & 2032
- Figure 19: North America Global Yersiniosis Diagnostics and Treatment Market Revenue Share (%), by Country 2024 & 2032
- Figure 20: Europe Global Yersiniosis Diagnostics and Treatment Market Revenue (Million), by Bacterial Species 2024 & 2032
- Figure 21: Europe Global Yersiniosis Diagnostics and Treatment Market Revenue Share (%), by Bacterial Species 2024 & 2032
- Figure 22: Europe Global Yersiniosis Diagnostics and Treatment Market Revenue (Million), by Product Type 2024 & 2032
- Figure 23: Europe Global Yersiniosis Diagnostics and Treatment Market Revenue Share (%), by Product Type 2024 & 2032
- Figure 24: Europe Global Yersiniosis Diagnostics and Treatment Market Revenue (Million), by Country 2024 & 2032
- Figure 25: Europe Global Yersiniosis Diagnostics and Treatment Market Revenue Share (%), by Country 2024 & 2032
- Figure 26: Asia Pacific Global Yersiniosis Diagnostics and Treatment Market Revenue (Million), by Bacterial Species 2024 & 2032
- Figure 27: Asia Pacific Global Yersiniosis Diagnostics and Treatment Market Revenue Share (%), by Bacterial Species 2024 & 2032
- Figure 28: Asia Pacific Global Yersiniosis Diagnostics and Treatment Market Revenue (Million), by Product Type 2024 & 2032
- Figure 29: Asia Pacific Global Yersiniosis Diagnostics and Treatment Market Revenue Share (%), by Product Type 2024 & 2032
- Figure 30: Asia Pacific Global Yersiniosis Diagnostics and Treatment Market Revenue (Million), by Country 2024 & 2032
- Figure 31: Asia Pacific Global Yersiniosis Diagnostics and Treatment Market Revenue Share (%), by Country 2024 & 2032
- Figure 32: Rest of the World Global Yersiniosis Diagnostics and Treatment Market Revenue (Million), by Bacterial Species 2024 & 2032
- Figure 33: Rest of the World Global Yersiniosis Diagnostics and Treatment Market Revenue Share (%), by Bacterial Species 2024 & 2032
- Figure 34: Rest of the World Global Yersiniosis Diagnostics and Treatment Market Revenue (Million), by Product Type 2024 & 2032
- Figure 35: Rest of the World Global Yersiniosis Diagnostics and Treatment Market Revenue Share (%), by Product Type 2024 & 2032
- Figure 36: Rest of the World Global Yersiniosis Diagnostics and Treatment Market Revenue (Million), by Country 2024 & 2032
- Figure 37: Rest of the World Global Yersiniosis Diagnostics and Treatment Market Revenue Share (%), by Country 2024 & 2032
List of Tables
- Table 1: Global Yersiniosis Diagnostics and Treatment Market Revenue Million Forecast, by Region 2019 & 2032
- Table 2: Global Yersiniosis Diagnostics and Treatment Market Revenue Million Forecast, by Bacterial Species 2019 & 2032
- Table 3: Global Yersiniosis Diagnostics and Treatment Market Revenue Million Forecast, by Product Type 2019 & 2032
- Table 4: Global Yersiniosis Diagnostics and Treatment Market Revenue Million Forecast, by Region 2019 & 2032
- Table 5: Global Yersiniosis Diagnostics and Treatment Market Revenue Million Forecast, by Country 2019 & 2032
- Table 6: United States Global Yersiniosis Diagnostics and Treatment Market Revenue (Million) Forecast, by Application 2019 & 2032
- Table 7: Canada Global Yersiniosis Diagnostics and Treatment Market Revenue (Million) Forecast, by Application 2019 & 2032
- Table 8: Mexico Global Yersiniosis Diagnostics and Treatment Market Revenue (Million) Forecast, by Application 2019 & 2032
- Table 9: Global Yersiniosis Diagnostics and Treatment Market Revenue Million Forecast, by Country 2019 & 2032
- Table 10: Germany Global Yersiniosis Diagnostics and Treatment Market Revenue (Million) Forecast, by Application 2019 & 2032
- Table 11: United Kingdom Global Yersiniosis Diagnostics and Treatment Market Revenue (Million) Forecast, by Application 2019 & 2032
- Table 12: France Global Yersiniosis Diagnostics and Treatment Market Revenue (Million) Forecast, by Application 2019 & 2032
- Table 13: Spain Global Yersiniosis Diagnostics and Treatment Market Revenue (Million) Forecast, by Application 2019 & 2032
- Table 14: Italy Global Yersiniosis Diagnostics and Treatment Market Revenue (Million) Forecast, by Application 2019 & 2032
- Table 15: Spain Global Yersiniosis Diagnostics and Treatment Market Revenue (Million) Forecast, by Application 2019 & 2032
- Table 16: Belgium Global Yersiniosis Diagnostics and Treatment Market Revenue (Million) Forecast, by Application 2019 & 2032
- Table 17: Netherland Global Yersiniosis Diagnostics and Treatment Market Revenue (Million) Forecast, by Application 2019 & 2032
- Table 18: Nordics Global Yersiniosis Diagnostics and Treatment Market Revenue (Million) Forecast, by Application 2019 & 2032
- Table 19: Rest of Europe Global Yersiniosis Diagnostics and Treatment Market Revenue (Million) Forecast, by Application 2019 & 2032
- Table 20: Global Yersiniosis Diagnostics and Treatment Market Revenue Million Forecast, by Country 2019 & 2032
- Table 21: China Global Yersiniosis Diagnostics and Treatment Market Revenue (Million) Forecast, by Application 2019 & 2032
- Table 22: Japan Global Yersiniosis Diagnostics and Treatment Market Revenue (Million) Forecast, by Application 2019 & 2032
- Table 23: India Global Yersiniosis Diagnostics and Treatment Market Revenue (Million) Forecast, by Application 2019 & 2032
- Table 24: South Korea Global Yersiniosis Diagnostics and Treatment Market Revenue (Million) Forecast, by Application 2019 & 2032
- Table 25: Southeast Asia Global Yersiniosis Diagnostics and Treatment Market Revenue (Million) Forecast, by Application 2019 & 2032
- Table 26: Australia Global Yersiniosis Diagnostics and Treatment Market Revenue (Million) Forecast, by Application 2019 & 2032
- Table 27: Indonesia Global Yersiniosis Diagnostics and Treatment Market Revenue (Million) Forecast, by Application 2019 & 2032
- Table 28: Phillipes Global Yersiniosis Diagnostics and Treatment Market Revenue (Million) Forecast, by Application 2019 & 2032
- Table 29: Singapore Global Yersiniosis Diagnostics and Treatment Market Revenue (Million) Forecast, by Application 2019 & 2032
- Table 30: Thailandc Global Yersiniosis Diagnostics and Treatment Market Revenue (Million) Forecast, by Application 2019 & 2032
- Table 31: Rest of Asia Pacific Global Yersiniosis Diagnostics and Treatment Market Revenue (Million) Forecast, by Application 2019 & 2032
- Table 32: Global Yersiniosis Diagnostics and Treatment Market Revenue Million Forecast, by Country 2019 & 2032
- Table 33: Brazil Global Yersiniosis Diagnostics and Treatment Market Revenue (Million) Forecast, by Application 2019 & 2032
- Table 34: Argentina Global Yersiniosis Diagnostics and Treatment Market Revenue (Million) Forecast, by Application 2019 & 2032
- Table 35: Peru Global Yersiniosis Diagnostics and Treatment Market Revenue (Million) Forecast, by Application 2019 & 2032
- Table 36: Chile Global Yersiniosis Diagnostics and Treatment Market Revenue (Million) Forecast, by Application 2019 & 2032
- Table 37: Colombia Global Yersiniosis Diagnostics and Treatment Market Revenue (Million) Forecast, by Application 2019 & 2032
- Table 38: Ecuador Global Yersiniosis Diagnostics and Treatment Market Revenue (Million) Forecast, by Application 2019 & 2032
- Table 39: Venezuela Global Yersiniosis Diagnostics and Treatment Market Revenue (Million) Forecast, by Application 2019 & 2032
- Table 40: Rest of South America Global Yersiniosis Diagnostics and Treatment Market Revenue (Million) Forecast, by Application 2019 & 2032
- Table 41: Global Yersiniosis Diagnostics and Treatment Market Revenue Million Forecast, by Country 2019 & 2032
- Table 42: United States Global Yersiniosis Diagnostics and Treatment Market Revenue (Million) Forecast, by Application 2019 & 2032
- Table 43: Canada Global Yersiniosis Diagnostics and Treatment Market Revenue (Million) Forecast, by Application 2019 & 2032
- Table 44: Mexico Global Yersiniosis Diagnostics and Treatment Market Revenue (Million) Forecast, by Application 2019 & 2032
- Table 45: Global Yersiniosis Diagnostics and Treatment Market Revenue Million Forecast, by Country 2019 & 2032
- Table 46: United Arab Emirates Global Yersiniosis Diagnostics and Treatment Market Revenue (Million) Forecast, by Application 2019 & 2032
- Table 47: Saudi Arabia Global Yersiniosis Diagnostics and Treatment Market Revenue (Million) Forecast, by Application 2019 & 2032
- Table 48: South Africa Global Yersiniosis Diagnostics and Treatment Market Revenue (Million) Forecast, by Application 2019 & 2032
- Table 49: Rest of Middle East and Africa Global Yersiniosis Diagnostics and Treatment Market Revenue (Million) Forecast, by Application 2019 & 2032
- Table 50: Global Yersiniosis Diagnostics and Treatment Market Revenue Million Forecast, by Bacterial Species 2019 & 2032
- Table 51: Global Yersiniosis Diagnostics and Treatment Market Revenue Million Forecast, by Product Type 2019 & 2032
- Table 52: Global Yersiniosis Diagnostics and Treatment Market Revenue Million Forecast, by Country 2019 & 2032
- Table 53: United States Global Yersiniosis Diagnostics and Treatment Market Revenue (Million) Forecast, by Application 2019 & 2032
- Table 54: Canada Global Yersiniosis Diagnostics and Treatment Market Revenue (Million) Forecast, by Application 2019 & 2032
- Table 55: Mexico Global Yersiniosis Diagnostics and Treatment Market Revenue (Million) Forecast, by Application 2019 & 2032
- Table 56: Global Yersiniosis Diagnostics and Treatment Market Revenue Million Forecast, by Bacterial Species 2019 & 2032
- Table 57: Global Yersiniosis Diagnostics and Treatment Market Revenue Million Forecast, by Product Type 2019 & 2032
- Table 58: Global Yersiniosis Diagnostics and Treatment Market Revenue Million Forecast, by Country 2019 & 2032
- Table 59: Germany Global Yersiniosis Diagnostics and Treatment Market Revenue (Million) Forecast, by Application 2019 & 2032
- Table 60: United Kingdom Global Yersiniosis Diagnostics and Treatment Market Revenue (Million) Forecast, by Application 2019 & 2032
- Table 61: France Global Yersiniosis Diagnostics and Treatment Market Revenue (Million) Forecast, by Application 2019 & 2032
- Table 62: Italy Global Yersiniosis Diagnostics and Treatment Market Revenue (Million) Forecast, by Application 2019 & 2032
- Table 63: Spain Global Yersiniosis Diagnostics and Treatment Market Revenue (Million) Forecast, by Application 2019 & 2032
- Table 64: Rest of Europe Global Yersiniosis Diagnostics and Treatment Market Revenue (Million) Forecast, by Application 2019 & 2032
- Table 65: Global Yersiniosis Diagnostics and Treatment Market Revenue Million Forecast, by Bacterial Species 2019 & 2032
- Table 66: Global Yersiniosis Diagnostics and Treatment Market Revenue Million Forecast, by Product Type 2019 & 2032
- Table 67: Global Yersiniosis Diagnostics and Treatment Market Revenue Million Forecast, by Country 2019 & 2032
- Table 68: China Global Yersiniosis Diagnostics and Treatment Market Revenue (Million) Forecast, by Application 2019 & 2032
- Table 69: Japan Global Yersiniosis Diagnostics and Treatment Market Revenue (Million) Forecast, by Application 2019 & 2032
- Table 70: India Global Yersiniosis Diagnostics and Treatment Market Revenue (Million) Forecast, by Application 2019 & 2032
- Table 71: Australia Global Yersiniosis Diagnostics and Treatment Market Revenue (Million) Forecast, by Application 2019 & 2032
- Table 72: South Korea Global Yersiniosis Diagnostics and Treatment Market Revenue (Million) Forecast, by Application 2019 & 2032
- Table 73: Rest of Asia Pacific Global Yersiniosis Diagnostics and Treatment Market Revenue (Million) Forecast, by Application 2019 & 2032
- Table 74: Global Yersiniosis Diagnostics and Treatment Market Revenue Million Forecast, by Bacterial Species 2019 & 2032
- Table 75: Global Yersiniosis Diagnostics and Treatment Market Revenue Million Forecast, by Product Type 2019 & 2032
- Table 76: Global Yersiniosis Diagnostics and Treatment Market Revenue Million Forecast, by Country 2019 & 2032
Frequently Asked Questions
1. What is the projected Compound Annual Growth Rate (CAGR) of the Global Yersiniosis Diagnostics and Treatment Market?
The projected CAGR is approximately 6.80%.
2. Which companies are prominent players in the Global Yersiniosis Diagnostics and Treatment Market?
Key companies in the market include Laboratory Corporation of America Holdings, Bio-Rad Laboratories Inc, F Hoffmann-La Roche Ltd, Hologic Inc, Virchow Laboratories Limited, Surmodics IVD Inc, Thermo Fisher Scientific, Zhejiang Jinhua CONBA Bio-pharm, CerTest Biotec, Pfizer Inc, Mikrogen GmbH.
3. What are the main segments of the Global Yersiniosis Diagnostics and Treatment Market?
The market segments include Bacterial Species, Product Type.
4. Can you provide details about the market size?
The market size is estimated to be USD XX Million as of 2022.
5. What are some drivers contributing to market growth?
High Prevalence of Yersiniosis; Advent of More Advanced Diagnostic Technologies.
6. What are the notable trends driving market growth?
ELISA is Expected to Have a Major Share Over the Forecast Period.
7. Are there any restraints impacting market growth?
Lack of Awareness in Developing and Underdeveloped Countries.
8. Can you provide examples of recent developments in the market?
In May 2021, CerTest announced that it has reached the final stage in the extension of its production capacity and the enlargement of the plant located in San Mateo de Gallego, in Zaragoza. In 2021, the company also started working on new production lines for various diagnostic tests.
9. What pricing options are available for accessing the report?
Pricing options include single-user, multi-user, and enterprise licenses priced at USD 4750, USD 5250, and USD 8750 respectively.
10. Is the market size provided in terms of value or volume?
The market size is provided in terms of value, measured in Million.
11. Are there any specific market keywords associated with the report?
Yes, the market keyword associated with the report is "Global Yersiniosis Diagnostics and Treatment Market," which aids in identifying and referencing the specific market segment covered.
12. How do I determine which pricing option suits my needs best?
The pricing options vary based on user requirements and access needs. Individual users may opt for single-user licenses, while businesses requiring broader access may choose multi-user or enterprise licenses for cost-effective access to the report.
13. Are there any additional resources or data provided in the Global Yersiniosis Diagnostics and Treatment Market report?
While the report offers comprehensive insights, it's advisable to review the specific contents or supplementary materials provided to ascertain if additional resources or data are available.
14. How can I stay updated on further developments or reports in the Global Yersiniosis Diagnostics and Treatment Market?
To stay informed about further developments, trends, and reports in the Global Yersiniosis Diagnostics and Treatment Market, consider subscribing to industry newsletters, following relevant companies and organizations, or regularly checking reputable industry news sources and publications.
Methodology
Step 1 - Identification of Relevant Samples Size from Population Database


Step 2 - Approaches for Defining Global Market Size (Value, Volume* & Price*)

Note*: In applicable scenarios
Step 3 - Data Sources
Primary Research
- Web Analytics
- Survey Reports
- Research Institute
- Latest Research Reports
- Opinion Leaders
Secondary Research
- Annual Reports
- White Paper
- Latest Press Release
- Industry Association
- Paid Database
- Investor Presentations

Step 4 - Data Triangulation
Involves using different sources of information in order to increase the validity of a study
These sources are likely to be stakeholders in a program - participants, other researchers, program staff, other community members, and so on.
Then we put all data in single framework & apply various statistical tools to find out the dynamic on the market.
During the analysis stage, feedback from the stakeholder groups would be compared to determine areas of agreement as well as areas of divergence


