
Key Insights
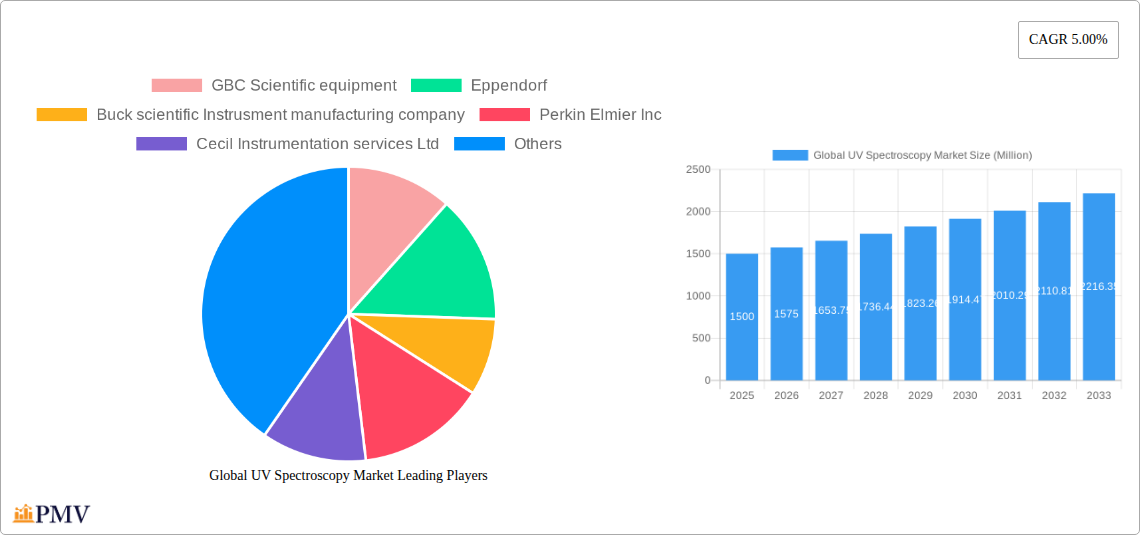
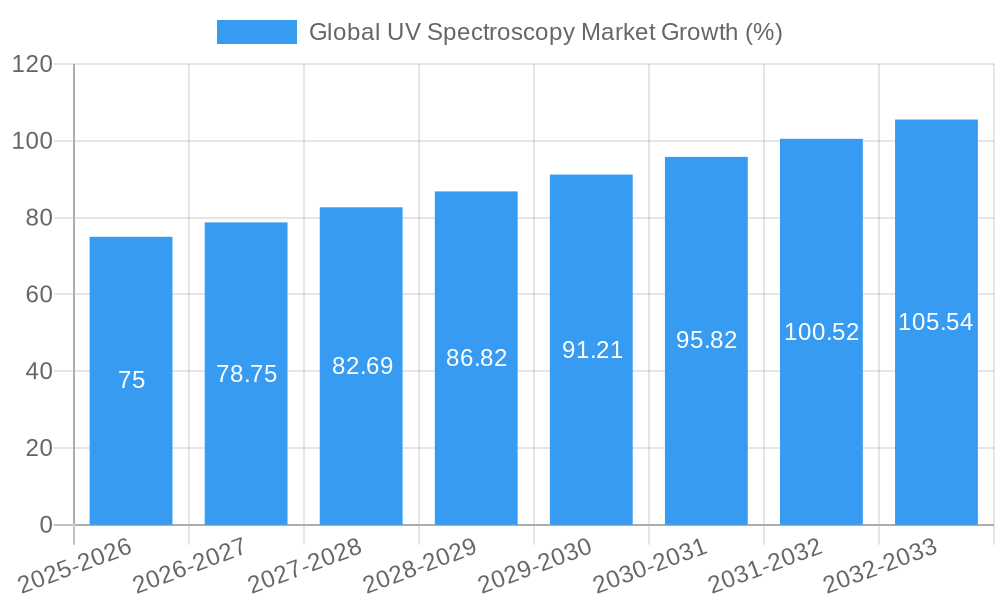
The global UV spectroscopy market is experiencing steady growth, projected at a 5.00% CAGR from 2025 to 2033. This growth is driven by increasing demand from pharmaceutical and biotechnology companies for quality control and research applications, coupled with the expanding use of UV spectroscopy in environmental monitoring and academic research. Technological advancements, particularly in array-based systems offering higher throughput and sensitivity, are further fueling market expansion. The pharmaceutical and biotechnology sectors represent a significant portion of the market, utilizing UV spectroscopy for drug discovery, formulation development, and impurity analysis. Academic and research institutions also contribute substantially, leveraging the technique for various analytical studies. While the market faces some constraints, such as the high cost of sophisticated instruments and the need for skilled operators, the overall positive trend is expected to persist. Geographic distribution shows significant contributions from North America and Europe, driven by established research infrastructures and regulatory frameworks. However, the Asia-Pacific region is projected to witness faster growth due to expanding industrialization and increasing investments in research and development activities. The market segmentation by instrument type (single-beam, dual-beam, array-based) reflects evolving technology adoption, with array-based systems gaining traction due to their advantages. Leading companies like Thermo Fisher Scientific, Shimadzu Corporation, and PerkinElmer are key players, driving innovation and competition in this dynamic market. The forecast period indicates continued market expansion, with array-based systems and the Asia-Pacific region expected to be major growth drivers.
The continued adoption of advanced UV spectroscopy techniques across diverse applications guarantees market resilience. The increasing prevalence of stringent regulatory guidelines in various industries, especially pharmaceuticals, necessitates accurate and reliable analytical methods, further underpinning the importance of UV spectroscopy. Moreover, rising environmental concerns are driving the utilization of this technology for environmental monitoring and pollution control, presenting a significant opportunity for market growth. While competition among established players is intense, the emergence of innovative solutions and the continuous need for enhanced analytical capabilities will maintain the market's dynamic nature and stimulate further growth throughout the forecast period. Strategic collaborations and mergers and acquisitions are also anticipated to shape the market landscape in the coming years. Overall, the outlook for the global UV spectroscopy market remains positive, promising consistent growth and increased adoption across diverse sectors.
Global UV Spectroscopy Market Report: 2019-2033
This comprehensive report provides an in-depth analysis of the global UV spectroscopy market, offering valuable insights for stakeholders across the industry. With a detailed examination of market dynamics, competitive landscape, and future growth projections, this report is an essential resource for informed decision-making. The study period covers 2019-2033, with 2025 as the base and estimated year, and a forecast period of 2025-2033. The historical period analyzed is 2019-2024.
Global UV Spectroscopy Market Market Structure & Competitive Dynamics
The global UV spectroscopy market exhibits a moderately concentrated structure, with key players such as ThermoFisher Scientific, Shimadzu Corporation, and Agilent Technologies holding significant market share. The market's innovation ecosystem is vibrant, driven by continuous advancements in instrument technology, software integration, and application-specific solutions. Stringent regulatory frameworks, particularly concerning data security and environmental compliance, significantly influence market operations. The market witnesses ongoing M&A activity, with deal values varying considerably depending on the size and strategic importance of the acquired entity. Product substitution primarily involves the adoption of advanced techniques like Raman spectroscopy for specific applications. End-user trends are leaning towards automation, higher throughput, and enhanced data analysis capabilities.
- Market Concentration: Moderately concentrated, with top players holding xx% market share.
- Innovation Ecosystem: Driven by advancements in instrument technology and software.
- Regulatory Frameworks: Stringent regulations impacting data security and environmental compliance.
- Product Substitutes: Raman spectroscopy is a key substitute for certain applications.
- M&A Activity: Ongoing, with deal values ranging from xx Million to xx Million.
- End-User Trends: Focus on automation, higher throughput, and data analysis.
Global UV Spectroscopy Market Industry Trends & Insights
The global UV spectroscopy market is experiencing robust growth, driven by the increasing adoption of UV spectroscopy across diverse industries. Technological advancements, such as the development of more sensitive detectors and advanced software capabilities, significantly contribute to market expansion. The demand for UV spectroscopy is fueled by its versatility in various applications, including pharmaceutical and biotechnology research, environmental monitoring, and industrial quality control. Consumer preferences gravitate towards user-friendly instruments with sophisticated data analysis features. Competitive dynamics are shaped by technological innovation, pricing strategies, and the ability to provide comprehensive solutions, rather than just individual instruments. The market is estimated to exhibit a CAGR of xx% during the forecast period (2025-2033), with a market penetration rate expected to reach xx% by 2033.
Dominant Markets & Segments in Global UV Spectroscopy Market
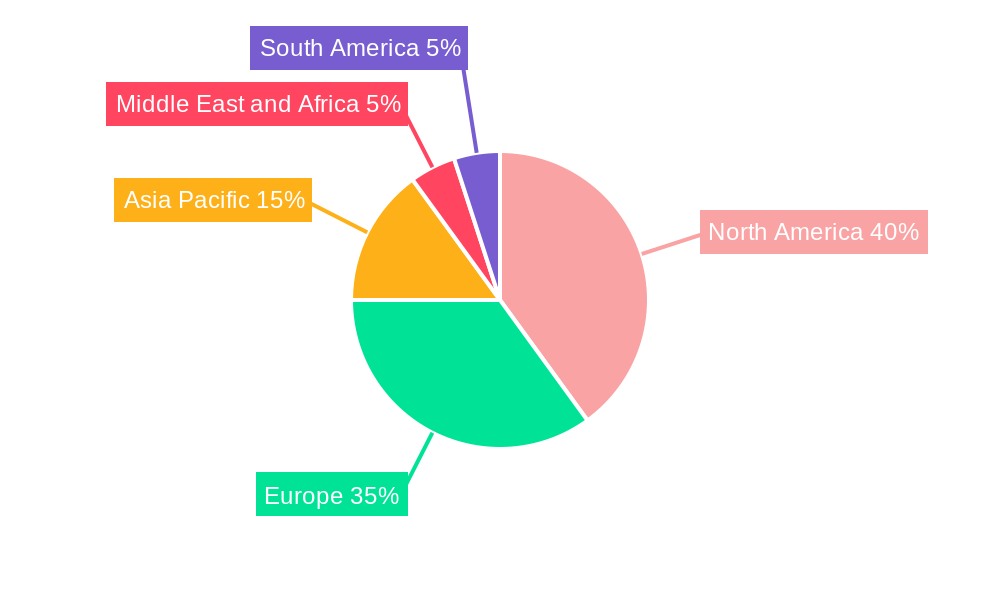
The North American region currently holds the largest market share in UV spectroscopy, primarily due to the strong presence of research institutions, pharmaceutical companies, and robust regulatory frameworks. Within the instrument segment, dual-beam systems dominate, while the pharmaceutical and biotechnology industries are the largest end-users.
- Leading Region: North America
- Dominant Instrument Segment: Dual-Beam Systems
- Largest End-User Segment: Pharmaceutical and Biotechnology Industries
Key Drivers for North American Dominance:
- Strong presence of research institutions and pharmaceutical companies.
- Well-established regulatory frameworks supporting research and development.
- High investment in advanced analytical instruments.
Detailed Dominance Analysis: The high concentration of pharmaceutical and biotech companies in North America, coupled with significant investment in R&D and a strong regulatory landscape encouraging advanced technology adoption, drives the market's dominance in this region. The preference for dual-beam systems reflects the need for higher accuracy and precision in various applications, while the pharmaceutical and biotechnology sector's reliance on UV spectroscopy for quality control and research further amplifies its significant market share.
Global UV Spectroscopy Market Product Innovations
Recent product innovations in the UV spectroscopy market highlight a clear trend towards enhanced sensitivity, improved automation, and more user-friendly software. For instance, the introduction of the CRAIC 2030 PV PRO microspectrophotometer in January 2022 showcases advancements in analyzing microscopic samples. Agilent's Cary 3500 UV-Vis spectrophotometer's integration with the Agilent OpenLab software suite in December 2021 emphasizes the growing importance of data management and regulatory compliance. These innovations deliver enhanced analytical capabilities and streamlined workflows, catering to the evolving needs of researchers and industry professionals.
Report Segmentation & Scope
This report segments the global UV spectroscopy market by instrument type (Single-Beam, Dual-Beam, Array-Based Systems), application (Academic, Industrial, Environmental Studies), and end-user (Pharmaceutical and Biotechnology Industries, Academic and Research Institutions). Each segment is analyzed individually to understand its growth trajectory, market size, and competitive landscape. Projections for each segment are provided for the forecast period, highlighting expected growth rates and market dynamics. Competitive analysis within each segment explores key players, their market share, and strategic moves.
Key Drivers of Global UV Spectroscopy Market Growth
The growth of the UV spectroscopy market is propelled by several key factors. Technological advancements lead to increased sensitivity, accuracy, and ease of use. The rising demand for quality control and research across various sectors, particularly in pharmaceuticals and environmental studies, fuels market expansion. Stringent regulatory frameworks mandating quality testing and environmental monitoring also contribute significantly.
Challenges in the Global UV Spectroscopy Market Sector
Despite promising growth prospects, the UV spectroscopy market faces certain challenges. High initial investment costs can be a barrier for smaller laboratories. The complexity of instruments and data analysis can present a hurdle for some users. Competition from alternative analytical techniques, such as Raman spectroscopy, could also impact market growth. Supply chain disruptions and increasing component costs pose ongoing difficulties.
Leading Players in the Global UV Spectroscopy Market Market
- GBC Scientific Equipment
- Eppendorf
- Buck Scientific Instrument Manufacturing Company
- PerkinElmer Inc.
- Cecil Instrumentation Services Ltd
- Utech Labs
- Danher
- ThermoFisher Scientific
- Biochrom Ltd
- Cole-Parmer Instrument Company LLC
- Shimadzu Corporation
- Analytik Jena GmbH
Key Developments in Global UV Spectroscopy Market Sector
- January 2022: CRAIC Technologies introduced the 2030 PV PRO UV-visible-NIR microspectrophotometer, enhancing microscopic sample analysis capabilities.
- December 2021: Agilent Technologies Inc. announced Cary 3500 UV-Vis spectrophotometer compatibility with Agilent OpenLab software, improving data management and regulatory compliance.
Strategic Global UV Spectroscopy Market Market Outlook
The future of the global UV spectroscopy market appears bright, with continued growth driven by technological advancements, expanding applications, and increasing regulatory demands. Strategic opportunities lie in developing innovative solutions, focusing on user-friendly interfaces, and expanding into emerging markets. The integration of artificial intelligence and machine learning in data analysis holds significant potential for further market expansion and improved efficiency.
Global UV Spectroscopy Market Segmentation
-
1. Instrument
- 1.1. Single-Beam
- 1.2. Dual Beam
- 1.3. Array- Based Systems
-
2. Application
- 2.1. Academic
- 2.2. Industrial
- 2.3. Environmental studies
-
3. End Users
- 3.1. Pharmaceutical and Biotechnology Industries
- 3.2. Academic and Research Institutions
Global UV Spectroscopy Market Segmentation By Geography
-
1. North America
- 1.1. United States
- 1.2. Canada
- 1.3. Mexico
-
2. Europe
- 2.1. Germany
- 2.2. United Kingdom
- 2.3. France
- 2.4. Italy
- 2.5. Spain
- 2.6. Rest of Europe
-
3. Asia Pacific
- 3.1. China
- 3.2. Japan
- 3.3. India
- 3.4. Australia
- 3.5. South Korea
- 3.6. Rest of Asia Pacific
-
4. Middle East and Africa
- 4.1. GCC
- 4.2. South Africa
- 4.3. Rest of Middle East and Africa
-
5. South America
- 5.1. Brazil
- 5.2. Argentina
- 5.3. Rest of South America
Global UV Spectroscopy Market REPORT HIGHLIGHTS
| Aspects | Details |
|---|---|
| Study Period | 2019-2033 |
| Base Year | 2024 |
| Estimated Year | 2025 |
| Forecast Period | 2025-2033 |
| Historical Period | 2019-2024 |
| Growth Rate | CAGR of 5.00% from 2019-2033 |
| Segmentation |
|
Table of Contents
- 1. Introduction
- 1.1. Research Scope
- 1.2. Market Segmentation
- 1.3. Research Methodology
- 1.4. Definitions and Assumptions
- 2. Executive Summary
- 2.1. Introduction
- 3. Market Dynamics
- 3.1. Introduction
- 3.2. Market Drivers
- 3.2.1. Rising application of Ultraviolet-spectroscophy in pharamecutical and biotechnology industries.; Technological advancements
- 3.3. Market Restrains
- 3.3.1. Lack of experienced professional; Longevity of Instruments
- 3.4. Market Trends
- 3.4.1. The Pharmaceutical and Biotechnology industry Segment is Expected to Hold a Major Market Share in the UV spectroscopy Market
- 4. Market Factor Analysis
- 4.1. Porters Five Forces
- 4.2. Supply/Value Chain
- 4.3. PESTEL analysis
- 4.4. Market Entropy
- 4.5. Patent/Trademark Analysis
- 5. Global UV Spectroscopy Market Analysis, Insights and Forecast, 2019-2031
- 5.1. Market Analysis, Insights and Forecast - by Instrument
- 5.1.1. Single-Beam
- 5.1.2. Dual Beam
- 5.1.3. Array- Based Systems
- 5.2. Market Analysis, Insights and Forecast - by Application
- 5.2.1. Academic
- 5.2.2. Industrial
- 5.2.3. Environmental studies
- 5.3. Market Analysis, Insights and Forecast - by End Users
- 5.3.1. Pharmaceutical and Biotechnology Industries
- 5.3.2. Academic and Research Institutions
- 5.4. Market Analysis, Insights and Forecast - by Region
- 5.4.1. North America
- 5.4.2. Europe
- 5.4.3. Asia Pacific
- 5.4.4. Middle East and Africa
- 5.4.5. South America
- 5.1. Market Analysis, Insights and Forecast - by Instrument
- 6. North America Global UV Spectroscopy Market Analysis, Insights and Forecast, 2019-2031
- 6.1. Market Analysis, Insights and Forecast - by Instrument
- 6.1.1. Single-Beam
- 6.1.2. Dual Beam
- 6.1.3. Array- Based Systems
- 6.2. Market Analysis, Insights and Forecast - by Application
- 6.2.1. Academic
- 6.2.2. Industrial
- 6.2.3. Environmental studies
- 6.3. Market Analysis, Insights and Forecast - by End Users
- 6.3.1. Pharmaceutical and Biotechnology Industries
- 6.3.2. Academic and Research Institutions
- 6.1. Market Analysis, Insights and Forecast - by Instrument
- 7. Europe Global UV Spectroscopy Market Analysis, Insights and Forecast, 2019-2031
- 7.1. Market Analysis, Insights and Forecast - by Instrument
- 7.1.1. Single-Beam
- 7.1.2. Dual Beam
- 7.1.3. Array- Based Systems
- 7.2. Market Analysis, Insights and Forecast - by Application
- 7.2.1. Academic
- 7.2.2. Industrial
- 7.2.3. Environmental studies
- 7.3. Market Analysis, Insights and Forecast - by End Users
- 7.3.1. Pharmaceutical and Biotechnology Industries
- 7.3.2. Academic and Research Institutions
- 7.1. Market Analysis, Insights and Forecast - by Instrument
- 8. Asia Pacific Global UV Spectroscopy Market Analysis, Insights and Forecast, 2019-2031
- 8.1. Market Analysis, Insights and Forecast - by Instrument
- 8.1.1. Single-Beam
- 8.1.2. Dual Beam
- 8.1.3. Array- Based Systems
- 8.2. Market Analysis, Insights and Forecast - by Application
- 8.2.1. Academic
- 8.2.2. Industrial
- 8.2.3. Environmental studies
- 8.3. Market Analysis, Insights and Forecast - by End Users
- 8.3.1. Pharmaceutical and Biotechnology Industries
- 8.3.2. Academic and Research Institutions
- 8.1. Market Analysis, Insights and Forecast - by Instrument
- 9. Middle East and Africa Global UV Spectroscopy Market Analysis, Insights and Forecast, 2019-2031
- 9.1. Market Analysis, Insights and Forecast - by Instrument
- 9.1.1. Single-Beam
- 9.1.2. Dual Beam
- 9.1.3. Array- Based Systems
- 9.2. Market Analysis, Insights and Forecast - by Application
- 9.2.1. Academic
- 9.2.2. Industrial
- 9.2.3. Environmental studies
- 9.3. Market Analysis, Insights and Forecast - by End Users
- 9.3.1. Pharmaceutical and Biotechnology Industries
- 9.3.2. Academic and Research Institutions
- 9.1. Market Analysis, Insights and Forecast - by Instrument
- 10. South America Global UV Spectroscopy Market Analysis, Insights and Forecast, 2019-2031
- 10.1. Market Analysis, Insights and Forecast - by Instrument
- 10.1.1. Single-Beam
- 10.1.2. Dual Beam
- 10.1.3. Array- Based Systems
- 10.2. Market Analysis, Insights and Forecast - by Application
- 10.2.1. Academic
- 10.2.2. Industrial
- 10.2.3. Environmental studies
- 10.3. Market Analysis, Insights and Forecast - by End Users
- 10.3.1. Pharmaceutical and Biotechnology Industries
- 10.3.2. Academic and Research Institutions
- 10.1. Market Analysis, Insights and Forecast - by Instrument
- 11. North America Global UV Spectroscopy Market Analysis, Insights and Forecast, 2019-2031
- 11.1. Market Analysis, Insights and Forecast - By Country/Sub-region
- 11.1.1 United States
- 11.1.2 Canada
- 11.1.3 Mexico
- 12. Europe Global UV Spectroscopy Market Analysis, Insights and Forecast, 2019-2031
- 12.1. Market Analysis, Insights and Forecast - By Country/Sub-region
- 12.1.1 Germany
- 12.1.2 United Kingdom
- 12.1.3 France
- 12.1.4 Italy
- 12.1.5 Spain
- 12.1.6 Rest of Europe
- 13. Asia Pacific Global UV Spectroscopy Market Analysis, Insights and Forecast, 2019-2031
- 13.1. Market Analysis, Insights and Forecast - By Country/Sub-region
- 13.1.1 China
- 13.1.2 Japan
- 13.1.3 India
- 13.1.4 Australia
- 13.1.5 South Korea
- 13.1.6 Rest of Asia Pacific
- 14. Middle East and Africa Global UV Spectroscopy Market Analysis, Insights and Forecast, 2019-2031
- 14.1. Market Analysis, Insights and Forecast - By Country/Sub-region
- 14.1.1 GCC
- 14.1.2 South Africa
- 14.1.3 Rest of Middle East and Africa
- 15. South America Global UV Spectroscopy Market Analysis, Insights and Forecast, 2019-2031
- 15.1. Market Analysis, Insights and Forecast - By Country/Sub-region
- 15.1.1 Brazil
- 15.1.2 Argentina
- 15.1.3 Rest of South America
- 16. Competitive Analysis
- 16.1. Market Share Analysis 2024
- 16.2. Company Profiles
- 16.2.1 GBC Scientific equipment
- 16.2.1.1. Overview
- 16.2.1.2. Products
- 16.2.1.3. SWOT Analysis
- 16.2.1.4. Recent Developments
- 16.2.1.5. Financials (Based on Availability)
- 16.2.2 Eppendorf
- 16.2.2.1. Overview
- 16.2.2.2. Products
- 16.2.2.3. SWOT Analysis
- 16.2.2.4. Recent Developments
- 16.2.2.5. Financials (Based on Availability)
- 16.2.3 Buck scientific Instrusment manufacturing company
- 16.2.3.1. Overview
- 16.2.3.2. Products
- 16.2.3.3. SWOT Analysis
- 16.2.3.4. Recent Developments
- 16.2.3.5. Financials (Based on Availability)
- 16.2.4 Perkin Elmier Inc
- 16.2.4.1. Overview
- 16.2.4.2. Products
- 16.2.4.3. SWOT Analysis
- 16.2.4.4. Recent Developments
- 16.2.4.5. Financials (Based on Availability)
- 16.2.5 Cecil Instrumentation services Ltd
- 16.2.5.1. Overview
- 16.2.5.2. Products
- 16.2.5.3. SWOT Analysis
- 16.2.5.4. Recent Developments
- 16.2.5.5. Financials (Based on Availability)
- 16.2.6 Utech Labs
- 16.2.6.1. Overview
- 16.2.6.2. Products
- 16.2.6.3. SWOT Analysis
- 16.2.6.4. Recent Developments
- 16.2.6.5. Financials (Based on Availability)
- 16.2.7 Danher
- 16.2.7.1. Overview
- 16.2.7.2. Products
- 16.2.7.3. SWOT Analysis
- 16.2.7.4. Recent Developments
- 16.2.7.5. Financials (Based on Availability)
- 16.2.8 ThermoFisher Scientific
- 16.2.8.1. Overview
- 16.2.8.2. Products
- 16.2.8.3. SWOT Analysis
- 16.2.8.4. Recent Developments
- 16.2.8.5. Financials (Based on Availability)
- 16.2.9 Biochrom Ltd
- 16.2.9.1. Overview
- 16.2.9.2. Products
- 16.2.9.3. SWOT Analysis
- 16.2.9.4. Recent Developments
- 16.2.9.5. Financials (Based on Availability)
- 16.2.10 Cole- Parmer instrument company LLC
- 16.2.10.1. Overview
- 16.2.10.2. Products
- 16.2.10.3. SWOT Analysis
- 16.2.10.4. Recent Developments
- 16.2.10.5. Financials (Based on Availability)
- 16.2.11 Shimadzu Corporation
- 16.2.11.1. Overview
- 16.2.11.2. Products
- 16.2.11.3. SWOT Analysis
- 16.2.11.4. Recent Developments
- 16.2.11.5. Financials (Based on Availability)
- 16.2.12 Analaytik Jena GmbH
- 16.2.12.1. Overview
- 16.2.12.2. Products
- 16.2.12.3. SWOT Analysis
- 16.2.12.4. Recent Developments
- 16.2.12.5. Financials (Based on Availability)
- 16.2.1 GBC Scientific equipment
List of Figures
- Figure 1: Global Global UV Spectroscopy Market Revenue Breakdown (Million, %) by Region 2024 & 2032
- Figure 2: Global Global UV Spectroscopy Market Volume Breakdown (K Unit, %) by Region 2024 & 2032
- Figure 3: North America Global UV Spectroscopy Market Revenue (Million), by Country 2024 & 2032
- Figure 4: North America Global UV Spectroscopy Market Volume (K Unit), by Country 2024 & 2032
- Figure 5: North America Global UV Spectroscopy Market Revenue Share (%), by Country 2024 & 2032
- Figure 6: North America Global UV Spectroscopy Market Volume Share (%), by Country 2024 & 2032
- Figure 7: Europe Global UV Spectroscopy Market Revenue (Million), by Country 2024 & 2032
- Figure 8: Europe Global UV Spectroscopy Market Volume (K Unit), by Country 2024 & 2032
- Figure 9: Europe Global UV Spectroscopy Market Revenue Share (%), by Country 2024 & 2032
- Figure 10: Europe Global UV Spectroscopy Market Volume Share (%), by Country 2024 & 2032
- Figure 11: Asia Pacific Global UV Spectroscopy Market Revenue (Million), by Country 2024 & 2032
- Figure 12: Asia Pacific Global UV Spectroscopy Market Volume (K Unit), by Country 2024 & 2032
- Figure 13: Asia Pacific Global UV Spectroscopy Market Revenue Share (%), by Country 2024 & 2032
- Figure 14: Asia Pacific Global UV Spectroscopy Market Volume Share (%), by Country 2024 & 2032
- Figure 15: Middle East and Africa Global UV Spectroscopy Market Revenue (Million), by Country 2024 & 2032
- Figure 16: Middle East and Africa Global UV Spectroscopy Market Volume (K Unit), by Country 2024 & 2032
- Figure 17: Middle East and Africa Global UV Spectroscopy Market Revenue Share (%), by Country 2024 & 2032
- Figure 18: Middle East and Africa Global UV Spectroscopy Market Volume Share (%), by Country 2024 & 2032
- Figure 19: South America Global UV Spectroscopy Market Revenue (Million), by Country 2024 & 2032
- Figure 20: South America Global UV Spectroscopy Market Volume (K Unit), by Country 2024 & 2032
- Figure 21: South America Global UV Spectroscopy Market Revenue Share (%), by Country 2024 & 2032
- Figure 22: South America Global UV Spectroscopy Market Volume Share (%), by Country 2024 & 2032
- Figure 23: North America Global UV Spectroscopy Market Revenue (Million), by Instrument 2024 & 2032
- Figure 24: North America Global UV Spectroscopy Market Volume (K Unit), by Instrument 2024 & 2032
- Figure 25: North America Global UV Spectroscopy Market Revenue Share (%), by Instrument 2024 & 2032
- Figure 26: North America Global UV Spectroscopy Market Volume Share (%), by Instrument 2024 & 2032
- Figure 27: North America Global UV Spectroscopy Market Revenue (Million), by Application 2024 & 2032
- Figure 28: North America Global UV Spectroscopy Market Volume (K Unit), by Application 2024 & 2032
- Figure 29: North America Global UV Spectroscopy Market Revenue Share (%), by Application 2024 & 2032
- Figure 30: North America Global UV Spectroscopy Market Volume Share (%), by Application 2024 & 2032
- Figure 31: North America Global UV Spectroscopy Market Revenue (Million), by End Users 2024 & 2032
- Figure 32: North America Global UV Spectroscopy Market Volume (K Unit), by End Users 2024 & 2032
- Figure 33: North America Global UV Spectroscopy Market Revenue Share (%), by End Users 2024 & 2032
- Figure 34: North America Global UV Spectroscopy Market Volume Share (%), by End Users 2024 & 2032
- Figure 35: North America Global UV Spectroscopy Market Revenue (Million), by Country 2024 & 2032
- Figure 36: North America Global UV Spectroscopy Market Volume (K Unit), by Country 2024 & 2032
- Figure 37: North America Global UV Spectroscopy Market Revenue Share (%), by Country 2024 & 2032
- Figure 38: North America Global UV Spectroscopy Market Volume Share (%), by Country 2024 & 2032
- Figure 39: Europe Global UV Spectroscopy Market Revenue (Million), by Instrument 2024 & 2032
- Figure 40: Europe Global UV Spectroscopy Market Volume (K Unit), by Instrument 2024 & 2032
- Figure 41: Europe Global UV Spectroscopy Market Revenue Share (%), by Instrument 2024 & 2032
- Figure 42: Europe Global UV Spectroscopy Market Volume Share (%), by Instrument 2024 & 2032
- Figure 43: Europe Global UV Spectroscopy Market Revenue (Million), by Application 2024 & 2032
- Figure 44: Europe Global UV Spectroscopy Market Volume (K Unit), by Application 2024 & 2032
- Figure 45: Europe Global UV Spectroscopy Market Revenue Share (%), by Application 2024 & 2032
- Figure 46: Europe Global UV Spectroscopy Market Volume Share (%), by Application 2024 & 2032
- Figure 47: Europe Global UV Spectroscopy Market Revenue (Million), by End Users 2024 & 2032
- Figure 48: Europe Global UV Spectroscopy Market Volume (K Unit), by End Users 2024 & 2032
- Figure 49: Europe Global UV Spectroscopy Market Revenue Share (%), by End Users 2024 & 2032
- Figure 50: Europe Global UV Spectroscopy Market Volume Share (%), by End Users 2024 & 2032
- Figure 51: Europe Global UV Spectroscopy Market Revenue (Million), by Country 2024 & 2032
- Figure 52: Europe Global UV Spectroscopy Market Volume (K Unit), by Country 2024 & 2032
- Figure 53: Europe Global UV Spectroscopy Market Revenue Share (%), by Country 2024 & 2032
- Figure 54: Europe Global UV Spectroscopy Market Volume Share (%), by Country 2024 & 2032
- Figure 55: Asia Pacific Global UV Spectroscopy Market Revenue (Million), by Instrument 2024 & 2032
- Figure 56: Asia Pacific Global UV Spectroscopy Market Volume (K Unit), by Instrument 2024 & 2032
- Figure 57: Asia Pacific Global UV Spectroscopy Market Revenue Share (%), by Instrument 2024 & 2032
- Figure 58: Asia Pacific Global UV Spectroscopy Market Volume Share (%), by Instrument 2024 & 2032
- Figure 59: Asia Pacific Global UV Spectroscopy Market Revenue (Million), by Application 2024 & 2032
- Figure 60: Asia Pacific Global UV Spectroscopy Market Volume (K Unit), by Application 2024 & 2032
- Figure 61: Asia Pacific Global UV Spectroscopy Market Revenue Share (%), by Application 2024 & 2032
- Figure 62: Asia Pacific Global UV Spectroscopy Market Volume Share (%), by Application 2024 & 2032
- Figure 63: Asia Pacific Global UV Spectroscopy Market Revenue (Million), by End Users 2024 & 2032
- Figure 64: Asia Pacific Global UV Spectroscopy Market Volume (K Unit), by End Users 2024 & 2032
- Figure 65: Asia Pacific Global UV Spectroscopy Market Revenue Share (%), by End Users 2024 & 2032
- Figure 66: Asia Pacific Global UV Spectroscopy Market Volume Share (%), by End Users 2024 & 2032
- Figure 67: Asia Pacific Global UV Spectroscopy Market Revenue (Million), by Country 2024 & 2032
- Figure 68: Asia Pacific Global UV Spectroscopy Market Volume (K Unit), by Country 2024 & 2032
- Figure 69: Asia Pacific Global UV Spectroscopy Market Revenue Share (%), by Country 2024 & 2032
- Figure 70: Asia Pacific Global UV Spectroscopy Market Volume Share (%), by Country 2024 & 2032
- Figure 71: Middle East and Africa Global UV Spectroscopy Market Revenue (Million), by Instrument 2024 & 2032
- Figure 72: Middle East and Africa Global UV Spectroscopy Market Volume (K Unit), by Instrument 2024 & 2032
- Figure 73: Middle East and Africa Global UV Spectroscopy Market Revenue Share (%), by Instrument 2024 & 2032
- Figure 74: Middle East and Africa Global UV Spectroscopy Market Volume Share (%), by Instrument 2024 & 2032
- Figure 75: Middle East and Africa Global UV Spectroscopy Market Revenue (Million), by Application 2024 & 2032
- Figure 76: Middle East and Africa Global UV Spectroscopy Market Volume (K Unit), by Application 2024 & 2032
- Figure 77: Middle East and Africa Global UV Spectroscopy Market Revenue Share (%), by Application 2024 & 2032
- Figure 78: Middle East and Africa Global UV Spectroscopy Market Volume Share (%), by Application 2024 & 2032
- Figure 79: Middle East and Africa Global UV Spectroscopy Market Revenue (Million), by End Users 2024 & 2032
- Figure 80: Middle East and Africa Global UV Spectroscopy Market Volume (K Unit), by End Users 2024 & 2032
- Figure 81: Middle East and Africa Global UV Spectroscopy Market Revenue Share (%), by End Users 2024 & 2032
- Figure 82: Middle East and Africa Global UV Spectroscopy Market Volume Share (%), by End Users 2024 & 2032
- Figure 83: Middle East and Africa Global UV Spectroscopy Market Revenue (Million), by Country 2024 & 2032
- Figure 84: Middle East and Africa Global UV Spectroscopy Market Volume (K Unit), by Country 2024 & 2032
- Figure 85: Middle East and Africa Global UV Spectroscopy Market Revenue Share (%), by Country 2024 & 2032
- Figure 86: Middle East and Africa Global UV Spectroscopy Market Volume Share (%), by Country 2024 & 2032
- Figure 87: South America Global UV Spectroscopy Market Revenue (Million), by Instrument 2024 & 2032
- Figure 88: South America Global UV Spectroscopy Market Volume (K Unit), by Instrument 2024 & 2032
- Figure 89: South America Global UV Spectroscopy Market Revenue Share (%), by Instrument 2024 & 2032
- Figure 90: South America Global UV Spectroscopy Market Volume Share (%), by Instrument 2024 & 2032
- Figure 91: South America Global UV Spectroscopy Market Revenue (Million), by Application 2024 & 2032
- Figure 92: South America Global UV Spectroscopy Market Volume (K Unit), by Application 2024 & 2032
- Figure 93: South America Global UV Spectroscopy Market Revenue Share (%), by Application 2024 & 2032
- Figure 94: South America Global UV Spectroscopy Market Volume Share (%), by Application 2024 & 2032
- Figure 95: South America Global UV Spectroscopy Market Revenue (Million), by End Users 2024 & 2032
- Figure 96: South America Global UV Spectroscopy Market Volume (K Unit), by End Users 2024 & 2032
- Figure 97: South America Global UV Spectroscopy Market Revenue Share (%), by End Users 2024 & 2032
- Figure 98: South America Global UV Spectroscopy Market Volume Share (%), by End Users 2024 & 2032
- Figure 99: South America Global UV Spectroscopy Market Revenue (Million), by Country 2024 & 2032
- Figure 100: South America Global UV Spectroscopy Market Volume (K Unit), by Country 2024 & 2032
- Figure 101: South America Global UV Spectroscopy Market Revenue Share (%), by Country 2024 & 2032
- Figure 102: South America Global UV Spectroscopy Market Volume Share (%), by Country 2024 & 2032
List of Tables
- Table 1: Global UV Spectroscopy Market Revenue Million Forecast, by Region 2019 & 2032
- Table 2: Global UV Spectroscopy Market Volume K Unit Forecast, by Region 2019 & 2032
- Table 3: Global UV Spectroscopy Market Revenue Million Forecast, by Instrument 2019 & 2032
- Table 4: Global UV Spectroscopy Market Volume K Unit Forecast, by Instrument 2019 & 2032
- Table 5: Global UV Spectroscopy Market Revenue Million Forecast, by Application 2019 & 2032
- Table 6: Global UV Spectroscopy Market Volume K Unit Forecast, by Application 2019 & 2032
- Table 7: Global UV Spectroscopy Market Revenue Million Forecast, by End Users 2019 & 2032
- Table 8: Global UV Spectroscopy Market Volume K Unit Forecast, by End Users 2019 & 2032
- Table 9: Global UV Spectroscopy Market Revenue Million Forecast, by Region 2019 & 2032
- Table 10: Global UV Spectroscopy Market Volume K Unit Forecast, by Region 2019 & 2032
- Table 11: Global UV Spectroscopy Market Revenue Million Forecast, by Country 2019 & 2032
- Table 12: Global UV Spectroscopy Market Volume K Unit Forecast, by Country 2019 & 2032
- Table 13: United States Global UV Spectroscopy Market Revenue (Million) Forecast, by Application 2019 & 2032
- Table 14: United States Global UV Spectroscopy Market Volume (K Unit) Forecast, by Application 2019 & 2032
- Table 15: Canada Global UV Spectroscopy Market Revenue (Million) Forecast, by Application 2019 & 2032
- Table 16: Canada Global UV Spectroscopy Market Volume (K Unit) Forecast, by Application 2019 & 2032
- Table 17: Mexico Global UV Spectroscopy Market Revenue (Million) Forecast, by Application 2019 & 2032
- Table 18: Mexico Global UV Spectroscopy Market Volume (K Unit) Forecast, by Application 2019 & 2032
- Table 19: Global UV Spectroscopy Market Revenue Million Forecast, by Country 2019 & 2032
- Table 20: Global UV Spectroscopy Market Volume K Unit Forecast, by Country 2019 & 2032
- Table 21: Germany Global UV Spectroscopy Market Revenue (Million) Forecast, by Application 2019 & 2032
- Table 22: Germany Global UV Spectroscopy Market Volume (K Unit) Forecast, by Application 2019 & 2032
- Table 23: United Kingdom Global UV Spectroscopy Market Revenue (Million) Forecast, by Application 2019 & 2032
- Table 24: United Kingdom Global UV Spectroscopy Market Volume (K Unit) Forecast, by Application 2019 & 2032
- Table 25: France Global UV Spectroscopy Market Revenue (Million) Forecast, by Application 2019 & 2032
- Table 26: France Global UV Spectroscopy Market Volume (K Unit) Forecast, by Application 2019 & 2032
- Table 27: Italy Global UV Spectroscopy Market Revenue (Million) Forecast, by Application 2019 & 2032
- Table 28: Italy Global UV Spectroscopy Market Volume (K Unit) Forecast, by Application 2019 & 2032
- Table 29: Spain Global UV Spectroscopy Market Revenue (Million) Forecast, by Application 2019 & 2032
- Table 30: Spain Global UV Spectroscopy Market Volume (K Unit) Forecast, by Application 2019 & 2032
- Table 31: Rest of Europe Global UV Spectroscopy Market Revenue (Million) Forecast, by Application 2019 & 2032
- Table 32: Rest of Europe Global UV Spectroscopy Market Volume (K Unit) Forecast, by Application 2019 & 2032
- Table 33: Global UV Spectroscopy Market Revenue Million Forecast, by Country 2019 & 2032
- Table 34: Global UV Spectroscopy Market Volume K Unit Forecast, by Country 2019 & 2032
- Table 35: China Global UV Spectroscopy Market Revenue (Million) Forecast, by Application 2019 & 2032
- Table 36: China Global UV Spectroscopy Market Volume (K Unit) Forecast, by Application 2019 & 2032
- Table 37: Japan Global UV Spectroscopy Market Revenue (Million) Forecast, by Application 2019 & 2032
- Table 38: Japan Global UV Spectroscopy Market Volume (K Unit) Forecast, by Application 2019 & 2032
- Table 39: India Global UV Spectroscopy Market Revenue (Million) Forecast, by Application 2019 & 2032
- Table 40: India Global UV Spectroscopy Market Volume (K Unit) Forecast, by Application 2019 & 2032
- Table 41: Australia Global UV Spectroscopy Market Revenue (Million) Forecast, by Application 2019 & 2032
- Table 42: Australia Global UV Spectroscopy Market Volume (K Unit) Forecast, by Application 2019 & 2032
- Table 43: South Korea Global UV Spectroscopy Market Revenue (Million) Forecast, by Application 2019 & 2032
- Table 44: South Korea Global UV Spectroscopy Market Volume (K Unit) Forecast, by Application 2019 & 2032
- Table 45: Rest of Asia Pacific Global UV Spectroscopy Market Revenue (Million) Forecast, by Application 2019 & 2032
- Table 46: Rest of Asia Pacific Global UV Spectroscopy Market Volume (K Unit) Forecast, by Application 2019 & 2032
- Table 47: Global UV Spectroscopy Market Revenue Million Forecast, by Country 2019 & 2032
- Table 48: Global UV Spectroscopy Market Volume K Unit Forecast, by Country 2019 & 2032
- Table 49: GCC Global UV Spectroscopy Market Revenue (Million) Forecast, by Application 2019 & 2032
- Table 50: GCC Global UV Spectroscopy Market Volume (K Unit) Forecast, by Application 2019 & 2032
- Table 51: South Africa Global UV Spectroscopy Market Revenue (Million) Forecast, by Application 2019 & 2032
- Table 52: South Africa Global UV Spectroscopy Market Volume (K Unit) Forecast, by Application 2019 & 2032
- Table 53: Rest of Middle East and Africa Global UV Spectroscopy Market Revenue (Million) Forecast, by Application 2019 & 2032
- Table 54: Rest of Middle East and Africa Global UV Spectroscopy Market Volume (K Unit) Forecast, by Application 2019 & 2032
- Table 55: Global UV Spectroscopy Market Revenue Million Forecast, by Country 2019 & 2032
- Table 56: Global UV Spectroscopy Market Volume K Unit Forecast, by Country 2019 & 2032
- Table 57: Brazil Global UV Spectroscopy Market Revenue (Million) Forecast, by Application 2019 & 2032
- Table 58: Brazil Global UV Spectroscopy Market Volume (K Unit) Forecast, by Application 2019 & 2032
- Table 59: Argentina Global UV Spectroscopy Market Revenue (Million) Forecast, by Application 2019 & 2032
- Table 60: Argentina Global UV Spectroscopy Market Volume (K Unit) Forecast, by Application 2019 & 2032
- Table 61: Rest of South America Global UV Spectroscopy Market Revenue (Million) Forecast, by Application 2019 & 2032
- Table 62: Rest of South America Global UV Spectroscopy Market Volume (K Unit) Forecast, by Application 2019 & 2032
- Table 63: Global UV Spectroscopy Market Revenue Million Forecast, by Instrument 2019 & 2032
- Table 64: Global UV Spectroscopy Market Volume K Unit Forecast, by Instrument 2019 & 2032
- Table 65: Global UV Spectroscopy Market Revenue Million Forecast, by Application 2019 & 2032
- Table 66: Global UV Spectroscopy Market Volume K Unit Forecast, by Application 2019 & 2032
- Table 67: Global UV Spectroscopy Market Revenue Million Forecast, by End Users 2019 & 2032
- Table 68: Global UV Spectroscopy Market Volume K Unit Forecast, by End Users 2019 & 2032
- Table 69: Global UV Spectroscopy Market Revenue Million Forecast, by Country 2019 & 2032
- Table 70: Global UV Spectroscopy Market Volume K Unit Forecast, by Country 2019 & 2032
- Table 71: United States Global UV Spectroscopy Market Revenue (Million) Forecast, by Application 2019 & 2032
- Table 72: United States Global UV Spectroscopy Market Volume (K Unit) Forecast, by Application 2019 & 2032
- Table 73: Canada Global UV Spectroscopy Market Revenue (Million) Forecast, by Application 2019 & 2032
- Table 74: Canada Global UV Spectroscopy Market Volume (K Unit) Forecast, by Application 2019 & 2032
- Table 75: Mexico Global UV Spectroscopy Market Revenue (Million) Forecast, by Application 2019 & 2032
- Table 76: Mexico Global UV Spectroscopy Market Volume (K Unit) Forecast, by Application 2019 & 2032
- Table 77: Global UV Spectroscopy Market Revenue Million Forecast, by Instrument 2019 & 2032
- Table 78: Global UV Spectroscopy Market Volume K Unit Forecast, by Instrument 2019 & 2032
- Table 79: Global UV Spectroscopy Market Revenue Million Forecast, by Application 2019 & 2032
- Table 80: Global UV Spectroscopy Market Volume K Unit Forecast, by Application 2019 & 2032
- Table 81: Global UV Spectroscopy Market Revenue Million Forecast, by End Users 2019 & 2032
- Table 82: Global UV Spectroscopy Market Volume K Unit Forecast, by End Users 2019 & 2032
- Table 83: Global UV Spectroscopy Market Revenue Million Forecast, by Country 2019 & 2032
- Table 84: Global UV Spectroscopy Market Volume K Unit Forecast, by Country 2019 & 2032
- Table 85: Germany Global UV Spectroscopy Market Revenue (Million) Forecast, by Application 2019 & 2032
- Table 86: Germany Global UV Spectroscopy Market Volume (K Unit) Forecast, by Application 2019 & 2032
- Table 87: United Kingdom Global UV Spectroscopy Market Revenue (Million) Forecast, by Application 2019 & 2032
- Table 88: United Kingdom Global UV Spectroscopy Market Volume (K Unit) Forecast, by Application 2019 & 2032
- Table 89: France Global UV Spectroscopy Market Revenue (Million) Forecast, by Application 2019 & 2032
- Table 90: France Global UV Spectroscopy Market Volume (K Unit) Forecast, by Application 2019 & 2032
- Table 91: Italy Global UV Spectroscopy Market Revenue (Million) Forecast, by Application 2019 & 2032
- Table 92: Italy Global UV Spectroscopy Market Volume (K Unit) Forecast, by Application 2019 & 2032
- Table 93: Spain Global UV Spectroscopy Market Revenue (Million) Forecast, by Application 2019 & 2032
- Table 94: Spain Global UV Spectroscopy Market Volume (K Unit) Forecast, by Application 2019 & 2032
- Table 95: Rest of Europe Global UV Spectroscopy Market Revenue (Million) Forecast, by Application 2019 & 2032
- Table 96: Rest of Europe Global UV Spectroscopy Market Volume (K Unit) Forecast, by Application 2019 & 2032
- Table 97: Global UV Spectroscopy Market Revenue Million Forecast, by Instrument 2019 & 2032
- Table 98: Global UV Spectroscopy Market Volume K Unit Forecast, by Instrument 2019 & 2032
- Table 99: Global UV Spectroscopy Market Revenue Million Forecast, by Application 2019 & 2032
- Table 100: Global UV Spectroscopy Market Volume K Unit Forecast, by Application 2019 & 2032
- Table 101: Global UV Spectroscopy Market Revenue Million Forecast, by End Users 2019 & 2032
- Table 102: Global UV Spectroscopy Market Volume K Unit Forecast, by End Users 2019 & 2032
- Table 103: Global UV Spectroscopy Market Revenue Million Forecast, by Country 2019 & 2032
- Table 104: Global UV Spectroscopy Market Volume K Unit Forecast, by Country 2019 & 2032
- Table 105: China Global UV Spectroscopy Market Revenue (Million) Forecast, by Application 2019 & 2032
- Table 106: China Global UV Spectroscopy Market Volume (K Unit) Forecast, by Application 2019 & 2032
- Table 107: Japan Global UV Spectroscopy Market Revenue (Million) Forecast, by Application 2019 & 2032
- Table 108: Japan Global UV Spectroscopy Market Volume (K Unit) Forecast, by Application 2019 & 2032
- Table 109: India Global UV Spectroscopy Market Revenue (Million) Forecast, by Application 2019 & 2032
- Table 110: India Global UV Spectroscopy Market Volume (K Unit) Forecast, by Application 2019 & 2032
- Table 111: Australia Global UV Spectroscopy Market Revenue (Million) Forecast, by Application 2019 & 2032
- Table 112: Australia Global UV Spectroscopy Market Volume (K Unit) Forecast, by Application 2019 & 2032
- Table 113: South Korea Global UV Spectroscopy Market Revenue (Million) Forecast, by Application 2019 & 2032
- Table 114: South Korea Global UV Spectroscopy Market Volume (K Unit) Forecast, by Application 2019 & 2032
- Table 115: Rest of Asia Pacific Global UV Spectroscopy Market Revenue (Million) Forecast, by Application 2019 & 2032
- Table 116: Rest of Asia Pacific Global UV Spectroscopy Market Volume (K Unit) Forecast, by Application 2019 & 2032
- Table 117: Global UV Spectroscopy Market Revenue Million Forecast, by Instrument 2019 & 2032
- Table 118: Global UV Spectroscopy Market Volume K Unit Forecast, by Instrument 2019 & 2032
- Table 119: Global UV Spectroscopy Market Revenue Million Forecast, by Application 2019 & 2032
- Table 120: Global UV Spectroscopy Market Volume K Unit Forecast, by Application 2019 & 2032
- Table 121: Global UV Spectroscopy Market Revenue Million Forecast, by End Users 2019 & 2032
- Table 122: Global UV Spectroscopy Market Volume K Unit Forecast, by End Users 2019 & 2032
- Table 123: Global UV Spectroscopy Market Revenue Million Forecast, by Country 2019 & 2032
- Table 124: Global UV Spectroscopy Market Volume K Unit Forecast, by Country 2019 & 2032
- Table 125: GCC Global UV Spectroscopy Market Revenue (Million) Forecast, by Application 2019 & 2032
- Table 126: GCC Global UV Spectroscopy Market Volume (K Unit) Forecast, by Application 2019 & 2032
- Table 127: South Africa Global UV Spectroscopy Market Revenue (Million) Forecast, by Application 2019 & 2032
- Table 128: South Africa Global UV Spectroscopy Market Volume (K Unit) Forecast, by Application 2019 & 2032
- Table 129: Rest of Middle East and Africa Global UV Spectroscopy Market Revenue (Million) Forecast, by Application 2019 & 2032
- Table 130: Rest of Middle East and Africa Global UV Spectroscopy Market Volume (K Unit) Forecast, by Application 2019 & 2032
- Table 131: Global UV Spectroscopy Market Revenue Million Forecast, by Instrument 2019 & 2032
- Table 132: Global UV Spectroscopy Market Volume K Unit Forecast, by Instrument 2019 & 2032
- Table 133: Global UV Spectroscopy Market Revenue Million Forecast, by Application 2019 & 2032
- Table 134: Global UV Spectroscopy Market Volume K Unit Forecast, by Application 2019 & 2032
- Table 135: Global UV Spectroscopy Market Revenue Million Forecast, by End Users 2019 & 2032
- Table 136: Global UV Spectroscopy Market Volume K Unit Forecast, by End Users 2019 & 2032
- Table 137: Global UV Spectroscopy Market Revenue Million Forecast, by Country 2019 & 2032
- Table 138: Global UV Spectroscopy Market Volume K Unit Forecast, by Country 2019 & 2032
- Table 139: Brazil Global UV Spectroscopy Market Revenue (Million) Forecast, by Application 2019 & 2032
- Table 140: Brazil Global UV Spectroscopy Market Volume (K Unit) Forecast, by Application 2019 & 2032
- Table 141: Argentina Global UV Spectroscopy Market Revenue (Million) Forecast, by Application 2019 & 2032
- Table 142: Argentina Global UV Spectroscopy Market Volume (K Unit) Forecast, by Application 2019 & 2032
- Table 143: Rest of South America Global UV Spectroscopy Market Revenue (Million) Forecast, by Application 2019 & 2032
- Table 144: Rest of South America Global UV Spectroscopy Market Volume (K Unit) Forecast, by Application 2019 & 2032
Frequently Asked Questions
1. What is the projected Compound Annual Growth Rate (CAGR) of the Global UV Spectroscopy Market?
The projected CAGR is approximately 5.00%.
2. Which companies are prominent players in the Global UV Spectroscopy Market?
Key companies in the market include GBC Scientific equipment, Eppendorf, Buck scientific Instrusment manufacturing company, Perkin Elmier Inc, Cecil Instrumentation services Ltd, Utech Labs, Danher, ThermoFisher Scientific, Biochrom Ltd, Cole- Parmer instrument company LLC, Shimadzu Corporation, Analaytik Jena GmbH.
3. What are the main segments of the Global UV Spectroscopy Market?
The market segments include Instrument, Application, End Users.
4. Can you provide details about the market size?
The market size is estimated to be USD XX Million as of 2022.
5. What are some drivers contributing to market growth?
Rising application of Ultraviolet-spectroscophy in pharamecutical and biotechnology industries.; Technological advancements.
6. What are the notable trends driving market growth?
The Pharmaceutical and Biotechnology industry Segment is Expected to Hold a Major Market Share in the UV spectroscopy Market.
7. Are there any restraints impacting market growth?
Lack of experienced professional; Longevity of Instruments.
8. Can you provide examples of recent developments in the market?
In January 2022, CRAIC technologies introduced the 2030 PV PRO UV-visible- NIR microspectrophotometer. The latest microspectrophotometer is designed to non-destructively analyze many types of microscopic samples from the deep ultraviolet to near-infrared.
9. What pricing options are available for accessing the report?
Pricing options include single-user, multi-user, and enterprise licenses priced at USD 4750, USD 5250, and USD 8750 respectively.
10. Is the market size provided in terms of value or volume?
The market size is provided in terms of value, measured in Million and volume, measured in K Unit.
11. Are there any specific market keywords associated with the report?
Yes, the market keyword associated with the report is "Global UV Spectroscopy Market," which aids in identifying and referencing the specific market segment covered.
12. How do I determine which pricing option suits my needs best?
The pricing options vary based on user requirements and access needs. Individual users may opt for single-user licenses, while businesses requiring broader access may choose multi-user or enterprise licenses for cost-effective access to the report.
13. Are there any additional resources or data provided in the Global UV Spectroscopy Market report?
While the report offers comprehensive insights, it's advisable to review the specific contents or supplementary materials provided to ascertain if additional resources or data are available.
14. How can I stay updated on further developments or reports in the Global UV Spectroscopy Market?
To stay informed about further developments, trends, and reports in the Global UV Spectroscopy Market, consider subscribing to industry newsletters, following relevant companies and organizations, or regularly checking reputable industry news sources and publications.
Methodology
Step 1 - Identification of Relevant Samples Size from Population Database


Step 2 - Approaches for Defining Global Market Size (Value, Volume* & Price*)

Note*: In applicable scenarios
Step 3 - Data Sources
Primary Research
- Web Analytics
- Survey Reports
- Research Institute
- Latest Research Reports
- Opinion Leaders
Secondary Research
- Annual Reports
- White Paper
- Latest Press Release
- Industry Association
- Paid Database
- Investor Presentations

Step 4 - Data Triangulation
Involves using different sources of information in order to increase the validity of a study
These sources are likely to be stakeholders in a program - participants, other researchers, program staff, other community members, and so on.
Then we put all data in single framework & apply various statistical tools to find out the dynamic on the market.
During the analysis stage, feedback from the stakeholder groups would be compared to determine areas of agreement as well as areas of divergence


