
Key Insights
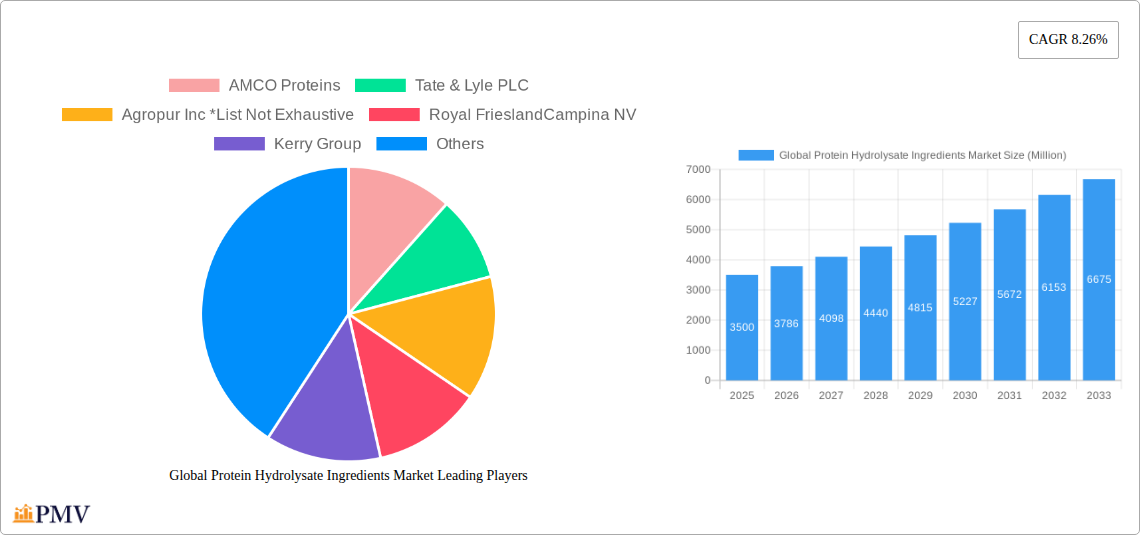
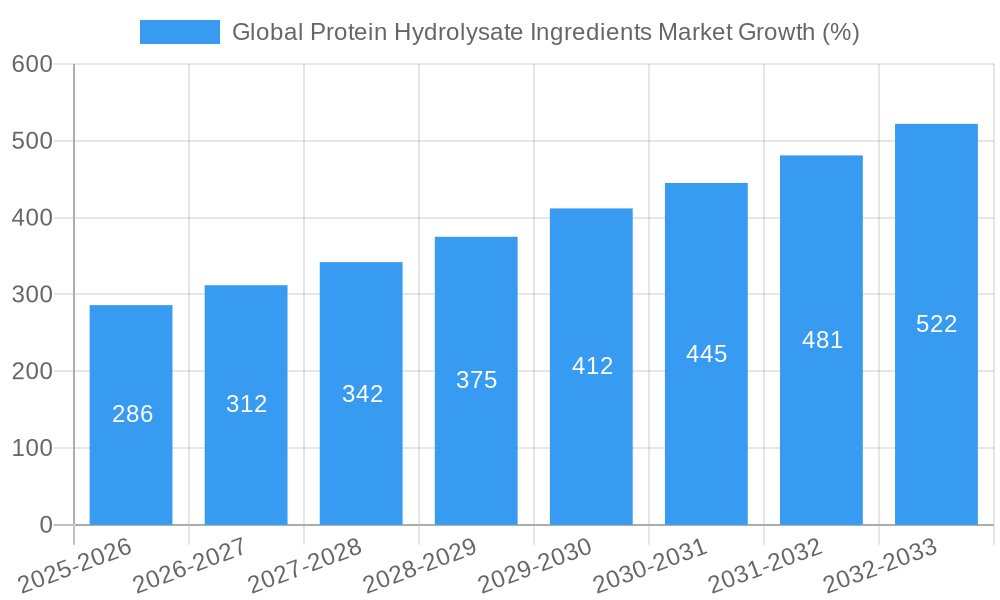
The global protein hydrolysate ingredients market, valued at approximately $3,500 million in 2025, is projected to experience robust growth, driven by a compound annual growth rate (CAGR) of 8.26% from 2025 to 2033. This expansion is fueled by several key factors. Increasing consumer demand for convenient, high-protein foods and beverages, particularly in the sports nutrition and infant nutrition sectors, is a major driver. The growing awareness of the health benefits associated with protein hydrolysates, including improved digestibility and enhanced bioavailability of amino acids, further contributes to market growth. Technological advancements in protein hydrolysis processes, leading to improved product quality and efficiency, also play a significant role. The market is segmented by type (milk protein hydrolysate, casein, plant protein hydrolysate, animal protein hydrolysate) and application (food and beverage, infant nutrition, sports nutrition, medical and clinical nutrition). Milk protein hydrolysates currently dominate the market due to their widespread use in various applications, but plant-based protein hydrolysates are witnessing significant growth, reflecting the increasing consumer preference for vegan and vegetarian options. Geographical expansion, particularly in emerging economies of Asia-Pacific and South America, also presents substantial growth opportunities.
However, certain restraints exist. Fluctuations in raw material prices, particularly milk and soy, can impact production costs and profitability. Stringent regulatory frameworks related to food safety and labeling in different regions also pose challenges for market players. Furthermore, consumer perceptions regarding the taste and texture of certain protein hydrolysates can influence market adoption. Despite these challenges, the long-term outlook for the global protein hydrolysate ingredients market remains positive, supported by consistent innovation, rising health consciousness, and the expanding demand for protein-rich products across various applications. Leading companies like AMCO Proteins, Tate & Lyle PLC, and Fonterra Co-operative Group Limited are well-positioned to capitalize on these trends through strategic product development and market expansion initiatives.
Global Protein Hydrolysate Ingredients Market Report: 2019-2033
This comprehensive report provides a detailed analysis of the global protein hydrolysate ingredients market, offering invaluable insights for stakeholders across the food and beverage, sports nutrition, and medical sectors. Spanning the period from 2019 to 2033 (Historical Period: 2019-2024, Base Year: 2025, Estimated Year: 2025, Forecast Period: 2025-2033), this report leverages rigorous research methodologies to offer a precise understanding of market dynamics and future projections. The market is expected to reach xx Million by 2033, exhibiting a CAGR of xx% during the forecast period.
Global Protein Hydrolysate Ingredients Market Market Structure & Competitive Dynamics
The global protein hydrolysate ingredients market exhibits a moderately concentrated structure, with several key players holding significant market share. The competitive landscape is characterized by intense innovation, particularly in plant-based protein hydrolysate development, driven by growing consumer demand for sustainable and ethically sourced ingredients. Regulatory frameworks, varying across regions, influence product approvals and market access. The market witnesses ongoing mergers and acquisitions (M&A) activity, reflecting the strategic importance of securing market share and expanding product portfolios. Significant M&A deals in recent years involved substantial investments, though precise deal values remain confidential for many transactions. For example, the 2021 acquisition of Proliant Health by AMCO Proteins significantly boosted AMCO's presence in the plant-based protein segment. Substitute products, such as isolated protein powders, pose competitive pressure; however, the functional properties of protein hydrolysates, including enhanced digestibility and bioavailability, provide a distinct competitive advantage. End-user trends increasingly favor natural, clean-label ingredients, influencing product development strategies.
- Market Concentration: Moderately concentrated, with top 5 players holding approximately xx% market share (2024 estimate).
- Innovation Ecosystem: High level of R&D investment in plant-based alternatives and enhanced functional properties.
- Regulatory Framework: Varying regulations across regions impact product approvals and market access.
- M&A Activity: Significant M&A activity, with deals exceeding xx Million in value observed in recent years. Examples include AMCO Proteins’ acquisition of Proliant Health in 2021.
- Product Substitutes: Isolated protein powders, whey concentrates, and other protein sources.
- End-User Trends: Growing demand for clean-label, sustainable, and ethically sourced ingredients.
Global Protein Hydrolysate Ingredients Market Industry Trends & Insights
The global protein hydrolysate ingredients market is experiencing robust growth, fueled by several key factors. The increasing prevalence of health-conscious consumers, particularly in developed nations, is driving demand for protein-rich foods and nutritional supplements. The rising popularity of sports nutrition and functional foods is a major growth driver, with protein hydrolysates playing a crucial role in enhancing product performance and nutritional value. Technological advancements, such as improved enzymatic hydrolysis techniques and membrane filtration processes, are enabling the production of higher-quality and more functional protein hydrolysates. Furthermore, the growing awareness of the benefits of protein hydrolysates in infant nutrition and medical applications is contributing to market expansion. However, fluctuating raw material prices and supply chain disruptions pose challenges to market growth. The market is also witnessing a shift towards plant-based protein hydrolysates, driven by increasing consumer preference for sustainable and ethical consumption patterns. This trend is expected to fuel innovation in this segment, further boosting market growth in the coming years. The global market is projected to reach xx Million by 2033, exhibiting significant growth.
Dominant Markets & Segments in Global Protein Hydrolysate Ingredients Market
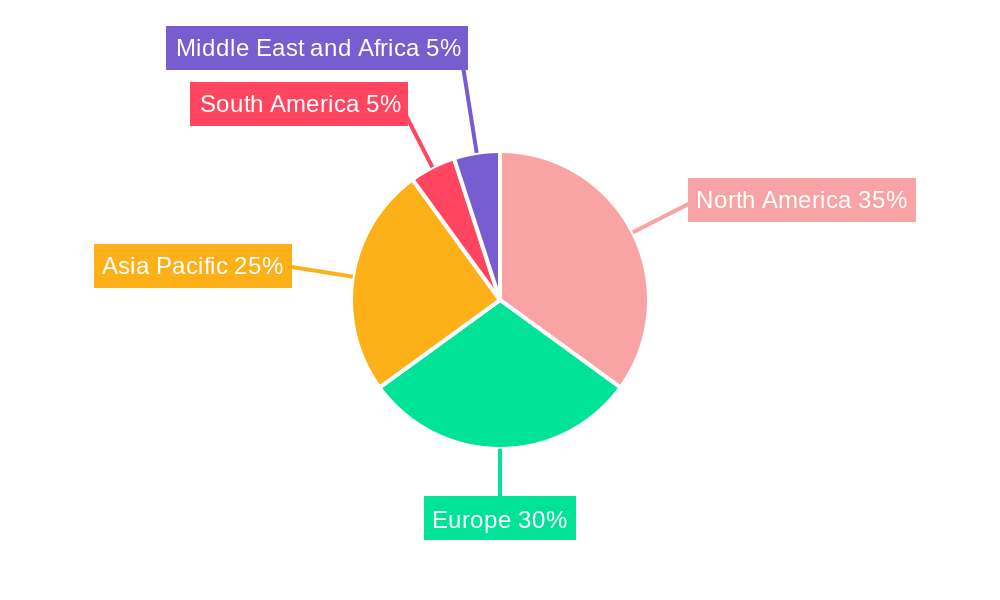
The North American region currently holds the dominant position in the global protein hydrolysate ingredients market. Several factors contribute to this dominance: high disposable incomes, well-established sports nutrition and functional food industries, and a strong regulatory framework supporting the adoption of innovative ingredients. However, the Asia-Pacific region is exhibiting rapid growth, driven by expanding consumer bases in developing countries and increasing health awareness.
By Type: Milk protein hydrolysate currently holds the largest market share, driven by its widespread use in various applications and established production infrastructure. However, the plant protein hydrolysate segment is projected to exhibit the highest growth rate due to rising consumer preference for plant-based alternatives.
By Application: The food and beverage sector represents the largest application segment for protein hydrolysate ingredients, followed by infant nutrition. The sports nutrition and medical/clinical nutrition segments are also experiencing significant growth.
Key Drivers (by region):
- North America: High disposable income, established health and wellness culture, strong regulatory framework.
- Asia-Pacific: Rapidly expanding consumer base, rising health consciousness, increasing investments in food and beverage sectors.
- Europe: Stringent food safety regulations driving product innovation and consumer trust.
Global Protein Hydrolysate Ingredients Market Product Innovations
Recent innovations in protein hydrolysate technology include the development of novel enzymatic hydrolysis methods, resulting in hydrolysates with enhanced functional properties such as improved solubility, emulsification, and foaming capabilities. The market has seen a surge in plant-based protein hydrolysates derived from sources like pea, soy, and brown rice proteins, catering to growing consumer demand for sustainable and ethical ingredients. These advancements offer manufacturers improved product performance, expanded application possibilities, and competitive advantages. Furthermore, advancements in microencapsulation and other delivery systems are enhancing the stability and bioavailability of protein hydrolysates in various applications.
Report Segmentation & Scope
This report segments the global protein hydrolysate ingredients market by type (Milk Protein Hydrolysate, including casein; Plant Protein Hydrolysate, including soy, pea, brown rice; Other Plant Protein Hydrolysates; Animal Protein Hydrolysate) and by application (Food and Beverage, Infant Nutrition, Sports Nutrition, Medical and Clinical Nutrition). Each segment's analysis includes market size estimation, growth projections, and competitive landscape. The report also includes a regional breakdown, offering insights into the market dynamics and future prospects across different geographical locations.
By Type: Each type segment includes a detailed analysis of growth projections, market sizes, production capacity, key players, and their competitive strategies. The plant-based segment is highlighted for its high growth potential.
By Application: The food and beverage segment dominates in terms of market size, while the sports nutrition segment showcases the highest growth rate.
Key Drivers of Global Protein Hydrolysate Ingredients Market Growth
The market's growth is primarily driven by the increasing demand for high-protein foods and dietary supplements, fueled by growing health awareness and changing consumer preferences. Technological advancements in enzymatic hydrolysis and protein extraction techniques are enabling the production of superior-quality hydrolysates. Favorable regulatory frameworks in various regions are supporting market expansion. The rising popularity of plant-based diets and the increasing use of protein hydrolysates in medical and clinical nutrition applications are also contributing to the market's growth trajectory. Furthermore, the shift towards clean-label products and sustainable sourcing practices fuels growth.
Challenges in the Global Protein Hydrolysate Ingredients Market Sector
Fluctuations in raw material prices, particularly dairy and plant-based protein sources, significantly impact production costs and market profitability. Strict regulatory requirements regarding food safety and labeling can pose compliance challenges for manufacturers. Competition from other protein sources and the need to continually innovate to meet evolving consumer preferences present ongoing hurdles. Supply chain disruptions, particularly during periods of global uncertainty, may affect the availability of raw materials and finished products. Ensuring consistent quality and maintaining sustainable sourcing practices are also key challenges for the industry.
Leading Players in the Global Protein Hydrolysate Ingredients Market Market
- AMCO Proteins
- Tate & Lyle PLC
- Agropur Inc
- Royal FrieslandCampina NV
- Kerry Group
- Fonterra Co-operative Group Limited
- Milk Specialties Group
- Arla Foods Ingredients Group PS
- Glanbia PLC
- BASF SE
Key Developments in Global Protein Hydrolysate Ingredients Market Sector
- 2021: AMCO Proteins acquired Proliant Health, expanding its presence in the plant-based protein ingredients market.
- 2020: Tate & Lyle PLC launched a new line of plant-based protein hydrolysates, catering to growing consumer demand.
- 2019: Agropur Inc. opened a new protein hydrolysate production facility in Canada, enhancing its production capacity.
Strategic Global Protein Hydrolysate Ingredients Market Market Outlook
The future of the global protein hydrolysate ingredients market appears promising, driven by ongoing innovation in product development and expanding application areas. Continued growth in the health and wellness sector, coupled with the increasing consumer adoption of protein-rich diets, will fuel demand. Further advancements in sustainable sourcing practices and the development of novel plant-based hydrolysates will shape market dynamics in the years to come. Companies strategically investing in research and development and expanding their product portfolios will be well-positioned to capitalize on emerging opportunities and drive market growth. The market's expansion is anticipated to continue, presenting significant opportunities for established players and new entrants alike.
Global Protein Hydrolysate Ingredients Market Segmentation
-
1. Type
-
1.1. Milk Protein Hydrolysate
- 1.1.1. Whey
- 1.1.2. Caesin
-
1.2. Plant Protein Hydrolysate
- 1.2.1. Soy
- 1.2.2. Other Plant Protein Hydrolysates
- 1.3. Animal Protein Hydrolysate
-
1.1. Milk Protein Hydrolysate
-
2. Application
-
2.1. Food and Beverage
- 2.1.1. Functional Food and Beverage
- 2.1.2. Infant Nutrition
- 2.2. Sports Nutrition
- 2.3. Medical and Clinical Nutrition
-
2.1. Food and Beverage
Global Protein Hydrolysate Ingredients Market Segmentation By Geography
-
1. North America
- 1.1. United States
- 1.2. Canada
- 1.3. Mexico
- 1.4. Rest of North America
-
2. Europe
- 2.1. Germany
- 2.2. United Kingdom
- 2.3. Spain
- 2.4. France
- 2.5. Italy
- 2.6. Rest of Europe
-
3. Asia Pacific
- 3.1. China
- 3.2. Japan
- 3.3. India
- 3.4. Australia
- 3.5. Rest of Asia Pacific
-
4. South America
- 4.1. Brazil
- 4.2. Argentina
- 4.3. Rest of South America
-
5. Middle East and Africa
- 5.1. Saudi Arabia
- 5.2. South Africa
- 5.3. Rest of Middle East
Global Protein Hydrolysate Ingredients Market REPORT HIGHLIGHTS
| Aspects | Details |
|---|---|
| Study Period | 2019-2033 |
| Base Year | 2024 |
| Estimated Year | 2025 |
| Forecast Period | 2025-2033 |
| Historical Period | 2019-2024 |
| Growth Rate | CAGR of 8.26% from 2019-2033 |
| Segmentation |
|
Table of Contents
- 1. Introduction
- 1.1. Research Scope
- 1.2. Market Segmentation
- 1.3. Research Methodology
- 1.4. Definitions and Assumptions
- 2. Executive Summary
- 2.1. Introduction
- 3. Market Dynamics
- 3.1. Introduction
- 3.2. Market Drivers
- 3.2.1. Increasing Demand For Baby Food and Infant Formula; Growing Application of Casein and Caseinates in Protein-rich Food Products
- 3.3. Market Restrains
- 3.3.1. Increasing Manufacturing Costs and Raw Materials Price Hamper the Market Growth
- 3.4. Market Trends
- 3.4.1. Growing Influence Of Healthy Lifestyle Trends And Rising Non-traditional Users
- 4. Market Factor Analysis
- 4.1. Porters Five Forces
- 4.2. Supply/Value Chain
- 4.3. PESTEL analysis
- 4.4. Market Entropy
- 4.5. Patent/Trademark Analysis
- 5. Global Protein Hydrolysate Ingredients Market Analysis, Insights and Forecast, 2019-2031
- 5.1. Market Analysis, Insights and Forecast - by Type
- 5.1.1. Milk Protein Hydrolysate
- 5.1.1.1. Whey
- 5.1.1.2. Caesin
- 5.1.2. Plant Protein Hydrolysate
- 5.1.2.1. Soy
- 5.1.2.2. Other Plant Protein Hydrolysates
- 5.1.3. Animal Protein Hydrolysate
- 5.1.1. Milk Protein Hydrolysate
- 5.2. Market Analysis, Insights and Forecast - by Application
- 5.2.1. Food and Beverage
- 5.2.1.1. Functional Food and Beverage
- 5.2.1.2. Infant Nutrition
- 5.2.2. Sports Nutrition
- 5.2.3. Medical and Clinical Nutrition
- 5.2.1. Food and Beverage
- 5.3. Market Analysis, Insights and Forecast - by Region
- 5.3.1. North America
- 5.3.2. Europe
- 5.3.3. Asia Pacific
- 5.3.4. South America
- 5.3.5. Middle East and Africa
- 5.1. Market Analysis, Insights and Forecast - by Type
- 6. North America Global Protein Hydrolysate Ingredients Market Analysis, Insights and Forecast, 2019-2031
- 6.1. Market Analysis, Insights and Forecast - by Type
- 6.1.1. Milk Protein Hydrolysate
- 6.1.1.1. Whey
- 6.1.1.2. Caesin
- 6.1.2. Plant Protein Hydrolysate
- 6.1.2.1. Soy
- 6.1.2.2. Other Plant Protein Hydrolysates
- 6.1.3. Animal Protein Hydrolysate
- 6.1.1. Milk Protein Hydrolysate
- 6.2. Market Analysis, Insights and Forecast - by Application
- 6.2.1. Food and Beverage
- 6.2.1.1. Functional Food and Beverage
- 6.2.1.2. Infant Nutrition
- 6.2.2. Sports Nutrition
- 6.2.3. Medical and Clinical Nutrition
- 6.2.1. Food and Beverage
- 6.1. Market Analysis, Insights and Forecast - by Type
- 7. Europe Global Protein Hydrolysate Ingredients Market Analysis, Insights and Forecast, 2019-2031
- 7.1. Market Analysis, Insights and Forecast - by Type
- 7.1.1. Milk Protein Hydrolysate
- 7.1.1.1. Whey
- 7.1.1.2. Caesin
- 7.1.2. Plant Protein Hydrolysate
- 7.1.2.1. Soy
- 7.1.2.2. Other Plant Protein Hydrolysates
- 7.1.3. Animal Protein Hydrolysate
- 7.1.1. Milk Protein Hydrolysate
- 7.2. Market Analysis, Insights and Forecast - by Application
- 7.2.1. Food and Beverage
- 7.2.1.1. Functional Food and Beverage
- 7.2.1.2. Infant Nutrition
- 7.2.2. Sports Nutrition
- 7.2.3. Medical and Clinical Nutrition
- 7.2.1. Food and Beverage
- 7.1. Market Analysis, Insights and Forecast - by Type
- 8. Asia Pacific Global Protein Hydrolysate Ingredients Market Analysis, Insights and Forecast, 2019-2031
- 8.1. Market Analysis, Insights and Forecast - by Type
- 8.1.1. Milk Protein Hydrolysate
- 8.1.1.1. Whey
- 8.1.1.2. Caesin
- 8.1.2. Plant Protein Hydrolysate
- 8.1.2.1. Soy
- 8.1.2.2. Other Plant Protein Hydrolysates
- 8.1.3. Animal Protein Hydrolysate
- 8.1.1. Milk Protein Hydrolysate
- 8.2. Market Analysis, Insights and Forecast - by Application
- 8.2.1. Food and Beverage
- 8.2.1.1. Functional Food and Beverage
- 8.2.1.2. Infant Nutrition
- 8.2.2. Sports Nutrition
- 8.2.3. Medical and Clinical Nutrition
- 8.2.1. Food and Beverage
- 8.1. Market Analysis, Insights and Forecast - by Type
- 9. South America Global Protein Hydrolysate Ingredients Market Analysis, Insights and Forecast, 2019-2031
- 9.1. Market Analysis, Insights and Forecast - by Type
- 9.1.1. Milk Protein Hydrolysate
- 9.1.1.1. Whey
- 9.1.1.2. Caesin
- 9.1.2. Plant Protein Hydrolysate
- 9.1.2.1. Soy
- 9.1.2.2. Other Plant Protein Hydrolysates
- 9.1.3. Animal Protein Hydrolysate
- 9.1.1. Milk Protein Hydrolysate
- 9.2. Market Analysis, Insights and Forecast - by Application
- 9.2.1. Food and Beverage
- 9.2.1.1. Functional Food and Beverage
- 9.2.1.2. Infant Nutrition
- 9.2.2. Sports Nutrition
- 9.2.3. Medical and Clinical Nutrition
- 9.2.1. Food and Beverage
- 9.1. Market Analysis, Insights and Forecast - by Type
- 10. Middle East and Africa Global Protein Hydrolysate Ingredients Market Analysis, Insights and Forecast, 2019-2031
- 10.1. Market Analysis, Insights and Forecast - by Type
- 10.1.1. Milk Protein Hydrolysate
- 10.1.1.1. Whey
- 10.1.1.2. Caesin
- 10.1.2. Plant Protein Hydrolysate
- 10.1.2.1. Soy
- 10.1.2.2. Other Plant Protein Hydrolysates
- 10.1.3. Animal Protein Hydrolysate
- 10.1.1. Milk Protein Hydrolysate
- 10.2. Market Analysis, Insights and Forecast - by Application
- 10.2.1. Food and Beverage
- 10.2.1.1. Functional Food and Beverage
- 10.2.1.2. Infant Nutrition
- 10.2.2. Sports Nutrition
- 10.2.3. Medical and Clinical Nutrition
- 10.2.1. Food and Beverage
- 10.1. Market Analysis, Insights and Forecast - by Type
- 11. North America Global Protein Hydrolysate Ingredients Market Analysis, Insights and Forecast, 2019-2031
- 11.1. Market Analysis, Insights and Forecast - By Country/Sub-region
- 11.1.1 United States
- 11.1.2 Canada
- 11.1.3 Mexico
- 11.1.4 Rest of North America
- 12. Europe Global Protein Hydrolysate Ingredients Market Analysis, Insights and Forecast, 2019-2031
- 12.1. Market Analysis, Insights and Forecast - By Country/Sub-region
- 12.1.1 Germany
- 12.1.2 United Kingdom
- 12.1.3 Spain
- 12.1.4 France
- 12.1.5 Italy
- 12.1.6 Rest of Europe
- 13. Asia Pacific Global Protein Hydrolysate Ingredients Market Analysis, Insights and Forecast, 2019-2031
- 13.1. Market Analysis, Insights and Forecast - By Country/Sub-region
- 13.1.1 China
- 13.1.2 Japan
- 13.1.3 India
- 13.1.4 Australia
- 13.1.5 Rest of Asia Pacific
- 14. South America Global Protein Hydrolysate Ingredients Market Analysis, Insights and Forecast, 2019-2031
- 14.1. Market Analysis, Insights and Forecast - By Country/Sub-region
- 14.1.1 Brazil
- 14.1.2 Argentina
- 14.1.3 Rest of South America
- 15. Middle East and Africa Global Protein Hydrolysate Ingredients Market Analysis, Insights and Forecast, 2019-2031
- 15.1. Market Analysis, Insights and Forecast - By Country/Sub-region
- 15.1.1 Saudi Arabia
- 15.1.2 South Africa
- 15.1.3 Rest of Middle East
- 16. Competitive Analysis
- 16.1. Market Share Analysis 2024
- 16.2. Company Profiles
- 16.2.1 AMCO Proteins
- 16.2.1.1. Overview
- 16.2.1.2. Products
- 16.2.1.3. SWOT Analysis
- 16.2.1.4. Recent Developments
- 16.2.1.5. Financials (Based on Availability)
- 16.2.2 Tate & Lyle PLC
- 16.2.2.1. Overview
- 16.2.2.2. Products
- 16.2.2.3. SWOT Analysis
- 16.2.2.4. Recent Developments
- 16.2.2.5. Financials (Based on Availability)
- 16.2.3 Agropur Inc *List Not Exhaustive
- 16.2.3.1. Overview
- 16.2.3.2. Products
- 16.2.3.3. SWOT Analysis
- 16.2.3.4. Recent Developments
- 16.2.3.5. Financials (Based on Availability)
- 16.2.4 Royal FrieslandCampina NV
- 16.2.4.1. Overview
- 16.2.4.2. Products
- 16.2.4.3. SWOT Analysis
- 16.2.4.4. Recent Developments
- 16.2.4.5. Financials (Based on Availability)
- 16.2.5 Kerry Group
- 16.2.5.1. Overview
- 16.2.5.2. Products
- 16.2.5.3. SWOT Analysis
- 16.2.5.4. Recent Developments
- 16.2.5.5. Financials (Based on Availability)
- 16.2.6 Fonterra Co-operative Group Limited
- 16.2.6.1. Overview
- 16.2.6.2. Products
- 16.2.6.3. SWOT Analysis
- 16.2.6.4. Recent Developments
- 16.2.6.5. Financials (Based on Availability)
- 16.2.7 Milk Specialties Group
- 16.2.7.1. Overview
- 16.2.7.2. Products
- 16.2.7.3. SWOT Analysis
- 16.2.7.4. Recent Developments
- 16.2.7.5. Financials (Based on Availability)
- 16.2.8 Arla Foods Ingredients Group PS
- 16.2.8.1. Overview
- 16.2.8.2. Products
- 16.2.8.3. SWOT Analysis
- 16.2.8.4. Recent Developments
- 16.2.8.5. Financials (Based on Availability)
- 16.2.9 Glanbia PLC
- 16.2.9.1. Overview
- 16.2.9.2. Products
- 16.2.9.3. SWOT Analysis
- 16.2.9.4. Recent Developments
- 16.2.9.5. Financials (Based on Availability)
- 16.2.10 BASF SE
- 16.2.10.1. Overview
- 16.2.10.2. Products
- 16.2.10.3. SWOT Analysis
- 16.2.10.4. Recent Developments
- 16.2.10.5. Financials (Based on Availability)
- 16.2.1 AMCO Proteins
List of Figures
- Figure 1: Global Global Protein Hydrolysate Ingredients Market Revenue Breakdown (Million, %) by Region 2024 & 2032
- Figure 2: Global Global Protein Hydrolysate Ingredients Market Volume Breakdown (K Tons, %) by Region 2024 & 2032
- Figure 3: North America Global Protein Hydrolysate Ingredients Market Revenue (Million), by Country 2024 & 2032
- Figure 4: North America Global Protein Hydrolysate Ingredients Market Volume (K Tons), by Country 2024 & 2032
- Figure 5: North America Global Protein Hydrolysate Ingredients Market Revenue Share (%), by Country 2024 & 2032
- Figure 6: North America Global Protein Hydrolysate Ingredients Market Volume Share (%), by Country 2024 & 2032
- Figure 7: Europe Global Protein Hydrolysate Ingredients Market Revenue (Million), by Country 2024 & 2032
- Figure 8: Europe Global Protein Hydrolysate Ingredients Market Volume (K Tons), by Country 2024 & 2032
- Figure 9: Europe Global Protein Hydrolysate Ingredients Market Revenue Share (%), by Country 2024 & 2032
- Figure 10: Europe Global Protein Hydrolysate Ingredients Market Volume Share (%), by Country 2024 & 2032
- Figure 11: Asia Pacific Global Protein Hydrolysate Ingredients Market Revenue (Million), by Country 2024 & 2032
- Figure 12: Asia Pacific Global Protein Hydrolysate Ingredients Market Volume (K Tons), by Country 2024 & 2032
- Figure 13: Asia Pacific Global Protein Hydrolysate Ingredients Market Revenue Share (%), by Country 2024 & 2032
- Figure 14: Asia Pacific Global Protein Hydrolysate Ingredients Market Volume Share (%), by Country 2024 & 2032
- Figure 15: South America Global Protein Hydrolysate Ingredients Market Revenue (Million), by Country 2024 & 2032
- Figure 16: South America Global Protein Hydrolysate Ingredients Market Volume (K Tons), by Country 2024 & 2032
- Figure 17: South America Global Protein Hydrolysate Ingredients Market Revenue Share (%), by Country 2024 & 2032
- Figure 18: South America Global Protein Hydrolysate Ingredients Market Volume Share (%), by Country 2024 & 2032
- Figure 19: Middle East and Africa Global Protein Hydrolysate Ingredients Market Revenue (Million), by Country 2024 & 2032
- Figure 20: Middle East and Africa Global Protein Hydrolysate Ingredients Market Volume (K Tons), by Country 2024 & 2032
- Figure 21: Middle East and Africa Global Protein Hydrolysate Ingredients Market Revenue Share (%), by Country 2024 & 2032
- Figure 22: Middle East and Africa Global Protein Hydrolysate Ingredients Market Volume Share (%), by Country 2024 & 2032
- Figure 23: North America Global Protein Hydrolysate Ingredients Market Revenue (Million), by Type 2024 & 2032
- Figure 24: North America Global Protein Hydrolysate Ingredients Market Volume (K Tons), by Type 2024 & 2032
- Figure 25: North America Global Protein Hydrolysate Ingredients Market Revenue Share (%), by Type 2024 & 2032
- Figure 26: North America Global Protein Hydrolysate Ingredients Market Volume Share (%), by Type 2024 & 2032
- Figure 27: North America Global Protein Hydrolysate Ingredients Market Revenue (Million), by Application 2024 & 2032
- Figure 28: North America Global Protein Hydrolysate Ingredients Market Volume (K Tons), by Application 2024 & 2032
- Figure 29: North America Global Protein Hydrolysate Ingredients Market Revenue Share (%), by Application 2024 & 2032
- Figure 30: North America Global Protein Hydrolysate Ingredients Market Volume Share (%), by Application 2024 & 2032
- Figure 31: North America Global Protein Hydrolysate Ingredients Market Revenue (Million), by Country 2024 & 2032
- Figure 32: North America Global Protein Hydrolysate Ingredients Market Volume (K Tons), by Country 2024 & 2032
- Figure 33: North America Global Protein Hydrolysate Ingredients Market Revenue Share (%), by Country 2024 & 2032
- Figure 34: North America Global Protein Hydrolysate Ingredients Market Volume Share (%), by Country 2024 & 2032
- Figure 35: Europe Global Protein Hydrolysate Ingredients Market Revenue (Million), by Type 2024 & 2032
- Figure 36: Europe Global Protein Hydrolysate Ingredients Market Volume (K Tons), by Type 2024 & 2032
- Figure 37: Europe Global Protein Hydrolysate Ingredients Market Revenue Share (%), by Type 2024 & 2032
- Figure 38: Europe Global Protein Hydrolysate Ingredients Market Volume Share (%), by Type 2024 & 2032
- Figure 39: Europe Global Protein Hydrolysate Ingredients Market Revenue (Million), by Application 2024 & 2032
- Figure 40: Europe Global Protein Hydrolysate Ingredients Market Volume (K Tons), by Application 2024 & 2032
- Figure 41: Europe Global Protein Hydrolysate Ingredients Market Revenue Share (%), by Application 2024 & 2032
- Figure 42: Europe Global Protein Hydrolysate Ingredients Market Volume Share (%), by Application 2024 & 2032
- Figure 43: Europe Global Protein Hydrolysate Ingredients Market Revenue (Million), by Country 2024 & 2032
- Figure 44: Europe Global Protein Hydrolysate Ingredients Market Volume (K Tons), by Country 2024 & 2032
- Figure 45: Europe Global Protein Hydrolysate Ingredients Market Revenue Share (%), by Country 2024 & 2032
- Figure 46: Europe Global Protein Hydrolysate Ingredients Market Volume Share (%), by Country 2024 & 2032
- Figure 47: Asia Pacific Global Protein Hydrolysate Ingredients Market Revenue (Million), by Type 2024 & 2032
- Figure 48: Asia Pacific Global Protein Hydrolysate Ingredients Market Volume (K Tons), by Type 2024 & 2032
- Figure 49: Asia Pacific Global Protein Hydrolysate Ingredients Market Revenue Share (%), by Type 2024 & 2032
- Figure 50: Asia Pacific Global Protein Hydrolysate Ingredients Market Volume Share (%), by Type 2024 & 2032
- Figure 51: Asia Pacific Global Protein Hydrolysate Ingredients Market Revenue (Million), by Application 2024 & 2032
- Figure 52: Asia Pacific Global Protein Hydrolysate Ingredients Market Volume (K Tons), by Application 2024 & 2032
- Figure 53: Asia Pacific Global Protein Hydrolysate Ingredients Market Revenue Share (%), by Application 2024 & 2032
- Figure 54: Asia Pacific Global Protein Hydrolysate Ingredients Market Volume Share (%), by Application 2024 & 2032
- Figure 55: Asia Pacific Global Protein Hydrolysate Ingredients Market Revenue (Million), by Country 2024 & 2032
- Figure 56: Asia Pacific Global Protein Hydrolysate Ingredients Market Volume (K Tons), by Country 2024 & 2032
- Figure 57: Asia Pacific Global Protein Hydrolysate Ingredients Market Revenue Share (%), by Country 2024 & 2032
- Figure 58: Asia Pacific Global Protein Hydrolysate Ingredients Market Volume Share (%), by Country 2024 & 2032
- Figure 59: South America Global Protein Hydrolysate Ingredients Market Revenue (Million), by Type 2024 & 2032
- Figure 60: South America Global Protein Hydrolysate Ingredients Market Volume (K Tons), by Type 2024 & 2032
- Figure 61: South America Global Protein Hydrolysate Ingredients Market Revenue Share (%), by Type 2024 & 2032
- Figure 62: South America Global Protein Hydrolysate Ingredients Market Volume Share (%), by Type 2024 & 2032
- Figure 63: South America Global Protein Hydrolysate Ingredients Market Revenue (Million), by Application 2024 & 2032
- Figure 64: South America Global Protein Hydrolysate Ingredients Market Volume (K Tons), by Application 2024 & 2032
- Figure 65: South America Global Protein Hydrolysate Ingredients Market Revenue Share (%), by Application 2024 & 2032
- Figure 66: South America Global Protein Hydrolysate Ingredients Market Volume Share (%), by Application 2024 & 2032
- Figure 67: South America Global Protein Hydrolysate Ingredients Market Revenue (Million), by Country 2024 & 2032
- Figure 68: South America Global Protein Hydrolysate Ingredients Market Volume (K Tons), by Country 2024 & 2032
- Figure 69: South America Global Protein Hydrolysate Ingredients Market Revenue Share (%), by Country 2024 & 2032
- Figure 70: South America Global Protein Hydrolysate Ingredients Market Volume Share (%), by Country 2024 & 2032
- Figure 71: Middle East and Africa Global Protein Hydrolysate Ingredients Market Revenue (Million), by Type 2024 & 2032
- Figure 72: Middle East and Africa Global Protein Hydrolysate Ingredients Market Volume (K Tons), by Type 2024 & 2032
- Figure 73: Middle East and Africa Global Protein Hydrolysate Ingredients Market Revenue Share (%), by Type 2024 & 2032
- Figure 74: Middle East and Africa Global Protein Hydrolysate Ingredients Market Volume Share (%), by Type 2024 & 2032
- Figure 75: Middle East and Africa Global Protein Hydrolysate Ingredients Market Revenue (Million), by Application 2024 & 2032
- Figure 76: Middle East and Africa Global Protein Hydrolysate Ingredients Market Volume (K Tons), by Application 2024 & 2032
- Figure 77: Middle East and Africa Global Protein Hydrolysate Ingredients Market Revenue Share (%), by Application 2024 & 2032
- Figure 78: Middle East and Africa Global Protein Hydrolysate Ingredients Market Volume Share (%), by Application 2024 & 2032
- Figure 79: Middle East and Africa Global Protein Hydrolysate Ingredients Market Revenue (Million), by Country 2024 & 2032
- Figure 80: Middle East and Africa Global Protein Hydrolysate Ingredients Market Volume (K Tons), by Country 2024 & 2032
- Figure 81: Middle East and Africa Global Protein Hydrolysate Ingredients Market Revenue Share (%), by Country 2024 & 2032
- Figure 82: Middle East and Africa Global Protein Hydrolysate Ingredients Market Volume Share (%), by Country 2024 & 2032
List of Tables
- Table 1: Global Protein Hydrolysate Ingredients Market Revenue Million Forecast, by Region 2019 & 2032
- Table 2: Global Protein Hydrolysate Ingredients Market Volume K Tons Forecast, by Region 2019 & 2032
- Table 3: Global Protein Hydrolysate Ingredients Market Revenue Million Forecast, by Type 2019 & 2032
- Table 4: Global Protein Hydrolysate Ingredients Market Volume K Tons Forecast, by Type 2019 & 2032
- Table 5: Global Protein Hydrolysate Ingredients Market Revenue Million Forecast, by Application 2019 & 2032
- Table 6: Global Protein Hydrolysate Ingredients Market Volume K Tons Forecast, by Application 2019 & 2032
- Table 7: Global Protein Hydrolysate Ingredients Market Revenue Million Forecast, by Region 2019 & 2032
- Table 8: Global Protein Hydrolysate Ingredients Market Volume K Tons Forecast, by Region 2019 & 2032
- Table 9: Global Protein Hydrolysate Ingredients Market Revenue Million Forecast, by Country 2019 & 2032
- Table 10: Global Protein Hydrolysate Ingredients Market Volume K Tons Forecast, by Country 2019 & 2032
- Table 11: United States Global Protein Hydrolysate Ingredients Market Revenue (Million) Forecast, by Application 2019 & 2032
- Table 12: United States Global Protein Hydrolysate Ingredients Market Volume (K Tons) Forecast, by Application 2019 & 2032
- Table 13: Canada Global Protein Hydrolysate Ingredients Market Revenue (Million) Forecast, by Application 2019 & 2032
- Table 14: Canada Global Protein Hydrolysate Ingredients Market Volume (K Tons) Forecast, by Application 2019 & 2032
- Table 15: Mexico Global Protein Hydrolysate Ingredients Market Revenue (Million) Forecast, by Application 2019 & 2032
- Table 16: Mexico Global Protein Hydrolysate Ingredients Market Volume (K Tons) Forecast, by Application 2019 & 2032
- Table 17: Rest of North America Global Protein Hydrolysate Ingredients Market Revenue (Million) Forecast, by Application 2019 & 2032
- Table 18: Rest of North America Global Protein Hydrolysate Ingredients Market Volume (K Tons) Forecast, by Application 2019 & 2032
- Table 19: Global Protein Hydrolysate Ingredients Market Revenue Million Forecast, by Country 2019 & 2032
- Table 20: Global Protein Hydrolysate Ingredients Market Volume K Tons Forecast, by Country 2019 & 2032
- Table 21: Germany Global Protein Hydrolysate Ingredients Market Revenue (Million) Forecast, by Application 2019 & 2032
- Table 22: Germany Global Protein Hydrolysate Ingredients Market Volume (K Tons) Forecast, by Application 2019 & 2032
- Table 23: United Kingdom Global Protein Hydrolysate Ingredients Market Revenue (Million) Forecast, by Application 2019 & 2032
- Table 24: United Kingdom Global Protein Hydrolysate Ingredients Market Volume (K Tons) Forecast, by Application 2019 & 2032
- Table 25: Spain Global Protein Hydrolysate Ingredients Market Revenue (Million) Forecast, by Application 2019 & 2032
- Table 26: Spain Global Protein Hydrolysate Ingredients Market Volume (K Tons) Forecast, by Application 2019 & 2032
- Table 27: France Global Protein Hydrolysate Ingredients Market Revenue (Million) Forecast, by Application 2019 & 2032
- Table 28: France Global Protein Hydrolysate Ingredients Market Volume (K Tons) Forecast, by Application 2019 & 2032
- Table 29: Italy Global Protein Hydrolysate Ingredients Market Revenue (Million) Forecast, by Application 2019 & 2032
- Table 30: Italy Global Protein Hydrolysate Ingredients Market Volume (K Tons) Forecast, by Application 2019 & 2032
- Table 31: Rest of Europe Global Protein Hydrolysate Ingredients Market Revenue (Million) Forecast, by Application 2019 & 2032
- Table 32: Rest of Europe Global Protein Hydrolysate Ingredients Market Volume (K Tons) Forecast, by Application 2019 & 2032
- Table 33: Global Protein Hydrolysate Ingredients Market Revenue Million Forecast, by Country 2019 & 2032
- Table 34: Global Protein Hydrolysate Ingredients Market Volume K Tons Forecast, by Country 2019 & 2032
- Table 35: China Global Protein Hydrolysate Ingredients Market Revenue (Million) Forecast, by Application 2019 & 2032
- Table 36: China Global Protein Hydrolysate Ingredients Market Volume (K Tons) Forecast, by Application 2019 & 2032
- Table 37: Japan Global Protein Hydrolysate Ingredients Market Revenue (Million) Forecast, by Application 2019 & 2032
- Table 38: Japan Global Protein Hydrolysate Ingredients Market Volume (K Tons) Forecast, by Application 2019 & 2032
- Table 39: India Global Protein Hydrolysate Ingredients Market Revenue (Million) Forecast, by Application 2019 & 2032
- Table 40: India Global Protein Hydrolysate Ingredients Market Volume (K Tons) Forecast, by Application 2019 & 2032
- Table 41: Australia Global Protein Hydrolysate Ingredients Market Revenue (Million) Forecast, by Application 2019 & 2032
- Table 42: Australia Global Protein Hydrolysate Ingredients Market Volume (K Tons) Forecast, by Application 2019 & 2032
- Table 43: Rest of Asia Pacific Global Protein Hydrolysate Ingredients Market Revenue (Million) Forecast, by Application 2019 & 2032
- Table 44: Rest of Asia Pacific Global Protein Hydrolysate Ingredients Market Volume (K Tons) Forecast, by Application 2019 & 2032
- Table 45: Global Protein Hydrolysate Ingredients Market Revenue Million Forecast, by Country 2019 & 2032
- Table 46: Global Protein Hydrolysate Ingredients Market Volume K Tons Forecast, by Country 2019 & 2032
- Table 47: Brazil Global Protein Hydrolysate Ingredients Market Revenue (Million) Forecast, by Application 2019 & 2032
- Table 48: Brazil Global Protein Hydrolysate Ingredients Market Volume (K Tons) Forecast, by Application 2019 & 2032
- Table 49: Argentina Global Protein Hydrolysate Ingredients Market Revenue (Million) Forecast, by Application 2019 & 2032
- Table 50: Argentina Global Protein Hydrolysate Ingredients Market Volume (K Tons) Forecast, by Application 2019 & 2032
- Table 51: Rest of South America Global Protein Hydrolysate Ingredients Market Revenue (Million) Forecast, by Application 2019 & 2032
- Table 52: Rest of South America Global Protein Hydrolysate Ingredients Market Volume (K Tons) Forecast, by Application 2019 & 2032
- Table 53: Global Protein Hydrolysate Ingredients Market Revenue Million Forecast, by Country 2019 & 2032
- Table 54: Global Protein Hydrolysate Ingredients Market Volume K Tons Forecast, by Country 2019 & 2032
- Table 55: Saudi Arabia Global Protein Hydrolysate Ingredients Market Revenue (Million) Forecast, by Application 2019 & 2032
- Table 56: Saudi Arabia Global Protein Hydrolysate Ingredients Market Volume (K Tons) Forecast, by Application 2019 & 2032
- Table 57: South Africa Global Protein Hydrolysate Ingredients Market Revenue (Million) Forecast, by Application 2019 & 2032
- Table 58: South Africa Global Protein Hydrolysate Ingredients Market Volume (K Tons) Forecast, by Application 2019 & 2032
- Table 59: Rest of Middle East Global Protein Hydrolysate Ingredients Market Revenue (Million) Forecast, by Application 2019 & 2032
- Table 60: Rest of Middle East Global Protein Hydrolysate Ingredients Market Volume (K Tons) Forecast, by Application 2019 & 2032
- Table 61: Global Protein Hydrolysate Ingredients Market Revenue Million Forecast, by Type 2019 & 2032
- Table 62: Global Protein Hydrolysate Ingredients Market Volume K Tons Forecast, by Type 2019 & 2032
- Table 63: Global Protein Hydrolysate Ingredients Market Revenue Million Forecast, by Application 2019 & 2032
- Table 64: Global Protein Hydrolysate Ingredients Market Volume K Tons Forecast, by Application 2019 & 2032
- Table 65: Global Protein Hydrolysate Ingredients Market Revenue Million Forecast, by Country 2019 & 2032
- Table 66: Global Protein Hydrolysate Ingredients Market Volume K Tons Forecast, by Country 2019 & 2032
- Table 67: United States Global Protein Hydrolysate Ingredients Market Revenue (Million) Forecast, by Application 2019 & 2032
- Table 68: United States Global Protein Hydrolysate Ingredients Market Volume (K Tons) Forecast, by Application 2019 & 2032
- Table 69: Canada Global Protein Hydrolysate Ingredients Market Revenue (Million) Forecast, by Application 2019 & 2032
- Table 70: Canada Global Protein Hydrolysate Ingredients Market Volume (K Tons) Forecast, by Application 2019 & 2032
- Table 71: Mexico Global Protein Hydrolysate Ingredients Market Revenue (Million) Forecast, by Application 2019 & 2032
- Table 72: Mexico Global Protein Hydrolysate Ingredients Market Volume (K Tons) Forecast, by Application 2019 & 2032
- Table 73: Rest of North America Global Protein Hydrolysate Ingredients Market Revenue (Million) Forecast, by Application 2019 & 2032
- Table 74: Rest of North America Global Protein Hydrolysate Ingredients Market Volume (K Tons) Forecast, by Application 2019 & 2032
- Table 75: Global Protein Hydrolysate Ingredients Market Revenue Million Forecast, by Type 2019 & 2032
- Table 76: Global Protein Hydrolysate Ingredients Market Volume K Tons Forecast, by Type 2019 & 2032
- Table 77: Global Protein Hydrolysate Ingredients Market Revenue Million Forecast, by Application 2019 & 2032
- Table 78: Global Protein Hydrolysate Ingredients Market Volume K Tons Forecast, by Application 2019 & 2032
- Table 79: Global Protein Hydrolysate Ingredients Market Revenue Million Forecast, by Country 2019 & 2032
- Table 80: Global Protein Hydrolysate Ingredients Market Volume K Tons Forecast, by Country 2019 & 2032
- Table 81: Germany Global Protein Hydrolysate Ingredients Market Revenue (Million) Forecast, by Application 2019 & 2032
- Table 82: Germany Global Protein Hydrolysate Ingredients Market Volume (K Tons) Forecast, by Application 2019 & 2032
- Table 83: United Kingdom Global Protein Hydrolysate Ingredients Market Revenue (Million) Forecast, by Application 2019 & 2032
- Table 84: United Kingdom Global Protein Hydrolysate Ingredients Market Volume (K Tons) Forecast, by Application 2019 & 2032
- Table 85: Spain Global Protein Hydrolysate Ingredients Market Revenue (Million) Forecast, by Application 2019 & 2032
- Table 86: Spain Global Protein Hydrolysate Ingredients Market Volume (K Tons) Forecast, by Application 2019 & 2032
- Table 87: France Global Protein Hydrolysate Ingredients Market Revenue (Million) Forecast, by Application 2019 & 2032
- Table 88: France Global Protein Hydrolysate Ingredients Market Volume (K Tons) Forecast, by Application 2019 & 2032
- Table 89: Italy Global Protein Hydrolysate Ingredients Market Revenue (Million) Forecast, by Application 2019 & 2032
- Table 90: Italy Global Protein Hydrolysate Ingredients Market Volume (K Tons) Forecast, by Application 2019 & 2032
- Table 91: Rest of Europe Global Protein Hydrolysate Ingredients Market Revenue (Million) Forecast, by Application 2019 & 2032
- Table 92: Rest of Europe Global Protein Hydrolysate Ingredients Market Volume (K Tons) Forecast, by Application 2019 & 2032
- Table 93: Global Protein Hydrolysate Ingredients Market Revenue Million Forecast, by Type 2019 & 2032
- Table 94: Global Protein Hydrolysate Ingredients Market Volume K Tons Forecast, by Type 2019 & 2032
- Table 95: Global Protein Hydrolysate Ingredients Market Revenue Million Forecast, by Application 2019 & 2032
- Table 96: Global Protein Hydrolysate Ingredients Market Volume K Tons Forecast, by Application 2019 & 2032
- Table 97: Global Protein Hydrolysate Ingredients Market Revenue Million Forecast, by Country 2019 & 2032
- Table 98: Global Protein Hydrolysate Ingredients Market Volume K Tons Forecast, by Country 2019 & 2032
- Table 99: China Global Protein Hydrolysate Ingredients Market Revenue (Million) Forecast, by Application 2019 & 2032
- Table 100: China Global Protein Hydrolysate Ingredients Market Volume (K Tons) Forecast, by Application 2019 & 2032
- Table 101: Japan Global Protein Hydrolysate Ingredients Market Revenue (Million) Forecast, by Application 2019 & 2032
- Table 102: Japan Global Protein Hydrolysate Ingredients Market Volume (K Tons) Forecast, by Application 2019 & 2032
- Table 103: India Global Protein Hydrolysate Ingredients Market Revenue (Million) Forecast, by Application 2019 & 2032
- Table 104: India Global Protein Hydrolysate Ingredients Market Volume (K Tons) Forecast, by Application 2019 & 2032
- Table 105: Australia Global Protein Hydrolysate Ingredients Market Revenue (Million) Forecast, by Application 2019 & 2032
- Table 106: Australia Global Protein Hydrolysate Ingredients Market Volume (K Tons) Forecast, by Application 2019 & 2032
- Table 107: Rest of Asia Pacific Global Protein Hydrolysate Ingredients Market Revenue (Million) Forecast, by Application 2019 & 2032
- Table 108: Rest of Asia Pacific Global Protein Hydrolysate Ingredients Market Volume (K Tons) Forecast, by Application 2019 & 2032
- Table 109: Global Protein Hydrolysate Ingredients Market Revenue Million Forecast, by Type 2019 & 2032
- Table 110: Global Protein Hydrolysate Ingredients Market Volume K Tons Forecast, by Type 2019 & 2032
- Table 111: Global Protein Hydrolysate Ingredients Market Revenue Million Forecast, by Application 2019 & 2032
- Table 112: Global Protein Hydrolysate Ingredients Market Volume K Tons Forecast, by Application 2019 & 2032
- Table 113: Global Protein Hydrolysate Ingredients Market Revenue Million Forecast, by Country 2019 & 2032
- Table 114: Global Protein Hydrolysate Ingredients Market Volume K Tons Forecast, by Country 2019 & 2032
- Table 115: Brazil Global Protein Hydrolysate Ingredients Market Revenue (Million) Forecast, by Application 2019 & 2032
- Table 116: Brazil Global Protein Hydrolysate Ingredients Market Volume (K Tons) Forecast, by Application 2019 & 2032
- Table 117: Argentina Global Protein Hydrolysate Ingredients Market Revenue (Million) Forecast, by Application 2019 & 2032
- Table 118: Argentina Global Protein Hydrolysate Ingredients Market Volume (K Tons) Forecast, by Application 2019 & 2032
- Table 119: Rest of South America Global Protein Hydrolysate Ingredients Market Revenue (Million) Forecast, by Application 2019 & 2032
- Table 120: Rest of South America Global Protein Hydrolysate Ingredients Market Volume (K Tons) Forecast, by Application 2019 & 2032
- Table 121: Global Protein Hydrolysate Ingredients Market Revenue Million Forecast, by Type 2019 & 2032
- Table 122: Global Protein Hydrolysate Ingredients Market Volume K Tons Forecast, by Type 2019 & 2032
- Table 123: Global Protein Hydrolysate Ingredients Market Revenue Million Forecast, by Application 2019 & 2032
- Table 124: Global Protein Hydrolysate Ingredients Market Volume K Tons Forecast, by Application 2019 & 2032
- Table 125: Global Protein Hydrolysate Ingredients Market Revenue Million Forecast, by Country 2019 & 2032
- Table 126: Global Protein Hydrolysate Ingredients Market Volume K Tons Forecast, by Country 2019 & 2032
- Table 127: Saudi Arabia Global Protein Hydrolysate Ingredients Market Revenue (Million) Forecast, by Application 2019 & 2032
- Table 128: Saudi Arabia Global Protein Hydrolysate Ingredients Market Volume (K Tons) Forecast, by Application 2019 & 2032
- Table 129: South Africa Global Protein Hydrolysate Ingredients Market Revenue (Million) Forecast, by Application 2019 & 2032
- Table 130: South Africa Global Protein Hydrolysate Ingredients Market Volume (K Tons) Forecast, by Application 2019 & 2032
- Table 131: Rest of Middle East Global Protein Hydrolysate Ingredients Market Revenue (Million) Forecast, by Application 2019 & 2032
- Table 132: Rest of Middle East Global Protein Hydrolysate Ingredients Market Volume (K Tons) Forecast, by Application 2019 & 2032
Frequently Asked Questions
1. What is the projected Compound Annual Growth Rate (CAGR) of the Global Protein Hydrolysate Ingredients Market?
The projected CAGR is approximately 8.26%.
2. Which companies are prominent players in the Global Protein Hydrolysate Ingredients Market?
Key companies in the market include AMCO Proteins, Tate & Lyle PLC, Agropur Inc *List Not Exhaustive, Royal FrieslandCampina NV, Kerry Group, Fonterra Co-operative Group Limited, Milk Specialties Group, Arla Foods Ingredients Group PS, Glanbia PLC, BASF SE.
3. What are the main segments of the Global Protein Hydrolysate Ingredients Market?
The market segments include Type, Application.
4. Can you provide details about the market size?
The market size is estimated to be USD 3500 Million as of 2022.
5. What are some drivers contributing to market growth?
Increasing Demand For Baby Food and Infant Formula; Growing Application of Casein and Caseinates in Protein-rich Food Products.
6. What are the notable trends driving market growth?
Growing Influence Of Healthy Lifestyle Trends And Rising Non-traditional Users.
7. Are there any restraints impacting market growth?
Increasing Manufacturing Costs and Raw Materials Price Hamper the Market Growth.
8. Can you provide examples of recent developments in the market?
In 2021, AMCO Proteins acquired Proliant Health, a leading manufacturer of plant-based protein ingredients.
9. What pricing options are available for accessing the report?
Pricing options include single-user, multi-user, and enterprise licenses priced at USD 4750, USD 5250, and USD 8750 respectively.
10. Is the market size provided in terms of value or volume?
The market size is provided in terms of value, measured in Million and volume, measured in K Tons.
11. Are there any specific market keywords associated with the report?
Yes, the market keyword associated with the report is "Global Protein Hydrolysate Ingredients Market," which aids in identifying and referencing the specific market segment covered.
12. How do I determine which pricing option suits my needs best?
The pricing options vary based on user requirements and access needs. Individual users may opt for single-user licenses, while businesses requiring broader access may choose multi-user or enterprise licenses for cost-effective access to the report.
13. Are there any additional resources or data provided in the Global Protein Hydrolysate Ingredients Market report?
While the report offers comprehensive insights, it's advisable to review the specific contents or supplementary materials provided to ascertain if additional resources or data are available.
14. How can I stay updated on further developments or reports in the Global Protein Hydrolysate Ingredients Market?
To stay informed about further developments, trends, and reports in the Global Protein Hydrolysate Ingredients Market, consider subscribing to industry newsletters, following relevant companies and organizations, or regularly checking reputable industry news sources and publications.
Methodology
Step 1 - Identification of Relevant Samples Size from Population Database


Step 2 - Approaches for Defining Global Market Size (Value, Volume* & Price*)

Note*: In applicable scenarios
Step 3 - Data Sources
Primary Research
- Web Analytics
- Survey Reports
- Research Institute
- Latest Research Reports
- Opinion Leaders
Secondary Research
- Annual Reports
- White Paper
- Latest Press Release
- Industry Association
- Paid Database
- Investor Presentations

Step 4 - Data Triangulation
Involves using different sources of information in order to increase the validity of a study
These sources are likely to be stakeholders in a program - participants, other researchers, program staff, other community members, and so on.
Then we put all data in single framework & apply various statistical tools to find out the dynamic on the market.
During the analysis stage, feedback from the stakeholder groups would be compared to determine areas of agreement as well as areas of divergence


