
Key Insights
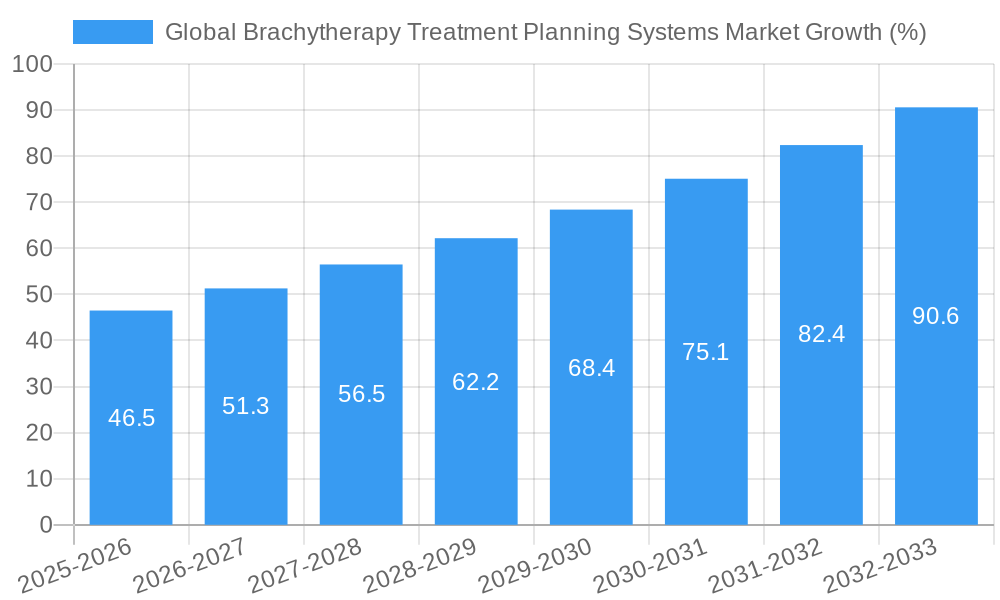
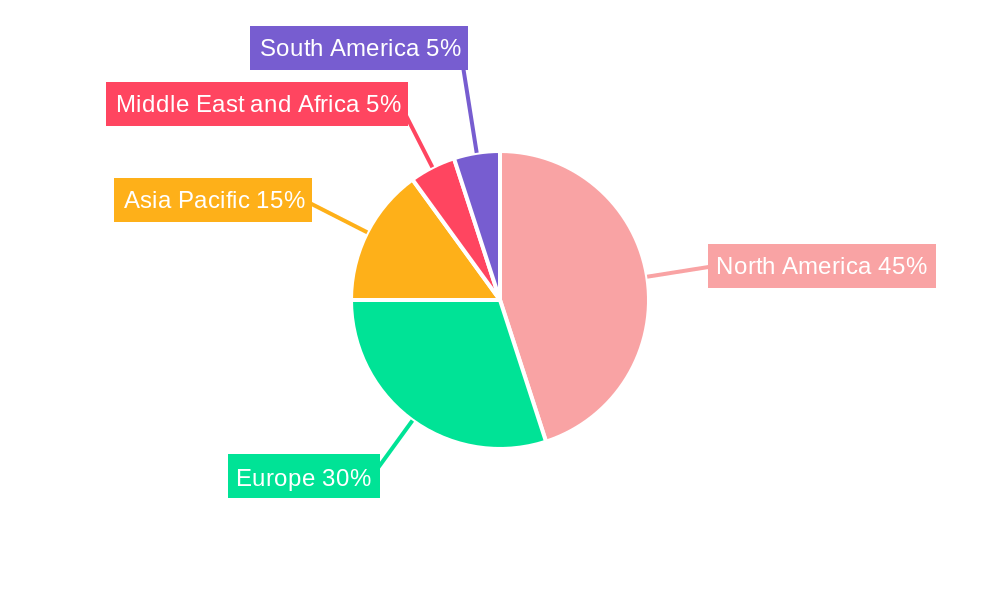
The global brachytherapy treatment planning systems market is experiencing robust growth, driven by the increasing prevalence of cancer, advancements in imaging technology, and the rising adoption of minimally invasive procedures. The market's compound annual growth rate (CAGR) of 9.30% from 2019 to 2024 suggests a significant expansion, projected to continue into the forecast period (2025-2033). Key drivers include the development of sophisticated software incorporating advanced features like auto-contouring and multi-modality capabilities, enabling more precise treatment planning and improved patient outcomes. The integration of techniques such as 3D image reconstruction and image registration using GPUs further enhances the accuracy and efficiency of brachytherapy treatment. Technological advancements are also leading to the development of specialized software for specific brachytherapy applications, such as PET/CT deformable image registration software, catering to diverse clinical needs. While the market faces certain restraints such as high initial investment costs for advanced systems and the need for specialized training for medical professionals, the overall positive trends related to cancer care and technological innovation are expected to outweigh these challenges. The market is segmented by component (software types) and technique (imaging modalities), with auto-contouring software and 3D image reconstruction representing significant segments experiencing high growth due to their clinical benefits. North America currently holds a substantial market share, driven by advanced healthcare infrastructure and high cancer incidence rates. However, Asia Pacific is projected to witness significant growth in the coming years due to increasing healthcare spending and rising cancer diagnosis rates in the region.
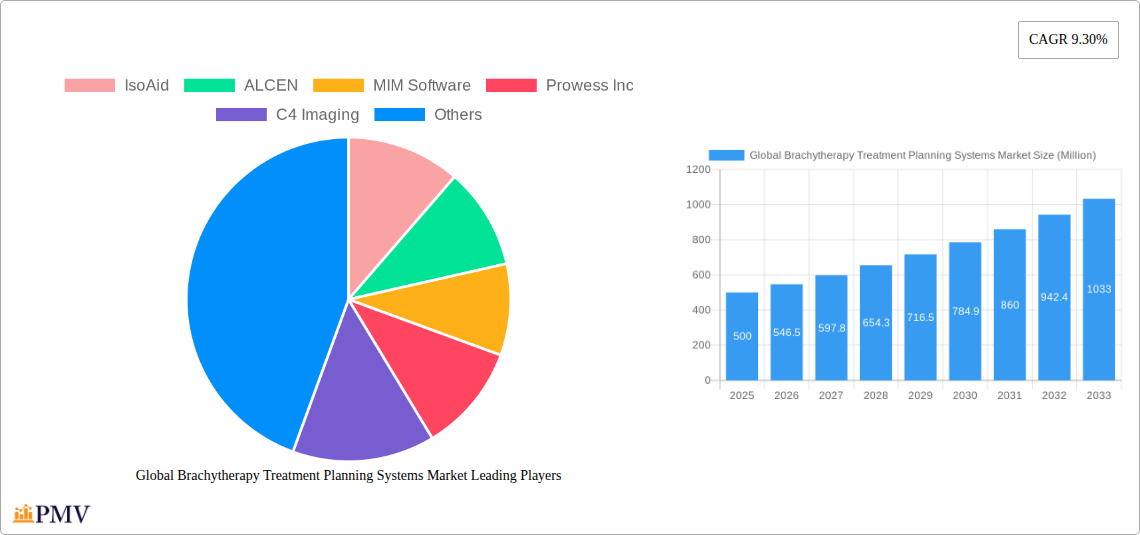
The competitive landscape comprises a mix of established players like Elekta AB, Varian Medical Systems, and RaySearch Laboratories, alongside smaller, specialized companies. These companies are actively engaged in research and development, driving innovation in software features and functionalities. Strategic partnerships and acquisitions are also expected to play a crucial role in shaping the market's competitive dynamics. The continued focus on improving the accuracy, efficiency, and accessibility of brachytherapy treatment, combined with the ongoing technological advancements, strongly suggests a positive outlook for the market's growth trajectory throughout the forecast period. The market size in 2025 is estimated at $500 million, based on the CAGR and considering typical market growth patterns in the medical technology sector.
Global Brachytherapy Treatment Planning Systems Market: A Comprehensive Report (2019-2033)
This comprehensive report provides an in-depth analysis of the Global Brachytherapy Treatment Planning Systems Market, covering the historical period (2019-2024), base year (2025), and forecast period (2025-2033). It offers invaluable insights into market size, segmentation, growth drivers, challenges, competitive landscape, and future outlook, empowering stakeholders to make informed strategic decisions. The report meticulously examines key players like IsoAid, ALCEN, MIM Software, Prowess Inc, C4 Imaging, Theragenics Corporation, Elekta AB, Varian Medical Systems, RaySearch Laboratories, Eckert & Ziegler BEBIG, Concure Oncology, Sensus Healthcare Inc, and IsoRay Inc., analyzing their contributions to the market's evolution.
Global Brachytherapy Treatment Planning Systems Market Structure & Competitive Dynamics
The global brachytherapy treatment planning systems market exhibits a moderately concentrated structure, with a few key players holding significant market share. The market's competitive dynamics are shaped by ongoing innovation, stringent regulatory frameworks, and the emergence of substitute technologies. End-user trends, particularly the increasing adoption of advanced imaging techniques and personalized medicine, are significantly influencing market growth. The market has witnessed several mergers and acquisitions (M&A) activities in recent years, with deal values exceeding xx Million in the past five years. Key players are focusing on strategic partnerships and collaborations to expand their market reach and enhance their product portfolios.
- Market Concentration: The top 5 players hold an estimated xx% market share, indicating moderate concentration.
- Innovation Ecosystems: Collaboration between medical device manufacturers, software developers, and research institutions drives innovation.
- Regulatory Frameworks: Stringent regulatory approvals impact market entry and product development timelines.
- Product Substitutes: Advancements in external beam radiotherapy pose a competitive threat.
- End-User Trends: Demand is driven by increasing cancer incidence and a preference for minimally invasive treatments.
- M&A Activities: Consolidation is expected to continue, driven by the need for enhanced market presence and technological capabilities.
Global Brachytherapy Treatment Planning Systems Market Industry Trends & Insights
The global brachytherapy treatment planning systems market is projected to witness a Compound Annual Growth Rate (CAGR) of xx% during the forecast period (2025-2033). This growth is fueled by several factors, including the rising prevalence of cancer globally, technological advancements in imaging and treatment planning software, increasing adoption of minimally invasive procedures, and favorable reimbursement policies in developed countries. Market penetration remains relatively low in developing nations but is expected to improve with increased healthcare infrastructure and awareness. Technological disruptions, such as the integration of artificial intelligence (AI) and machine learning (ML) in treatment planning, are reshaping the competitive landscape. Consumer preferences are shifting towards personalized and precise radiotherapy solutions, driving demand for advanced brachytherapy planning systems.
Dominant Markets & Segments in Global Brachytherapy Treatment Planning Systems Market
North America currently dominates the global brachytherapy treatment planning systems market, driven by high cancer incidence rates, advanced healthcare infrastructure, and robust reimbursement policies. Within the segment breakdown:
- Component: Auto-Contouring Software holds the largest market share, followed by Multi-Modality Software, driven by its efficiency in treatment planning.
- Technique: 3D Image Reconstruction is the leading technique segment owing to its high accuracy and detailed anatomical visualization capabilities. Growth in In-Room Imaging is driven by the advantages of real-time image guidance and adaptive radiotherapy.
Key Drivers:
- North America: High healthcare expenditure, robust research & development activities, and early adoption of new technologies.
- Europe: Growing awareness of advanced radiotherapy techniques and increasing government investments in healthcare infrastructure.
- Asia Pacific: Rising cancer incidence, expanding healthcare infrastructure, and increasing disposable incomes are contributing factors to market growth.
Global Brachytherapy Treatment Planning Systems Market Product Innovations
Recent innovations focus on enhancing the accuracy, efficiency, and personalization of brachytherapy treatment planning. New systems incorporate advanced imaging techniques, AI-powered algorithms for auto-contouring and treatment optimization, and cloud-based platforms for improved collaboration and data management. These advancements are improving treatment outcomes and reducing treatment times. The market is witnessing a shift toward integrated platforms that combine treatment planning with dose calculation and quality assurance functionalities.
Report Segmentation & Scope
The report segments the market by Component (Auto-Contouring Software, Multi-Modality Software, PET/CT Deformable Software, DICOM-RT Software) and Technique (3D Image Reconstruction, In-Room Imaging, Image Registration using Graphics Processor Unit). Each segment's growth trajectory, market size, and competitive landscape are analyzed individually, offering granular insights into market dynamics. The report provides detailed projections for each segment, including market size and growth rate for the forecast period.
Key Drivers of Global Brachytherapy Treatment Planning Systems Market Growth
Technological advancements, such as AI-driven treatment planning and improved imaging modalities, are major drivers. The rising incidence of cancer globally fuels market demand. Favorable regulatory policies and reimbursement schemes in several countries further contribute to the market's growth. Furthermore, increasing awareness amongst healthcare professionals about the benefits of brachytherapy also boosts the demand for advanced planning systems.
Challenges in the Global Brachytherapy Treatment Planning Systems Market Sector
High initial investment costs for advanced systems can be a barrier to adoption. The complexity of these systems necessitates specialized training for healthcare professionals. Stringent regulatory approvals and potential supply chain disruptions can also impact market growth. Intense competition amongst established players and emerging companies poses a challenge.
Leading Players in the Global Brachytherapy Treatment Planning Systems Market Market
- IsoAid
- ALCEN
- MIM Software
- Prowess Inc
- C4 Imaging
- Theragenics Corporation
- Elekta AB
- Varian Medical Systems
- RaySearch Laboratories
- Eckert & Ziegler BEBIG
- Concure Oncology
- Sensus Healthcare Inc
- IsoRay Inc
Key Developments in Global Brachytherapy Treatment Planning Systems Market Sector
- July 2022: RaySearch Laboratories AB launched RayStation 12A, featuring innovative features and general enhancements.
- June 2022: Isoray, Inc. hosted a symposium featuring Dr. Stephen J. Frank at the American Brachytherapy Society's annual conference.
Strategic Global Brachytherapy Treatment Planning Systems Market Outlook
The market presents significant growth opportunities driven by technological advancements and a growing need for precise and personalized radiotherapy. Strategic partnerships, investments in R&D, and expansion into emerging markets are expected to shape the future of the industry. Companies focusing on innovative solutions, such as AI-driven treatment planning and cloud-based platforms, are well-positioned to capitalize on the market's potential.
Global Brachytherapy Treatment Planning Systems Market Segmentation
-
1. Component
- 1.1. Auto-Contouring Software
- 1.2. Multi-Modality Software
- 1.3. PET/CT Deformable Software
- 1.4. DICOM-RT Software
-
2. Technique
- 2.1. 3D Image Reconstruction
- 2.2. In-Room Imaging
- 2.3. Image Registration using Graphics Processor Unit
Global Brachytherapy Treatment Planning Systems Market Segmentation By Geography
-
1. North America
- 1.1. United States
- 1.2. Canada
- 1.3. Mexico
-
2. Europe
- 2.1. Germany
- 2.2. United Kingdom
- 2.3. France
- 2.4. Italy
- 2.5. Spain
- 2.6. Rest of Europe
-
3. Asia Pacific
- 3.1. China
- 3.2. Japan
- 3.3. India
- 3.4. Australia
- 3.5. South Korea
- 3.6. Rest of Asia Pacific
-
4. Middle East and Africa
- 4.1. GCC
- 4.2. South Africa
- 4.3. Rest of Middle East and Africa
-
5. South America
- 5.1. Brazil
- 5.2. Argentina
- 5.3. Rest of South America
Global Brachytherapy Treatment Planning Systems Market REPORT HIGHLIGHTS
| Aspects | Details |
|---|---|
| Study Period | 2019-2033 |
| Base Year | 2024 |
| Estimated Year | 2025 |
| Forecast Period | 2025-2033 |
| Historical Period | 2019-2024 |
| Growth Rate | CAGR of 9.30% from 2019-2033 |
| Segmentation |
|
Table of Contents
- 1. Introduction
- 1.1. Research Scope
- 1.2. Market Segmentation
- 1.3. Research Methodology
- 1.4. Definitions and Assumptions
- 2. Executive Summary
- 2.1. Introduction
- 3. Market Dynamics
- 3.1. Introduction
- 3.2. Market Drivers
- 3.2.1. Increasing Investments And Strategic Initiatives In Radiation Therapy and Rising Adoption Of Ai/Ml-c in Oncology Software; Increasing Prevalence Of Cancer; Increasing Healthcare IT Expenditure
- 3.3. Market Restrains
- 3.3.1. Shortage Of Healthcare Personnel In Information Technology And Radiology Sector; Cybersecurity And Privacy Concerns
- 3.4. Market Trends
- 3.4.1. The Auto-Contouring Software Segment is Expected to Witness Growth Over the Forecast Period
- 4. Market Factor Analysis
- 4.1. Porters Five Forces
- 4.2. Supply/Value Chain
- 4.3. PESTEL analysis
- 4.4. Market Entropy
- 4.5. Patent/Trademark Analysis
- 5. Global Brachytherapy Treatment Planning Systems Market Analysis, Insights and Forecast, 2019-2031
- 5.1. Market Analysis, Insights and Forecast - by Component
- 5.1.1. Auto-Contouring Software
- 5.1.2. Multi-Modality Software
- 5.1.3. PET/CT Deformable Software
- 5.1.4. DICOM-RT Software
- 5.2. Market Analysis, Insights and Forecast - by Technique
- 5.2.1. 3D Image Reconstruction
- 5.2.2. In-Room Imaging
- 5.2.3. Image Registration using Graphics Processor Unit
- 5.3. Market Analysis, Insights and Forecast - by Region
- 5.3.1. North America
- 5.3.2. Europe
- 5.3.3. Asia Pacific
- 5.3.4. Middle East and Africa
- 5.3.5. South America
- 5.1. Market Analysis, Insights and Forecast - by Component
- 6. North America Global Brachytherapy Treatment Planning Systems Market Analysis, Insights and Forecast, 2019-2031
- 6.1. Market Analysis, Insights and Forecast - by Component
- 6.1.1. Auto-Contouring Software
- 6.1.2. Multi-Modality Software
- 6.1.3. PET/CT Deformable Software
- 6.1.4. DICOM-RT Software
- 6.2. Market Analysis, Insights and Forecast - by Technique
- 6.2.1. 3D Image Reconstruction
- 6.2.2. In-Room Imaging
- 6.2.3. Image Registration using Graphics Processor Unit
- 6.1. Market Analysis, Insights and Forecast - by Component
- 7. Europe Global Brachytherapy Treatment Planning Systems Market Analysis, Insights and Forecast, 2019-2031
- 7.1. Market Analysis, Insights and Forecast - by Component
- 7.1.1. Auto-Contouring Software
- 7.1.2. Multi-Modality Software
- 7.1.3. PET/CT Deformable Software
- 7.1.4. DICOM-RT Software
- 7.2. Market Analysis, Insights and Forecast - by Technique
- 7.2.1. 3D Image Reconstruction
- 7.2.2. In-Room Imaging
- 7.2.3. Image Registration using Graphics Processor Unit
- 7.1. Market Analysis, Insights and Forecast - by Component
- 8. Asia Pacific Global Brachytherapy Treatment Planning Systems Market Analysis, Insights and Forecast, 2019-2031
- 8.1. Market Analysis, Insights and Forecast - by Component
- 8.1.1. Auto-Contouring Software
- 8.1.2. Multi-Modality Software
- 8.1.3. PET/CT Deformable Software
- 8.1.4. DICOM-RT Software
- 8.2. Market Analysis, Insights and Forecast - by Technique
- 8.2.1. 3D Image Reconstruction
- 8.2.2. In-Room Imaging
- 8.2.3. Image Registration using Graphics Processor Unit
- 8.1. Market Analysis, Insights and Forecast - by Component
- 9. Middle East and Africa Global Brachytherapy Treatment Planning Systems Market Analysis, Insights and Forecast, 2019-2031
- 9.1. Market Analysis, Insights and Forecast - by Component
- 9.1.1. Auto-Contouring Software
- 9.1.2. Multi-Modality Software
- 9.1.3. PET/CT Deformable Software
- 9.1.4. DICOM-RT Software
- 9.2. Market Analysis, Insights and Forecast - by Technique
- 9.2.1. 3D Image Reconstruction
- 9.2.2. In-Room Imaging
- 9.2.3. Image Registration using Graphics Processor Unit
- 9.1. Market Analysis, Insights and Forecast - by Component
- 10. South America Global Brachytherapy Treatment Planning Systems Market Analysis, Insights and Forecast, 2019-2031
- 10.1. Market Analysis, Insights and Forecast - by Component
- 10.1.1. Auto-Contouring Software
- 10.1.2. Multi-Modality Software
- 10.1.3. PET/CT Deformable Software
- 10.1.4. DICOM-RT Software
- 10.2. Market Analysis, Insights and Forecast - by Technique
- 10.2.1. 3D Image Reconstruction
- 10.2.2. In-Room Imaging
- 10.2.3. Image Registration using Graphics Processor Unit
- 10.1. Market Analysis, Insights and Forecast - by Component
- 11. North America Global Brachytherapy Treatment Planning Systems Market Analysis, Insights and Forecast, 2019-2031
- 11.1. Market Analysis, Insights and Forecast - By Country/Sub-region
- 11.1.1 United States
- 11.1.2 Canada
- 11.1.3 Mexico
- 12. Europe Global Brachytherapy Treatment Planning Systems Market Analysis, Insights and Forecast, 2019-2031
- 12.1. Market Analysis, Insights and Forecast - By Country/Sub-region
- 12.1.1 Germany
- 12.1.2 United Kingdom
- 12.1.3 France
- 12.1.4 Italy
- 12.1.5 Spain
- 12.1.6 Rest of Europe
- 13. Asia Pacific Global Brachytherapy Treatment Planning Systems Market Analysis, Insights and Forecast, 2019-2031
- 13.1. Market Analysis, Insights and Forecast - By Country/Sub-region
- 13.1.1 China
- 13.1.2 Japan
- 13.1.3 India
- 13.1.4 Australia
- 13.1.5 South Korea
- 13.1.6 Rest of Asia Pacific
- 14. Middle East and Africa Global Brachytherapy Treatment Planning Systems Market Analysis, Insights and Forecast, 2019-2031
- 14.1. Market Analysis, Insights and Forecast - By Country/Sub-region
- 14.1.1 GCC
- 14.1.2 South Africa
- 14.1.3 Rest of Middle East and Africa
- 15. South America Global Brachytherapy Treatment Planning Systems Market Analysis, Insights and Forecast, 2019-2031
- 15.1. Market Analysis, Insights and Forecast - By Country/Sub-region
- 15.1.1 Brazil
- 15.1.2 Argentina
- 15.1.3 Rest of South America
- 16. Competitive Analysis
- 16.1. Market Share Analysis 2024
- 16.2. Company Profiles
- 16.2.1 IsoAid
- 16.2.1.1. Overview
- 16.2.1.2. Products
- 16.2.1.3. SWOT Analysis
- 16.2.1.4. Recent Developments
- 16.2.1.5. Financials (Based on Availability)
- 16.2.2 ALCEN
- 16.2.2.1. Overview
- 16.2.2.2. Products
- 16.2.2.3. SWOT Analysis
- 16.2.2.4. Recent Developments
- 16.2.2.5. Financials (Based on Availability)
- 16.2.3 MIM Software
- 16.2.3.1. Overview
- 16.2.3.2. Products
- 16.2.3.3. SWOT Analysis
- 16.2.3.4. Recent Developments
- 16.2.3.5. Financials (Based on Availability)
- 16.2.4 Prowess Inc
- 16.2.4.1. Overview
- 16.2.4.2. Products
- 16.2.4.3. SWOT Analysis
- 16.2.4.4. Recent Developments
- 16.2.4.5. Financials (Based on Availability)
- 16.2.5 C4 Imaging
- 16.2.5.1. Overview
- 16.2.5.2. Products
- 16.2.5.3. SWOT Analysis
- 16.2.5.4. Recent Developments
- 16.2.5.5. Financials (Based on Availability)
- 16.2.6 Theragenics Corporation
- 16.2.6.1. Overview
- 16.2.6.2. Products
- 16.2.6.3. SWOT Analysis
- 16.2.6.4. Recent Developments
- 16.2.6.5. Financials (Based on Availability)
- 16.2.7 Elekta AB
- 16.2.7.1. Overview
- 16.2.7.2. Products
- 16.2.7.3. SWOT Analysis
- 16.2.7.4. Recent Developments
- 16.2.7.5. Financials (Based on Availability)
- 16.2.8 Varian Medical Systems
- 16.2.8.1. Overview
- 16.2.8.2. Products
- 16.2.8.3. SWOT Analysis
- 16.2.8.4. Recent Developments
- 16.2.8.5. Financials (Based on Availability)
- 16.2.9 RaySearch Laboratories
- 16.2.9.1. Overview
- 16.2.9.2. Products
- 16.2.9.3. SWOT Analysis
- 16.2.9.4. Recent Developments
- 16.2.9.5. Financials (Based on Availability)
- 16.2.10 Eckert & Ziegler BEBIG
- 16.2.10.1. Overview
- 16.2.10.2. Products
- 16.2.10.3. SWOT Analysis
- 16.2.10.4. Recent Developments
- 16.2.10.5. Financials (Based on Availability)
- 16.2.11 Concure Oncology
- 16.2.11.1. Overview
- 16.2.11.2. Products
- 16.2.11.3. SWOT Analysis
- 16.2.11.4. Recent Developments
- 16.2.11.5. Financials (Based on Availability)
- 16.2.12 Sensus Healthcare Inc
- 16.2.12.1. Overview
- 16.2.12.2. Products
- 16.2.12.3. SWOT Analysis
- 16.2.12.4. Recent Developments
- 16.2.12.5. Financials (Based on Availability)
- 16.2.13 IsoRay Inc
- 16.2.13.1. Overview
- 16.2.13.2. Products
- 16.2.13.3. SWOT Analysis
- 16.2.13.4. Recent Developments
- 16.2.13.5. Financials (Based on Availability)
- 16.2.1 IsoAid
List of Figures
- Figure 1: Global Global Brachytherapy Treatment Planning Systems Market Revenue Breakdown (Million, %) by Region 2024 & 2032
- Figure 2: North America Global Brachytherapy Treatment Planning Systems Market Revenue (Million), by Country 2024 & 2032
- Figure 3: North America Global Brachytherapy Treatment Planning Systems Market Revenue Share (%), by Country 2024 & 2032
- Figure 4: Europe Global Brachytherapy Treatment Planning Systems Market Revenue (Million), by Country 2024 & 2032
- Figure 5: Europe Global Brachytherapy Treatment Planning Systems Market Revenue Share (%), by Country 2024 & 2032
- Figure 6: Asia Pacific Global Brachytherapy Treatment Planning Systems Market Revenue (Million), by Country 2024 & 2032
- Figure 7: Asia Pacific Global Brachytherapy Treatment Planning Systems Market Revenue Share (%), by Country 2024 & 2032
- Figure 8: Middle East and Africa Global Brachytherapy Treatment Planning Systems Market Revenue (Million), by Country 2024 & 2032
- Figure 9: Middle East and Africa Global Brachytherapy Treatment Planning Systems Market Revenue Share (%), by Country 2024 & 2032
- Figure 10: South America Global Brachytherapy Treatment Planning Systems Market Revenue (Million), by Country 2024 & 2032
- Figure 11: South America Global Brachytherapy Treatment Planning Systems Market Revenue Share (%), by Country 2024 & 2032
- Figure 12: North America Global Brachytherapy Treatment Planning Systems Market Revenue (Million), by Component 2024 & 2032
- Figure 13: North America Global Brachytherapy Treatment Planning Systems Market Revenue Share (%), by Component 2024 & 2032
- Figure 14: North America Global Brachytherapy Treatment Planning Systems Market Revenue (Million), by Technique 2024 & 2032
- Figure 15: North America Global Brachytherapy Treatment Planning Systems Market Revenue Share (%), by Technique 2024 & 2032
- Figure 16: North America Global Brachytherapy Treatment Planning Systems Market Revenue (Million), by Country 2024 & 2032
- Figure 17: North America Global Brachytherapy Treatment Planning Systems Market Revenue Share (%), by Country 2024 & 2032
- Figure 18: Europe Global Brachytherapy Treatment Planning Systems Market Revenue (Million), by Component 2024 & 2032
- Figure 19: Europe Global Brachytherapy Treatment Planning Systems Market Revenue Share (%), by Component 2024 & 2032
- Figure 20: Europe Global Brachytherapy Treatment Planning Systems Market Revenue (Million), by Technique 2024 & 2032
- Figure 21: Europe Global Brachytherapy Treatment Planning Systems Market Revenue Share (%), by Technique 2024 & 2032
- Figure 22: Europe Global Brachytherapy Treatment Planning Systems Market Revenue (Million), by Country 2024 & 2032
- Figure 23: Europe Global Brachytherapy Treatment Planning Systems Market Revenue Share (%), by Country 2024 & 2032
- Figure 24: Asia Pacific Global Brachytherapy Treatment Planning Systems Market Revenue (Million), by Component 2024 & 2032
- Figure 25: Asia Pacific Global Brachytherapy Treatment Planning Systems Market Revenue Share (%), by Component 2024 & 2032
- Figure 26: Asia Pacific Global Brachytherapy Treatment Planning Systems Market Revenue (Million), by Technique 2024 & 2032
- Figure 27: Asia Pacific Global Brachytherapy Treatment Planning Systems Market Revenue Share (%), by Technique 2024 & 2032
- Figure 28: Asia Pacific Global Brachytherapy Treatment Planning Systems Market Revenue (Million), by Country 2024 & 2032
- Figure 29: Asia Pacific Global Brachytherapy Treatment Planning Systems Market Revenue Share (%), by Country 2024 & 2032
- Figure 30: Middle East and Africa Global Brachytherapy Treatment Planning Systems Market Revenue (Million), by Component 2024 & 2032
- Figure 31: Middle East and Africa Global Brachytherapy Treatment Planning Systems Market Revenue Share (%), by Component 2024 & 2032
- Figure 32: Middle East and Africa Global Brachytherapy Treatment Planning Systems Market Revenue (Million), by Technique 2024 & 2032
- Figure 33: Middle East and Africa Global Brachytherapy Treatment Planning Systems Market Revenue Share (%), by Technique 2024 & 2032
- Figure 34: Middle East and Africa Global Brachytherapy Treatment Planning Systems Market Revenue (Million), by Country 2024 & 2032
- Figure 35: Middle East and Africa Global Brachytherapy Treatment Planning Systems Market Revenue Share (%), by Country 2024 & 2032
- Figure 36: South America Global Brachytherapy Treatment Planning Systems Market Revenue (Million), by Component 2024 & 2032
- Figure 37: South America Global Brachytherapy Treatment Planning Systems Market Revenue Share (%), by Component 2024 & 2032
- Figure 38: South America Global Brachytherapy Treatment Planning Systems Market Revenue (Million), by Technique 2024 & 2032
- Figure 39: South America Global Brachytherapy Treatment Planning Systems Market Revenue Share (%), by Technique 2024 & 2032
- Figure 40: South America Global Brachytherapy Treatment Planning Systems Market Revenue (Million), by Country 2024 & 2032
- Figure 41: South America Global Brachytherapy Treatment Planning Systems Market Revenue Share (%), by Country 2024 & 2032
List of Tables
- Table 1: Global Brachytherapy Treatment Planning Systems Market Revenue Million Forecast, by Region 2019 & 2032
- Table 2: Global Brachytherapy Treatment Planning Systems Market Revenue Million Forecast, by Component 2019 & 2032
- Table 3: Global Brachytherapy Treatment Planning Systems Market Revenue Million Forecast, by Technique 2019 & 2032
- Table 4: Global Brachytherapy Treatment Planning Systems Market Revenue Million Forecast, by Region 2019 & 2032
- Table 5: Global Brachytherapy Treatment Planning Systems Market Revenue Million Forecast, by Country 2019 & 2032
- Table 6: United States Global Brachytherapy Treatment Planning Systems Market Revenue (Million) Forecast, by Application 2019 & 2032
- Table 7: Canada Global Brachytherapy Treatment Planning Systems Market Revenue (Million) Forecast, by Application 2019 & 2032
- Table 8: Mexico Global Brachytherapy Treatment Planning Systems Market Revenue (Million) Forecast, by Application 2019 & 2032
- Table 9: Global Brachytherapy Treatment Planning Systems Market Revenue Million Forecast, by Country 2019 & 2032
- Table 10: Germany Global Brachytherapy Treatment Planning Systems Market Revenue (Million) Forecast, by Application 2019 & 2032
- Table 11: United Kingdom Global Brachytherapy Treatment Planning Systems Market Revenue (Million) Forecast, by Application 2019 & 2032
- Table 12: France Global Brachytherapy Treatment Planning Systems Market Revenue (Million) Forecast, by Application 2019 & 2032
- Table 13: Italy Global Brachytherapy Treatment Planning Systems Market Revenue (Million) Forecast, by Application 2019 & 2032
- Table 14: Spain Global Brachytherapy Treatment Planning Systems Market Revenue (Million) Forecast, by Application 2019 & 2032
- Table 15: Rest of Europe Global Brachytherapy Treatment Planning Systems Market Revenue (Million) Forecast, by Application 2019 & 2032
- Table 16: Global Brachytherapy Treatment Planning Systems Market Revenue Million Forecast, by Country 2019 & 2032
- Table 17: China Global Brachytherapy Treatment Planning Systems Market Revenue (Million) Forecast, by Application 2019 & 2032
- Table 18: Japan Global Brachytherapy Treatment Planning Systems Market Revenue (Million) Forecast, by Application 2019 & 2032
- Table 19: India Global Brachytherapy Treatment Planning Systems Market Revenue (Million) Forecast, by Application 2019 & 2032
- Table 20: Australia Global Brachytherapy Treatment Planning Systems Market Revenue (Million) Forecast, by Application 2019 & 2032
- Table 21: South Korea Global Brachytherapy Treatment Planning Systems Market Revenue (Million) Forecast, by Application 2019 & 2032
- Table 22: Rest of Asia Pacific Global Brachytherapy Treatment Planning Systems Market Revenue (Million) Forecast, by Application 2019 & 2032
- Table 23: Global Brachytherapy Treatment Planning Systems Market Revenue Million Forecast, by Country 2019 & 2032
- Table 24: GCC Global Brachytherapy Treatment Planning Systems Market Revenue (Million) Forecast, by Application 2019 & 2032
- Table 25: South Africa Global Brachytherapy Treatment Planning Systems Market Revenue (Million) Forecast, by Application 2019 & 2032
- Table 26: Rest of Middle East and Africa Global Brachytherapy Treatment Planning Systems Market Revenue (Million) Forecast, by Application 2019 & 2032
- Table 27: Global Brachytherapy Treatment Planning Systems Market Revenue Million Forecast, by Country 2019 & 2032
- Table 28: Brazil Global Brachytherapy Treatment Planning Systems Market Revenue (Million) Forecast, by Application 2019 & 2032
- Table 29: Argentina Global Brachytherapy Treatment Planning Systems Market Revenue (Million) Forecast, by Application 2019 & 2032
- Table 30: Rest of South America Global Brachytherapy Treatment Planning Systems Market Revenue (Million) Forecast, by Application 2019 & 2032
- Table 31: Global Brachytherapy Treatment Planning Systems Market Revenue Million Forecast, by Component 2019 & 2032
- Table 32: Global Brachytherapy Treatment Planning Systems Market Revenue Million Forecast, by Technique 2019 & 2032
- Table 33: Global Brachytherapy Treatment Planning Systems Market Revenue Million Forecast, by Country 2019 & 2032
- Table 34: United States Global Brachytherapy Treatment Planning Systems Market Revenue (Million) Forecast, by Application 2019 & 2032
- Table 35: Canada Global Brachytherapy Treatment Planning Systems Market Revenue (Million) Forecast, by Application 2019 & 2032
- Table 36: Mexico Global Brachytherapy Treatment Planning Systems Market Revenue (Million) Forecast, by Application 2019 & 2032
- Table 37: Global Brachytherapy Treatment Planning Systems Market Revenue Million Forecast, by Component 2019 & 2032
- Table 38: Global Brachytherapy Treatment Planning Systems Market Revenue Million Forecast, by Technique 2019 & 2032
- Table 39: Global Brachytherapy Treatment Planning Systems Market Revenue Million Forecast, by Country 2019 & 2032
- Table 40: Germany Global Brachytherapy Treatment Planning Systems Market Revenue (Million) Forecast, by Application 2019 & 2032
- Table 41: United Kingdom Global Brachytherapy Treatment Planning Systems Market Revenue (Million) Forecast, by Application 2019 & 2032
- Table 42: France Global Brachytherapy Treatment Planning Systems Market Revenue (Million) Forecast, by Application 2019 & 2032
- Table 43: Italy Global Brachytherapy Treatment Planning Systems Market Revenue (Million) Forecast, by Application 2019 & 2032
- Table 44: Spain Global Brachytherapy Treatment Planning Systems Market Revenue (Million) Forecast, by Application 2019 & 2032
- Table 45: Rest of Europe Global Brachytherapy Treatment Planning Systems Market Revenue (Million) Forecast, by Application 2019 & 2032
- Table 46: Global Brachytherapy Treatment Planning Systems Market Revenue Million Forecast, by Component 2019 & 2032
- Table 47: Global Brachytherapy Treatment Planning Systems Market Revenue Million Forecast, by Technique 2019 & 2032
- Table 48: Global Brachytherapy Treatment Planning Systems Market Revenue Million Forecast, by Country 2019 & 2032
- Table 49: China Global Brachytherapy Treatment Planning Systems Market Revenue (Million) Forecast, by Application 2019 & 2032
- Table 50: Japan Global Brachytherapy Treatment Planning Systems Market Revenue (Million) Forecast, by Application 2019 & 2032
- Table 51: India Global Brachytherapy Treatment Planning Systems Market Revenue (Million) Forecast, by Application 2019 & 2032
- Table 52: Australia Global Brachytherapy Treatment Planning Systems Market Revenue (Million) Forecast, by Application 2019 & 2032
- Table 53: South Korea Global Brachytherapy Treatment Planning Systems Market Revenue (Million) Forecast, by Application 2019 & 2032
- Table 54: Rest of Asia Pacific Global Brachytherapy Treatment Planning Systems Market Revenue (Million) Forecast, by Application 2019 & 2032
- Table 55: Global Brachytherapy Treatment Planning Systems Market Revenue Million Forecast, by Component 2019 & 2032
- Table 56: Global Brachytherapy Treatment Planning Systems Market Revenue Million Forecast, by Technique 2019 & 2032
- Table 57: Global Brachytherapy Treatment Planning Systems Market Revenue Million Forecast, by Country 2019 & 2032
- Table 58: GCC Global Brachytherapy Treatment Planning Systems Market Revenue (Million) Forecast, by Application 2019 & 2032
- Table 59: South Africa Global Brachytherapy Treatment Planning Systems Market Revenue (Million) Forecast, by Application 2019 & 2032
- Table 60: Rest of Middle East and Africa Global Brachytherapy Treatment Planning Systems Market Revenue (Million) Forecast, by Application 2019 & 2032
- Table 61: Global Brachytherapy Treatment Planning Systems Market Revenue Million Forecast, by Component 2019 & 2032
- Table 62: Global Brachytherapy Treatment Planning Systems Market Revenue Million Forecast, by Technique 2019 & 2032
- Table 63: Global Brachytherapy Treatment Planning Systems Market Revenue Million Forecast, by Country 2019 & 2032
- Table 64: Brazil Global Brachytherapy Treatment Planning Systems Market Revenue (Million) Forecast, by Application 2019 & 2032
- Table 65: Argentina Global Brachytherapy Treatment Planning Systems Market Revenue (Million) Forecast, by Application 2019 & 2032
- Table 66: Rest of South America Global Brachytherapy Treatment Planning Systems Market Revenue (Million) Forecast, by Application 2019 & 2032
Frequently Asked Questions
1. What is the projected Compound Annual Growth Rate (CAGR) of the Global Brachytherapy Treatment Planning Systems Market?
The projected CAGR is approximately 9.30%.
2. Which companies are prominent players in the Global Brachytherapy Treatment Planning Systems Market?
Key companies in the market include IsoAid, ALCEN, MIM Software, Prowess Inc, C4 Imaging, Theragenics Corporation, Elekta AB, Varian Medical Systems, RaySearch Laboratories, Eckert & Ziegler BEBIG, Concure Oncology, Sensus Healthcare Inc, IsoRay Inc.
3. What are the main segments of the Global Brachytherapy Treatment Planning Systems Market?
The market segments include Component, Technique.
4. Can you provide details about the market size?
The market size is estimated to be USD XX Million as of 2022.
5. What are some drivers contributing to market growth?
Increasing Investments And Strategic Initiatives In Radiation Therapy and Rising Adoption Of Ai/Ml-c in Oncology Software; Increasing Prevalence Of Cancer; Increasing Healthcare IT Expenditure.
6. What are the notable trends driving market growth?
The Auto-Contouring Software Segment is Expected to Witness Growth Over the Forecast Period.
7. Are there any restraints impacting market growth?
Shortage Of Healthcare Personnel In Information Technology And Radiology Sector; Cybersecurity And Privacy Concerns.
8. Can you provide examples of recent developments in the market?
In July 2022, RaySearch Laboratories AB launched of RayStation 12A, the latest version of the company's advanced treatment planning system. Version 12A includes innovative new features in addition to several general enhancements.
9. What pricing options are available for accessing the report?
Pricing options include single-user, multi-user, and enterprise licenses priced at USD 4750, USD 5250, and USD 8750 respectively.
10. Is the market size provided in terms of value or volume?
The market size is provided in terms of value, measured in Million.
11. Are there any specific market keywords associated with the report?
Yes, the market keyword associated with the report is "Global Brachytherapy Treatment Planning Systems Market," which aids in identifying and referencing the specific market segment covered.
12. How do I determine which pricing option suits my needs best?
The pricing options vary based on user requirements and access needs. Individual users may opt for single-user licenses, while businesses requiring broader access may choose multi-user or enterprise licenses for cost-effective access to the report.
13. Are there any additional resources or data provided in the Global Brachytherapy Treatment Planning Systems Market report?
While the report offers comprehensive insights, it's advisable to review the specific contents or supplementary materials provided to ascertain if additional resources or data are available.
14. How can I stay updated on further developments or reports in the Global Brachytherapy Treatment Planning Systems Market?
To stay informed about further developments, trends, and reports in the Global Brachytherapy Treatment Planning Systems Market, consider subscribing to industry newsletters, following relevant companies and organizations, or regularly checking reputable industry news sources and publications.
Methodology
Step 1 - Identification of Relevant Samples Size from Population Database


Step 2 - Approaches for Defining Global Market Size (Value, Volume* & Price*)

Note*: In applicable scenarios
Step 3 - Data Sources
Primary Research
- Web Analytics
- Survey Reports
- Research Institute
- Latest Research Reports
- Opinion Leaders
Secondary Research
- Annual Reports
- White Paper
- Latest Press Release
- Industry Association
- Paid Database
- Investor Presentations

Step 4 - Data Triangulation
Involves using different sources of information in order to increase the validity of a study
These sources are likely to be stakeholders in a program - participants, other researchers, program staff, other community members, and so on.
Then we put all data in single framework & apply various statistical tools to find out the dynamic on the market.
During the analysis stage, feedback from the stakeholder groups would be compared to determine areas of agreement as well as areas of divergence


