
Key Insights
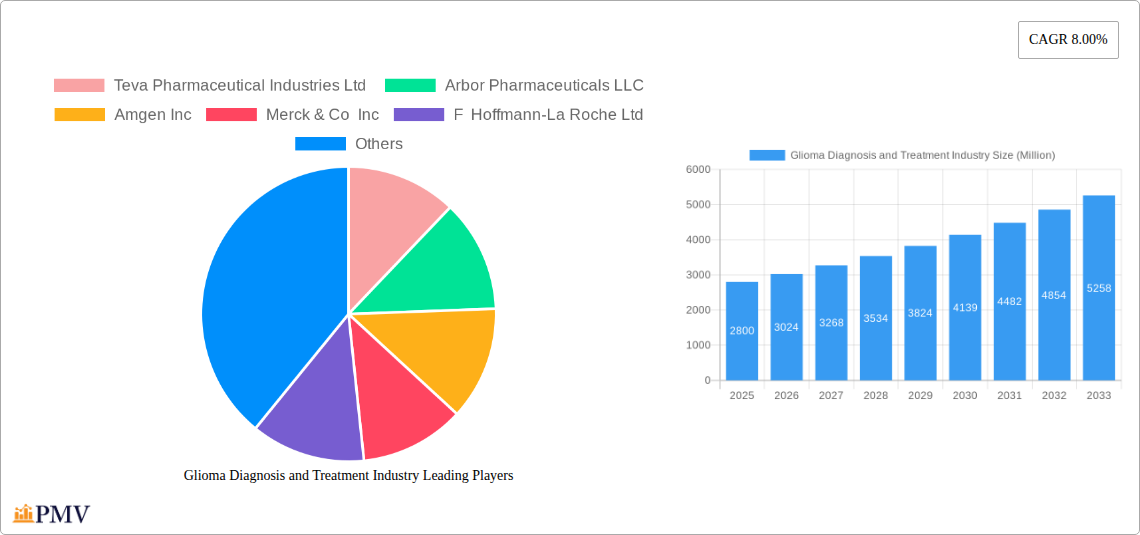
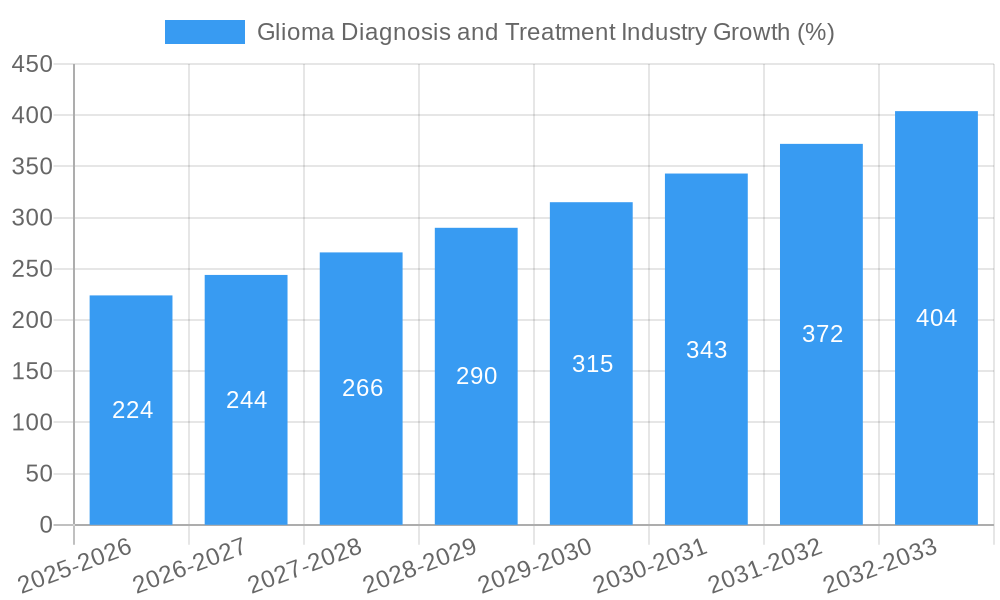
The global glioma diagnosis and treatment market, valued at $2.80 billion in 2025, is projected to experience robust growth, driven by increasing prevalence of gliomas, advancements in diagnostic techniques like advanced imaging (MRI, PET scans) and molecular profiling, and the development of novel targeted therapies. The market's Compound Annual Growth Rate (CAGR) of 8% from 2025 to 2033 indicates substantial expansion. Key drivers include the rising geriatric population (increasing susceptibility to gliomas), improved healthcare infrastructure in developing economies, and ongoing research leading to more effective treatments, including immunotherapy and gene therapy. While the high cost of treatment and potential side effects of chemotherapy and radiation therapy pose challenges, the market is witnessing a shift towards personalized medicine, leveraging genomic data to tailor treatment plans and enhance efficacy. The segment encompassing advanced imaging and molecular diagnostics is expected to witness particularly strong growth, reflecting the increased focus on early detection and precise treatment strategies. The diverse range of treatment options, including chemotherapy (e.g., temozolomide), radiation therapy, targeted therapies (e.g., bevacizumab), and surgery, contributes to the market's complexity and growth potential. Hospitals and clinics remain the dominant end-users, but the ambulatory surgical centers segment is poised for growth due to increasing preference for minimally invasive procedures and cost-effectiveness. Major pharmaceutical companies like Teva, Amgen, Merck, Roche, and Pfizer are key players, constantly innovating and expanding their treatment portfolios.
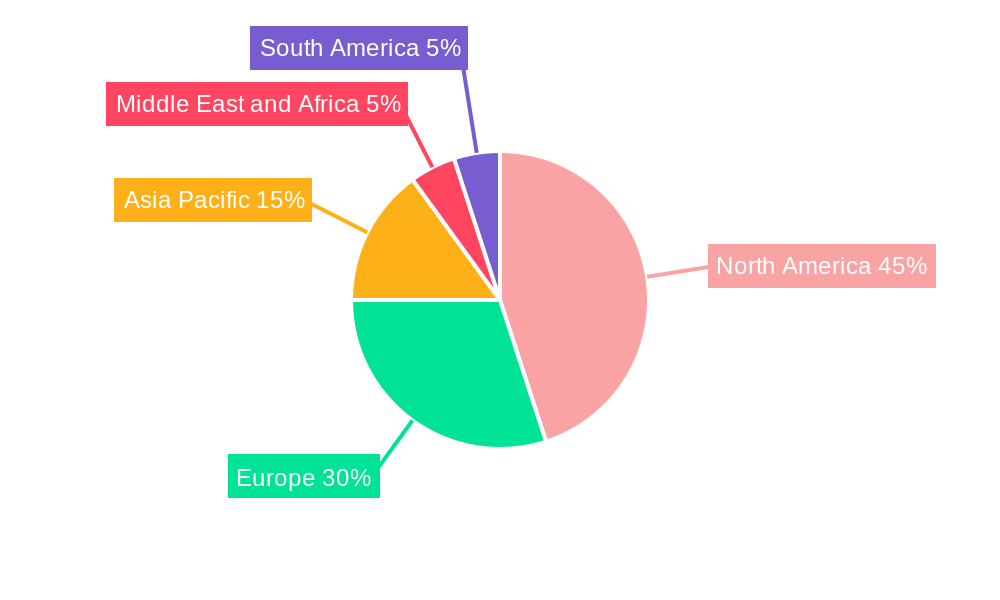
Geographic variations exist, with North America and Europe currently commanding the largest market shares owing to established healthcare systems and higher diagnostic rates. However, Asia Pacific is expected to exhibit the fastest growth due to increasing awareness, rising disposable incomes, and expanding healthcare infrastructure. The forecast period (2025-2033) is likely to witness significant market expansion driven by ongoing research and development, regulatory approvals of novel therapies, and growing demand for personalized and effective glioma treatment strategies. This growth will be further fueled by collaborations between pharmaceutical companies, research institutions, and healthcare providers focused on improving glioma diagnosis and treatment outcomes.
Glioma Diagnosis and Treatment Industry: A Comprehensive Market Report (2019-2033)
This in-depth report provides a comprehensive analysis of the global Glioma Diagnosis and Treatment industry, encompassing market size, segmentation, competitive landscape, and future growth prospects. The study period covers 2019-2033, with 2025 as the base and estimated year. The report offers actionable insights for stakeholders, including pharmaceutical companies, healthcare providers, and investors. The total market size in 2025 is estimated at $XX Million.
Glioma Diagnosis and Treatment Industry Market Structure & Competitive Dynamics
The Glioma Diagnosis and Treatment market is characterized by a moderately concentrated structure, with a few large multinational pharmaceutical companies holding significant market share. Key players like Teva Pharmaceutical Industries Ltd, Arbor Pharmaceuticals LLC, Amgen Inc, Merck & Co Inc, F Hoffmann-La Roche Ltd, Eli Lilly and Company, Sun Pharmaceutical Industries Ltd, Lanthen Pharmaceutical, Bristol-Myers Squibb Company, and Pfizer Inc dominate the landscape. Market share distribution is dynamic, influenced by new drug approvals, clinical trial outcomes, and mergers and acquisitions (M&A) activities.
Innovation plays a crucial role, with companies investing heavily in research and development of novel therapies, including targeted therapies and immunotherapies. Regulatory frameworks, particularly those governing drug approvals, significantly impact market entry and growth. The market faces competitive pressure from the emergence of biosimilars and generic drugs. End-user trends, such as a growing preference for personalized medicine and outpatient care settings, also shape market dynamics.
M&A activity is relatively frequent, with deal values ranging from $XX Million to $XX Million in recent years, driven by companies seeking to expand their portfolios and gain access to new technologies. For example, the acquisition of [Company Name] by [Acquiring Company] in [Year] resulted in a [Percentage]% increase in the acquiring company's market share. The increasing prevalence of gliomas and advancements in treatment modalities are fueling robust growth within this competitive yet dynamic market.
Glioma Diagnosis and Treatment Industry Industry Trends & Insights
The Glioma Diagnosis and Treatment market is experiencing significant growth, driven by factors including the rising incidence of gliomas, advancements in diagnostic techniques, and the development of novel therapies. The market is expected to exhibit a Compound Annual Growth Rate (CAGR) of XX% during the forecast period (2025-2033). Technological advancements such as liquid biopsies and improved imaging techniques are enhancing early detection and diagnosis.
The increasing adoption of targeted therapies and immunotherapies, offering improved efficacy and reduced side effects compared to traditional chemotherapy, is further driving market growth. The market penetration of these novel therapies is steadily increasing, but cost remains a significant barrier in less developed regions. Consumer preferences are shifting towards less invasive treatment options and personalized medicine approaches. The competitive landscape is dynamic, with companies constantly striving to differentiate their products and services through clinical trial success and strategic partnerships.
The market is also witnessing increased focus on personalized medicine, with ongoing research to identify genetic biomarkers for more precise treatment strategies. This is contributing to a rise in the demand for advanced diagnostic tests and targeted therapies. Furthermore, the increasing prevalence of aging populations globally is contributing to a higher incidence of gliomas, further fueling market expansion.
Dominant Markets & Segments in Glioma Diagnosis and Treatment Industry
The North American region dominates the Glioma Diagnosis and Treatment market, driven by factors including high healthcare expenditure, advanced healthcare infrastructure, and a relatively high incidence of gliomas. Within North America, the United States holds the largest market share.
- Key Drivers in North America:
- High healthcare expenditure per capita
- Well-established healthcare infrastructure
- High incidence of gliomas
- Robust clinical trial infrastructure
- Favorable regulatory environment
Segment Dominance:
Chemotherapy remains the dominant treatment segment due to its widespread availability and relatively lower cost compared to other therapies. However, the radiation therapy segment is experiencing robust growth due to advancements in radiation delivery techniques, such as proton beam therapy, leading to improved outcomes and reduced side effects. The "Other Treatments" segment encompasses novel therapies such as targeted therapies and immunotherapies, which are gaining traction due to increased efficacy and improved patient outcomes. Hospitals/Clinics account for a larger share of the end-user segment due to the complex nature of glioma treatment requiring specialized infrastructure and expertise. Ambulatory Surgical Centers are gradually gaining significance due to their cost-effectiveness and convenience for certain procedures.
The market is also segmented by glioma type (glioblastoma, astrocytoma, oligodendroglioma, etc.), and the distribution of market share among the segments varies depending on several factors, including the specific type and aggressiveness of the tumor.
Glioma Diagnosis and Treatment Industry Product Innovations
Recent product innovations focus on targeted therapies, immunotherapies, and advanced diagnostic tools. Targeted therapies aim to selectively eliminate cancer cells while minimizing damage to healthy tissues. Immunotherapies harness the body's immune system to fight cancer cells. Advanced diagnostic techniques, such as liquid biopsies, enable early detection and facilitate personalized treatment strategies. The market is witnessing increased adoption of minimally invasive surgical techniques, enhancing patient outcomes and reducing recovery times. These innovations are driving market growth by providing more effective and less toxic treatment options.
Report Segmentation & Scope
The report segments the market by treatment type (Chemotherapy, Radiation Therapy, Other Treatments), end-user (Hospitals/Clinics, Ambulatory Surgical Centers), and geography. Each segment is analyzed based on market size, growth projections, and competitive dynamics. The Chemotherapy segment is projected to exhibit a CAGR of XX% during the forecast period, while the Radiation Therapy segment is expected to experience a CAGR of XX%. The “Other Treatments” segment, encompassing novel therapies, is predicted to have the highest growth rate of XX%. The Hospitals/Clinics segment dominates the end-user market due to the complexity of glioma treatment. The Ambulatory Surgical Centers segment is witnessing increasing growth, driven by cost-effectiveness and patient convenience.
Key Drivers of Glioma Diagnosis and Treatment Industry Growth
Several factors drive the growth of the Glioma Diagnosis and Treatment market. Technological advancements, such as the development of targeted therapies and immunotherapies, offer more effective and less toxic treatment options, improving patient outcomes. Increased government funding for cancer research and clinical trials fuels innovation and accelerates the development of new therapies. The rising prevalence of gliomas globally, driven by factors such as an aging population and environmental factors, boosts market demand. Favorable regulatory frameworks streamlining drug approvals and reimbursement policies facilitate market expansion. Finally, rising healthcare expenditure in developed countries provides greater access to advanced treatment options.
Challenges in the Glioma Diagnosis and Treatment Industry Sector
The Glioma Diagnosis and Treatment industry faces several challenges. High treatment costs for novel therapies limit accessibility, particularly in emerging markets. The development of drug resistance remains a significant obstacle, requiring continuous research and innovation. Regulatory hurdles and lengthy clinical trial processes slow down the introduction of new drugs. Supply chain disruptions can impact the availability of essential medications and diagnostic tools. Intense competition among pharmaceutical companies for market share poses challenges for profitability and growth. These factors impact market expansion and affect the overall treatment outcomes for glioma patients.
Leading Players in the Glioma Diagnosis and Treatment Industry Market
- Teva Pharmaceutical Industries Ltd
- Arbor Pharmaceuticals LLC
- Amgen Inc
- Merck & Co Inc
- F Hoffmann-La Roche Ltd
- Eli Lilly and Company
- Sun Pharmaceutical Industries Ltd
- Lanthen Pharmaceutical
- Bristol-Myers Squibb Company
- Pfizer Inc
Key Developments in Glioma Diagnosis and Treatment Industry Sector
June 2023: Chimeric Therapeutics initiated a Phase 1B clinical trial for CHM 1101, a novel CLTX CAR T cell therapy for recurrent/progressive glioblastoma multiforme (GBM). This development signifies advancements in immunotherapy for GBM.
August 2022: Northwest Biotherapeutics received MHRA approval for its Pediatric Investigation Plan (PIP) for DCVax-L, a crucial step towards securing adult patient approvals. This illustrates the ongoing regulatory progress for novel treatments.
Strategic Glioma Diagnosis and Treatment Industry Market Outlook
The Glioma Diagnosis and Treatment market presents significant growth potential driven by the increasing prevalence of gliomas, continued technological advancements, and the introduction of innovative therapies. Strategic opportunities exist in personalized medicine, leveraging genomic data for targeted treatment, and expanding access to affordable and effective treatments in emerging markets. Partnerships between pharmaceutical companies, research institutions, and healthcare providers can accelerate the development and implementation of innovative treatment strategies. Focusing on early detection and diagnosis through advancements in imaging and diagnostic tools presents another area for growth. Furthermore, continued investment in clinical trials and research will be crucial for driving the development of more effective treatment options.
Glioma Diagnosis and Treatment Industry Segmentation
-
1. Treatment
-
1.1. Chemotherapy
- 1.1.1. Temozolomide
- 1.1.2. Bevacizumab
- 1.1.3. Carmustine
- 1.1.4. Other Types of Chemotherapy
- 1.2. Radiation Therapy
- 1.3. Other Treatments
-
1.1. Chemotherapy
-
2. End -User
- 2.1. Hospitals/Clinics
- 2.2. Ambulatory Surgical Centers
Glioma Diagnosis and Treatment Industry Segmentation By Geography
-
1. North America
- 1.1. United States
- 1.2. Canada
- 1.3. Mexico
-
2. Europe
- 2.1. Germany
- 2.2. United Kingdom
- 2.3. France
- 2.4. Italy
- 2.5. Spain
- 2.6. Rest of Europe
-
3. Asia Pacific
- 3.1. China
- 3.2. Japan
- 3.3. India
- 3.4. Australia
- 3.5. South Korea
- 3.6. Rest of Asia Pacific
-
4. Middle East and Africa
- 4.1. GCC
- 4.2. South Africa
- 4.3. Rest of Middle East and Africa
-
5. South America
- 5.1. Brazil
- 5.2. Argentina
- 5.3. Rest of South America
Glioma Diagnosis and Treatment Industry REPORT HIGHLIGHTS
| Aspects | Details |
|---|---|
| Study Period | 2019-2033 |
| Base Year | 2024 |
| Estimated Year | 2025 |
| Forecast Period | 2025-2033 |
| Historical Period | 2019-2024 |
| Growth Rate | CAGR of 8.00% from 2019-2033 |
| Segmentation |
|
Table of Contents
- 1. Introduction
- 1.1. Research Scope
- 1.2. Market Segmentation
- 1.3. Research Methodology
- 1.4. Definitions and Assumptions
- 2. Executive Summary
- 2.1. Introduction
- 3. Market Dynamics
- 3.1. Introduction
- 3.2. Market Drivers
- 3.2.1. Increasing Prevalence of Brain Disorders; Strong R&D Initiatives from Key Players; Increasing Aging Population
- 3.3. Market Restrains
- 3.3.1. Reimbursement Issues and Stringent Regulatory Guidelines; High Cost and Side Effects Associated with Therapies
- 3.4. Market Trends
- 3.4.1. Chemotherapy Segment is Expected to Dominate the Market Over the Forecast Period
- 4. Market Factor Analysis
- 4.1. Porters Five Forces
- 4.2. Supply/Value Chain
- 4.3. PESTEL analysis
- 4.4. Market Entropy
- 4.5. Patent/Trademark Analysis
- 5. Global Glioma Diagnosis and Treatment Industry Analysis, Insights and Forecast, 2019-2031
- 5.1. Market Analysis, Insights and Forecast - by Treatment
- 5.1.1. Chemotherapy
- 5.1.1.1. Temozolomide
- 5.1.1.2. Bevacizumab
- 5.1.1.3. Carmustine
- 5.1.1.4. Other Types of Chemotherapy
- 5.1.2. Radiation Therapy
- 5.1.3. Other Treatments
- 5.1.1. Chemotherapy
- 5.2. Market Analysis, Insights and Forecast - by End -User
- 5.2.1. Hospitals/Clinics
- 5.2.2. Ambulatory Surgical Centers
- 5.3. Market Analysis, Insights and Forecast - by Region
- 5.3.1. North America
- 5.3.2. Europe
- 5.3.3. Asia Pacific
- 5.3.4. Middle East and Africa
- 5.3.5. South America
- 5.1. Market Analysis, Insights and Forecast - by Treatment
- 6. North America Glioma Diagnosis and Treatment Industry Analysis, Insights and Forecast, 2019-2031
- 6.1. Market Analysis, Insights and Forecast - by Treatment
- 6.1.1. Chemotherapy
- 6.1.1.1. Temozolomide
- 6.1.1.2. Bevacizumab
- 6.1.1.3. Carmustine
- 6.1.1.4. Other Types of Chemotherapy
- 6.1.2. Radiation Therapy
- 6.1.3. Other Treatments
- 6.1.1. Chemotherapy
- 6.2. Market Analysis, Insights and Forecast - by End -User
- 6.2.1. Hospitals/Clinics
- 6.2.2. Ambulatory Surgical Centers
- 6.1. Market Analysis, Insights and Forecast - by Treatment
- 7. Europe Glioma Diagnosis and Treatment Industry Analysis, Insights and Forecast, 2019-2031
- 7.1. Market Analysis, Insights and Forecast - by Treatment
- 7.1.1. Chemotherapy
- 7.1.1.1. Temozolomide
- 7.1.1.2. Bevacizumab
- 7.1.1.3. Carmustine
- 7.1.1.4. Other Types of Chemotherapy
- 7.1.2. Radiation Therapy
- 7.1.3. Other Treatments
- 7.1.1. Chemotherapy
- 7.2. Market Analysis, Insights and Forecast - by End -User
- 7.2.1. Hospitals/Clinics
- 7.2.2. Ambulatory Surgical Centers
- 7.1. Market Analysis, Insights and Forecast - by Treatment
- 8. Asia Pacific Glioma Diagnosis and Treatment Industry Analysis, Insights and Forecast, 2019-2031
- 8.1. Market Analysis, Insights and Forecast - by Treatment
- 8.1.1. Chemotherapy
- 8.1.1.1. Temozolomide
- 8.1.1.2. Bevacizumab
- 8.1.1.3. Carmustine
- 8.1.1.4. Other Types of Chemotherapy
- 8.1.2. Radiation Therapy
- 8.1.3. Other Treatments
- 8.1.1. Chemotherapy
- 8.2. Market Analysis, Insights and Forecast - by End -User
- 8.2.1. Hospitals/Clinics
- 8.2.2. Ambulatory Surgical Centers
- 8.1. Market Analysis, Insights and Forecast - by Treatment
- 9. Middle East and Africa Glioma Diagnosis and Treatment Industry Analysis, Insights and Forecast, 2019-2031
- 9.1. Market Analysis, Insights and Forecast - by Treatment
- 9.1.1. Chemotherapy
- 9.1.1.1. Temozolomide
- 9.1.1.2. Bevacizumab
- 9.1.1.3. Carmustine
- 9.1.1.4. Other Types of Chemotherapy
- 9.1.2. Radiation Therapy
- 9.1.3. Other Treatments
- 9.1.1. Chemotherapy
- 9.2. Market Analysis, Insights and Forecast - by End -User
- 9.2.1. Hospitals/Clinics
- 9.2.2. Ambulatory Surgical Centers
- 9.1. Market Analysis, Insights and Forecast - by Treatment
- 10. South America Glioma Diagnosis and Treatment Industry Analysis, Insights and Forecast, 2019-2031
- 10.1. Market Analysis, Insights and Forecast - by Treatment
- 10.1.1. Chemotherapy
- 10.1.1.1. Temozolomide
- 10.1.1.2. Bevacizumab
- 10.1.1.3. Carmustine
- 10.1.1.4. Other Types of Chemotherapy
- 10.1.2. Radiation Therapy
- 10.1.3. Other Treatments
- 10.1.1. Chemotherapy
- 10.2. Market Analysis, Insights and Forecast - by End -User
- 10.2.1. Hospitals/Clinics
- 10.2.2. Ambulatory Surgical Centers
- 10.1. Market Analysis, Insights and Forecast - by Treatment
- 11. North America Glioma Diagnosis and Treatment Industry Analysis, Insights and Forecast, 2019-2031
- 11.1. Market Analysis, Insights and Forecast - By Country/Sub-region
- 11.1.1 United States
- 11.1.2 Canada
- 11.1.3 Mexico
- 12. Europe Glioma Diagnosis and Treatment Industry Analysis, Insights and Forecast, 2019-2031
- 12.1. Market Analysis, Insights and Forecast - By Country/Sub-region
- 12.1.1 Germany
- 12.1.2 United Kingdom
- 12.1.3 France
- 12.1.4 Italy
- 12.1.5 Spain
- 12.1.6 Rest of Europe
- 13. Asia Pacific Glioma Diagnosis and Treatment Industry Analysis, Insights and Forecast, 2019-2031
- 13.1. Market Analysis, Insights and Forecast - By Country/Sub-region
- 13.1.1 China
- 13.1.2 Japan
- 13.1.3 India
- 13.1.4 Australia
- 13.1.5 South Korea
- 13.1.6 Rest of Asia Pacific
- 14. Middle East and Africa Glioma Diagnosis and Treatment Industry Analysis, Insights and Forecast, 2019-2031
- 14.1. Market Analysis, Insights and Forecast - By Country/Sub-region
- 14.1.1 GCC
- 14.1.2 South Africa
- 14.1.3 Rest of Middle East and Africa
- 15. South America Glioma Diagnosis and Treatment Industry Analysis, Insights and Forecast, 2019-2031
- 15.1. Market Analysis, Insights and Forecast - By Country/Sub-region
- 15.1.1 Brazil
- 15.1.2 Argentina
- 15.1.3 Rest of South America
- 16. Competitive Analysis
- 16.1. Global Market Share Analysis 2024
- 16.2. Company Profiles
- 16.2.1 Teva Pharmaceutical Industries Ltd
- 16.2.1.1. Overview
- 16.2.1.2. Products
- 16.2.1.3. SWOT Analysis
- 16.2.1.4. Recent Developments
- 16.2.1.5. Financials (Based on Availability)
- 16.2.2 Arbor Pharmaceuticals LLC
- 16.2.2.1. Overview
- 16.2.2.2. Products
- 16.2.2.3. SWOT Analysis
- 16.2.2.4. Recent Developments
- 16.2.2.5. Financials (Based on Availability)
- 16.2.3 Amgen Inc
- 16.2.3.1. Overview
- 16.2.3.2. Products
- 16.2.3.3. SWOT Analysis
- 16.2.3.4. Recent Developments
- 16.2.3.5. Financials (Based on Availability)
- 16.2.4 Merck & Co Inc
- 16.2.4.1. Overview
- 16.2.4.2. Products
- 16.2.4.3. SWOT Analysis
- 16.2.4.4. Recent Developments
- 16.2.4.5. Financials (Based on Availability)
- 16.2.5 F Hoffmann-La Roche Ltd
- 16.2.5.1. Overview
- 16.2.5.2. Products
- 16.2.5.3. SWOT Analysis
- 16.2.5.4. Recent Developments
- 16.2.5.5. Financials (Based on Availability)
- 16.2.6 Eli Lilly and Company
- 16.2.6.1. Overview
- 16.2.6.2. Products
- 16.2.6.3. SWOT Analysis
- 16.2.6.4. Recent Developments
- 16.2.6.5. Financials (Based on Availability)
- 16.2.7 Sun Pharmaceutical Industries Ltd
- 16.2.7.1. Overview
- 16.2.7.2. Products
- 16.2.7.3. SWOT Analysis
- 16.2.7.4. Recent Developments
- 16.2.7.5. Financials (Based on Availability)
- 16.2.8 Lanthen Pharmaceutical
- 16.2.8.1. Overview
- 16.2.8.2. Products
- 16.2.8.3. SWOT Analysis
- 16.2.8.4. Recent Developments
- 16.2.8.5. Financials (Based on Availability)
- 16.2.9 Bristol-Myers Squibb Company
- 16.2.9.1. Overview
- 16.2.9.2. Products
- 16.2.9.3. SWOT Analysis
- 16.2.9.4. Recent Developments
- 16.2.9.5. Financials (Based on Availability)
- 16.2.10 Pfizer Inc
- 16.2.10.1. Overview
- 16.2.10.2. Products
- 16.2.10.3. SWOT Analysis
- 16.2.10.4. Recent Developments
- 16.2.10.5. Financials (Based on Availability)
- 16.2.1 Teva Pharmaceutical Industries Ltd
List of Figures
- Figure 1: Global Glioma Diagnosis and Treatment Industry Revenue Breakdown (Million, %) by Region 2024 & 2032
- Figure 2: Global Glioma Diagnosis and Treatment Industry Volume Breakdown (K Unit, %) by Region 2024 & 2032
- Figure 3: North America Glioma Diagnosis and Treatment Industry Revenue (Million), by Country 2024 & 2032
- Figure 4: North America Glioma Diagnosis and Treatment Industry Volume (K Unit), by Country 2024 & 2032
- Figure 5: North America Glioma Diagnosis and Treatment Industry Revenue Share (%), by Country 2024 & 2032
- Figure 6: North America Glioma Diagnosis and Treatment Industry Volume Share (%), by Country 2024 & 2032
- Figure 7: Europe Glioma Diagnosis and Treatment Industry Revenue (Million), by Country 2024 & 2032
- Figure 8: Europe Glioma Diagnosis and Treatment Industry Volume (K Unit), by Country 2024 & 2032
- Figure 9: Europe Glioma Diagnosis and Treatment Industry Revenue Share (%), by Country 2024 & 2032
- Figure 10: Europe Glioma Diagnosis and Treatment Industry Volume Share (%), by Country 2024 & 2032
- Figure 11: Asia Pacific Glioma Diagnosis and Treatment Industry Revenue (Million), by Country 2024 & 2032
- Figure 12: Asia Pacific Glioma Diagnosis and Treatment Industry Volume (K Unit), by Country 2024 & 2032
- Figure 13: Asia Pacific Glioma Diagnosis and Treatment Industry Revenue Share (%), by Country 2024 & 2032
- Figure 14: Asia Pacific Glioma Diagnosis and Treatment Industry Volume Share (%), by Country 2024 & 2032
- Figure 15: Middle East and Africa Glioma Diagnosis and Treatment Industry Revenue (Million), by Country 2024 & 2032
- Figure 16: Middle East and Africa Glioma Diagnosis and Treatment Industry Volume (K Unit), by Country 2024 & 2032
- Figure 17: Middle East and Africa Glioma Diagnosis and Treatment Industry Revenue Share (%), by Country 2024 & 2032
- Figure 18: Middle East and Africa Glioma Diagnosis and Treatment Industry Volume Share (%), by Country 2024 & 2032
- Figure 19: South America Glioma Diagnosis and Treatment Industry Revenue (Million), by Country 2024 & 2032
- Figure 20: South America Glioma Diagnosis and Treatment Industry Volume (K Unit), by Country 2024 & 2032
- Figure 21: South America Glioma Diagnosis and Treatment Industry Revenue Share (%), by Country 2024 & 2032
- Figure 22: South America Glioma Diagnosis and Treatment Industry Volume Share (%), by Country 2024 & 2032
- Figure 23: North America Glioma Diagnosis and Treatment Industry Revenue (Million), by Treatment 2024 & 2032
- Figure 24: North America Glioma Diagnosis and Treatment Industry Volume (K Unit), by Treatment 2024 & 2032
- Figure 25: North America Glioma Diagnosis and Treatment Industry Revenue Share (%), by Treatment 2024 & 2032
- Figure 26: North America Glioma Diagnosis and Treatment Industry Volume Share (%), by Treatment 2024 & 2032
- Figure 27: North America Glioma Diagnosis and Treatment Industry Revenue (Million), by End -User 2024 & 2032
- Figure 28: North America Glioma Diagnosis and Treatment Industry Volume (K Unit), by End -User 2024 & 2032
- Figure 29: North America Glioma Diagnosis and Treatment Industry Revenue Share (%), by End -User 2024 & 2032
- Figure 30: North America Glioma Diagnosis and Treatment Industry Volume Share (%), by End -User 2024 & 2032
- Figure 31: North America Glioma Diagnosis and Treatment Industry Revenue (Million), by Country 2024 & 2032
- Figure 32: North America Glioma Diagnosis and Treatment Industry Volume (K Unit), by Country 2024 & 2032
- Figure 33: North America Glioma Diagnosis and Treatment Industry Revenue Share (%), by Country 2024 & 2032
- Figure 34: North America Glioma Diagnosis and Treatment Industry Volume Share (%), by Country 2024 & 2032
- Figure 35: Europe Glioma Diagnosis and Treatment Industry Revenue (Million), by Treatment 2024 & 2032
- Figure 36: Europe Glioma Diagnosis and Treatment Industry Volume (K Unit), by Treatment 2024 & 2032
- Figure 37: Europe Glioma Diagnosis and Treatment Industry Revenue Share (%), by Treatment 2024 & 2032
- Figure 38: Europe Glioma Diagnosis and Treatment Industry Volume Share (%), by Treatment 2024 & 2032
- Figure 39: Europe Glioma Diagnosis and Treatment Industry Revenue (Million), by End -User 2024 & 2032
- Figure 40: Europe Glioma Diagnosis and Treatment Industry Volume (K Unit), by End -User 2024 & 2032
- Figure 41: Europe Glioma Diagnosis and Treatment Industry Revenue Share (%), by End -User 2024 & 2032
- Figure 42: Europe Glioma Diagnosis and Treatment Industry Volume Share (%), by End -User 2024 & 2032
- Figure 43: Europe Glioma Diagnosis and Treatment Industry Revenue (Million), by Country 2024 & 2032
- Figure 44: Europe Glioma Diagnosis and Treatment Industry Volume (K Unit), by Country 2024 & 2032
- Figure 45: Europe Glioma Diagnosis and Treatment Industry Revenue Share (%), by Country 2024 & 2032
- Figure 46: Europe Glioma Diagnosis and Treatment Industry Volume Share (%), by Country 2024 & 2032
- Figure 47: Asia Pacific Glioma Diagnosis and Treatment Industry Revenue (Million), by Treatment 2024 & 2032
- Figure 48: Asia Pacific Glioma Diagnosis and Treatment Industry Volume (K Unit), by Treatment 2024 & 2032
- Figure 49: Asia Pacific Glioma Diagnosis and Treatment Industry Revenue Share (%), by Treatment 2024 & 2032
- Figure 50: Asia Pacific Glioma Diagnosis and Treatment Industry Volume Share (%), by Treatment 2024 & 2032
- Figure 51: Asia Pacific Glioma Diagnosis and Treatment Industry Revenue (Million), by End -User 2024 & 2032
- Figure 52: Asia Pacific Glioma Diagnosis and Treatment Industry Volume (K Unit), by End -User 2024 & 2032
- Figure 53: Asia Pacific Glioma Diagnosis and Treatment Industry Revenue Share (%), by End -User 2024 & 2032
- Figure 54: Asia Pacific Glioma Diagnosis and Treatment Industry Volume Share (%), by End -User 2024 & 2032
- Figure 55: Asia Pacific Glioma Diagnosis and Treatment Industry Revenue (Million), by Country 2024 & 2032
- Figure 56: Asia Pacific Glioma Diagnosis and Treatment Industry Volume (K Unit), by Country 2024 & 2032
- Figure 57: Asia Pacific Glioma Diagnosis and Treatment Industry Revenue Share (%), by Country 2024 & 2032
- Figure 58: Asia Pacific Glioma Diagnosis and Treatment Industry Volume Share (%), by Country 2024 & 2032
- Figure 59: Middle East and Africa Glioma Diagnosis and Treatment Industry Revenue (Million), by Treatment 2024 & 2032
- Figure 60: Middle East and Africa Glioma Diagnosis and Treatment Industry Volume (K Unit), by Treatment 2024 & 2032
- Figure 61: Middle East and Africa Glioma Diagnosis and Treatment Industry Revenue Share (%), by Treatment 2024 & 2032
- Figure 62: Middle East and Africa Glioma Diagnosis and Treatment Industry Volume Share (%), by Treatment 2024 & 2032
- Figure 63: Middle East and Africa Glioma Diagnosis and Treatment Industry Revenue (Million), by End -User 2024 & 2032
- Figure 64: Middle East and Africa Glioma Diagnosis and Treatment Industry Volume (K Unit), by End -User 2024 & 2032
- Figure 65: Middle East and Africa Glioma Diagnosis and Treatment Industry Revenue Share (%), by End -User 2024 & 2032
- Figure 66: Middle East and Africa Glioma Diagnosis and Treatment Industry Volume Share (%), by End -User 2024 & 2032
- Figure 67: Middle East and Africa Glioma Diagnosis and Treatment Industry Revenue (Million), by Country 2024 & 2032
- Figure 68: Middle East and Africa Glioma Diagnosis and Treatment Industry Volume (K Unit), by Country 2024 & 2032
- Figure 69: Middle East and Africa Glioma Diagnosis and Treatment Industry Revenue Share (%), by Country 2024 & 2032
- Figure 70: Middle East and Africa Glioma Diagnosis and Treatment Industry Volume Share (%), by Country 2024 & 2032
- Figure 71: South America Glioma Diagnosis and Treatment Industry Revenue (Million), by Treatment 2024 & 2032
- Figure 72: South America Glioma Diagnosis and Treatment Industry Volume (K Unit), by Treatment 2024 & 2032
- Figure 73: South America Glioma Diagnosis and Treatment Industry Revenue Share (%), by Treatment 2024 & 2032
- Figure 74: South America Glioma Diagnosis and Treatment Industry Volume Share (%), by Treatment 2024 & 2032
- Figure 75: South America Glioma Diagnosis and Treatment Industry Revenue (Million), by End -User 2024 & 2032
- Figure 76: South America Glioma Diagnosis and Treatment Industry Volume (K Unit), by End -User 2024 & 2032
- Figure 77: South America Glioma Diagnosis and Treatment Industry Revenue Share (%), by End -User 2024 & 2032
- Figure 78: South America Glioma Diagnosis and Treatment Industry Volume Share (%), by End -User 2024 & 2032
- Figure 79: South America Glioma Diagnosis and Treatment Industry Revenue (Million), by Country 2024 & 2032
- Figure 80: South America Glioma Diagnosis and Treatment Industry Volume (K Unit), by Country 2024 & 2032
- Figure 81: South America Glioma Diagnosis and Treatment Industry Revenue Share (%), by Country 2024 & 2032
- Figure 82: South America Glioma Diagnosis and Treatment Industry Volume Share (%), by Country 2024 & 2032
List of Tables
- Table 1: Global Glioma Diagnosis and Treatment Industry Revenue Million Forecast, by Region 2019 & 2032
- Table 2: Global Glioma Diagnosis and Treatment Industry Volume K Unit Forecast, by Region 2019 & 2032
- Table 3: Global Glioma Diagnosis and Treatment Industry Revenue Million Forecast, by Treatment 2019 & 2032
- Table 4: Global Glioma Diagnosis and Treatment Industry Volume K Unit Forecast, by Treatment 2019 & 2032
- Table 5: Global Glioma Diagnosis and Treatment Industry Revenue Million Forecast, by End -User 2019 & 2032
- Table 6: Global Glioma Diagnosis and Treatment Industry Volume K Unit Forecast, by End -User 2019 & 2032
- Table 7: Global Glioma Diagnosis and Treatment Industry Revenue Million Forecast, by Region 2019 & 2032
- Table 8: Global Glioma Diagnosis and Treatment Industry Volume K Unit Forecast, by Region 2019 & 2032
- Table 9: Global Glioma Diagnosis and Treatment Industry Revenue Million Forecast, by Country 2019 & 2032
- Table 10: Global Glioma Diagnosis and Treatment Industry Volume K Unit Forecast, by Country 2019 & 2032
- Table 11: United States Glioma Diagnosis and Treatment Industry Revenue (Million) Forecast, by Application 2019 & 2032
- Table 12: United States Glioma Diagnosis and Treatment Industry Volume (K Unit) Forecast, by Application 2019 & 2032
- Table 13: Canada Glioma Diagnosis and Treatment Industry Revenue (Million) Forecast, by Application 2019 & 2032
- Table 14: Canada Glioma Diagnosis and Treatment Industry Volume (K Unit) Forecast, by Application 2019 & 2032
- Table 15: Mexico Glioma Diagnosis and Treatment Industry Revenue (Million) Forecast, by Application 2019 & 2032
- Table 16: Mexico Glioma Diagnosis and Treatment Industry Volume (K Unit) Forecast, by Application 2019 & 2032
- Table 17: Global Glioma Diagnosis and Treatment Industry Revenue Million Forecast, by Country 2019 & 2032
- Table 18: Global Glioma Diagnosis and Treatment Industry Volume K Unit Forecast, by Country 2019 & 2032
- Table 19: Germany Glioma Diagnosis and Treatment Industry Revenue (Million) Forecast, by Application 2019 & 2032
- Table 20: Germany Glioma Diagnosis and Treatment Industry Volume (K Unit) Forecast, by Application 2019 & 2032
- Table 21: United Kingdom Glioma Diagnosis and Treatment Industry Revenue (Million) Forecast, by Application 2019 & 2032
- Table 22: United Kingdom Glioma Diagnosis and Treatment Industry Volume (K Unit) Forecast, by Application 2019 & 2032
- Table 23: France Glioma Diagnosis and Treatment Industry Revenue (Million) Forecast, by Application 2019 & 2032
- Table 24: France Glioma Diagnosis and Treatment Industry Volume (K Unit) Forecast, by Application 2019 & 2032
- Table 25: Italy Glioma Diagnosis and Treatment Industry Revenue (Million) Forecast, by Application 2019 & 2032
- Table 26: Italy Glioma Diagnosis and Treatment Industry Volume (K Unit) Forecast, by Application 2019 & 2032
- Table 27: Spain Glioma Diagnosis and Treatment Industry Revenue (Million) Forecast, by Application 2019 & 2032
- Table 28: Spain Glioma Diagnosis and Treatment Industry Volume (K Unit) Forecast, by Application 2019 & 2032
- Table 29: Rest of Europe Glioma Diagnosis and Treatment Industry Revenue (Million) Forecast, by Application 2019 & 2032
- Table 30: Rest of Europe Glioma Diagnosis and Treatment Industry Volume (K Unit) Forecast, by Application 2019 & 2032
- Table 31: Global Glioma Diagnosis and Treatment Industry Revenue Million Forecast, by Country 2019 & 2032
- Table 32: Global Glioma Diagnosis and Treatment Industry Volume K Unit Forecast, by Country 2019 & 2032
- Table 33: China Glioma Diagnosis and Treatment Industry Revenue (Million) Forecast, by Application 2019 & 2032
- Table 34: China Glioma Diagnosis and Treatment Industry Volume (K Unit) Forecast, by Application 2019 & 2032
- Table 35: Japan Glioma Diagnosis and Treatment Industry Revenue (Million) Forecast, by Application 2019 & 2032
- Table 36: Japan Glioma Diagnosis and Treatment Industry Volume (K Unit) Forecast, by Application 2019 & 2032
- Table 37: India Glioma Diagnosis and Treatment Industry Revenue (Million) Forecast, by Application 2019 & 2032
- Table 38: India Glioma Diagnosis and Treatment Industry Volume (K Unit) Forecast, by Application 2019 & 2032
- Table 39: Australia Glioma Diagnosis and Treatment Industry Revenue (Million) Forecast, by Application 2019 & 2032
- Table 40: Australia Glioma Diagnosis and Treatment Industry Volume (K Unit) Forecast, by Application 2019 & 2032
- Table 41: South Korea Glioma Diagnosis and Treatment Industry Revenue (Million) Forecast, by Application 2019 & 2032
- Table 42: South Korea Glioma Diagnosis and Treatment Industry Volume (K Unit) Forecast, by Application 2019 & 2032
- Table 43: Rest of Asia Pacific Glioma Diagnosis and Treatment Industry Revenue (Million) Forecast, by Application 2019 & 2032
- Table 44: Rest of Asia Pacific Glioma Diagnosis and Treatment Industry Volume (K Unit) Forecast, by Application 2019 & 2032
- Table 45: Global Glioma Diagnosis and Treatment Industry Revenue Million Forecast, by Country 2019 & 2032
- Table 46: Global Glioma Diagnosis and Treatment Industry Volume K Unit Forecast, by Country 2019 & 2032
- Table 47: GCC Glioma Diagnosis and Treatment Industry Revenue (Million) Forecast, by Application 2019 & 2032
- Table 48: GCC Glioma Diagnosis and Treatment Industry Volume (K Unit) Forecast, by Application 2019 & 2032
- Table 49: South Africa Glioma Diagnosis and Treatment Industry Revenue (Million) Forecast, by Application 2019 & 2032
- Table 50: South Africa Glioma Diagnosis and Treatment Industry Volume (K Unit) Forecast, by Application 2019 & 2032
- Table 51: Rest of Middle East and Africa Glioma Diagnosis and Treatment Industry Revenue (Million) Forecast, by Application 2019 & 2032
- Table 52: Rest of Middle East and Africa Glioma Diagnosis and Treatment Industry Volume (K Unit) Forecast, by Application 2019 & 2032
- Table 53: Global Glioma Diagnosis and Treatment Industry Revenue Million Forecast, by Country 2019 & 2032
- Table 54: Global Glioma Diagnosis and Treatment Industry Volume K Unit Forecast, by Country 2019 & 2032
- Table 55: Brazil Glioma Diagnosis and Treatment Industry Revenue (Million) Forecast, by Application 2019 & 2032
- Table 56: Brazil Glioma Diagnosis and Treatment Industry Volume (K Unit) Forecast, by Application 2019 & 2032
- Table 57: Argentina Glioma Diagnosis and Treatment Industry Revenue (Million) Forecast, by Application 2019 & 2032
- Table 58: Argentina Glioma Diagnosis and Treatment Industry Volume (K Unit) Forecast, by Application 2019 & 2032
- Table 59: Rest of South America Glioma Diagnosis and Treatment Industry Revenue (Million) Forecast, by Application 2019 & 2032
- Table 60: Rest of South America Glioma Diagnosis and Treatment Industry Volume (K Unit) Forecast, by Application 2019 & 2032
- Table 61: Global Glioma Diagnosis and Treatment Industry Revenue Million Forecast, by Treatment 2019 & 2032
- Table 62: Global Glioma Diagnosis and Treatment Industry Volume K Unit Forecast, by Treatment 2019 & 2032
- Table 63: Global Glioma Diagnosis and Treatment Industry Revenue Million Forecast, by End -User 2019 & 2032
- Table 64: Global Glioma Diagnosis and Treatment Industry Volume K Unit Forecast, by End -User 2019 & 2032
- Table 65: Global Glioma Diagnosis and Treatment Industry Revenue Million Forecast, by Country 2019 & 2032
- Table 66: Global Glioma Diagnosis and Treatment Industry Volume K Unit Forecast, by Country 2019 & 2032
- Table 67: United States Glioma Diagnosis and Treatment Industry Revenue (Million) Forecast, by Application 2019 & 2032
- Table 68: United States Glioma Diagnosis and Treatment Industry Volume (K Unit) Forecast, by Application 2019 & 2032
- Table 69: Canada Glioma Diagnosis and Treatment Industry Revenue (Million) Forecast, by Application 2019 & 2032
- Table 70: Canada Glioma Diagnosis and Treatment Industry Volume (K Unit) Forecast, by Application 2019 & 2032
- Table 71: Mexico Glioma Diagnosis and Treatment Industry Revenue (Million) Forecast, by Application 2019 & 2032
- Table 72: Mexico Glioma Diagnosis and Treatment Industry Volume (K Unit) Forecast, by Application 2019 & 2032
- Table 73: Global Glioma Diagnosis and Treatment Industry Revenue Million Forecast, by Treatment 2019 & 2032
- Table 74: Global Glioma Diagnosis and Treatment Industry Volume K Unit Forecast, by Treatment 2019 & 2032
- Table 75: Global Glioma Diagnosis and Treatment Industry Revenue Million Forecast, by End -User 2019 & 2032
- Table 76: Global Glioma Diagnosis and Treatment Industry Volume K Unit Forecast, by End -User 2019 & 2032
- Table 77: Global Glioma Diagnosis and Treatment Industry Revenue Million Forecast, by Country 2019 & 2032
- Table 78: Global Glioma Diagnosis and Treatment Industry Volume K Unit Forecast, by Country 2019 & 2032
- Table 79: Germany Glioma Diagnosis and Treatment Industry Revenue (Million) Forecast, by Application 2019 & 2032
- Table 80: Germany Glioma Diagnosis and Treatment Industry Volume (K Unit) Forecast, by Application 2019 & 2032
- Table 81: United Kingdom Glioma Diagnosis and Treatment Industry Revenue (Million) Forecast, by Application 2019 & 2032
- Table 82: United Kingdom Glioma Diagnosis and Treatment Industry Volume (K Unit) Forecast, by Application 2019 & 2032
- Table 83: France Glioma Diagnosis and Treatment Industry Revenue (Million) Forecast, by Application 2019 & 2032
- Table 84: France Glioma Diagnosis and Treatment Industry Volume (K Unit) Forecast, by Application 2019 & 2032
- Table 85: Italy Glioma Diagnosis and Treatment Industry Revenue (Million) Forecast, by Application 2019 & 2032
- Table 86: Italy Glioma Diagnosis and Treatment Industry Volume (K Unit) Forecast, by Application 2019 & 2032
- Table 87: Spain Glioma Diagnosis and Treatment Industry Revenue (Million) Forecast, by Application 2019 & 2032
- Table 88: Spain Glioma Diagnosis and Treatment Industry Volume (K Unit) Forecast, by Application 2019 & 2032
- Table 89: Rest of Europe Glioma Diagnosis and Treatment Industry Revenue (Million) Forecast, by Application 2019 & 2032
- Table 90: Rest of Europe Glioma Diagnosis and Treatment Industry Volume (K Unit) Forecast, by Application 2019 & 2032
- Table 91: Global Glioma Diagnosis and Treatment Industry Revenue Million Forecast, by Treatment 2019 & 2032
- Table 92: Global Glioma Diagnosis and Treatment Industry Volume K Unit Forecast, by Treatment 2019 & 2032
- Table 93: Global Glioma Diagnosis and Treatment Industry Revenue Million Forecast, by End -User 2019 & 2032
- Table 94: Global Glioma Diagnosis and Treatment Industry Volume K Unit Forecast, by End -User 2019 & 2032
- Table 95: Global Glioma Diagnosis and Treatment Industry Revenue Million Forecast, by Country 2019 & 2032
- Table 96: Global Glioma Diagnosis and Treatment Industry Volume K Unit Forecast, by Country 2019 & 2032
- Table 97: China Glioma Diagnosis and Treatment Industry Revenue (Million) Forecast, by Application 2019 & 2032
- Table 98: China Glioma Diagnosis and Treatment Industry Volume (K Unit) Forecast, by Application 2019 & 2032
- Table 99: Japan Glioma Diagnosis and Treatment Industry Revenue (Million) Forecast, by Application 2019 & 2032
- Table 100: Japan Glioma Diagnosis and Treatment Industry Volume (K Unit) Forecast, by Application 2019 & 2032
- Table 101: India Glioma Diagnosis and Treatment Industry Revenue (Million) Forecast, by Application 2019 & 2032
- Table 102: India Glioma Diagnosis and Treatment Industry Volume (K Unit) Forecast, by Application 2019 & 2032
- Table 103: Australia Glioma Diagnosis and Treatment Industry Revenue (Million) Forecast, by Application 2019 & 2032
- Table 104: Australia Glioma Diagnosis and Treatment Industry Volume (K Unit) Forecast, by Application 2019 & 2032
- Table 105: South Korea Glioma Diagnosis and Treatment Industry Revenue (Million) Forecast, by Application 2019 & 2032
- Table 106: South Korea Glioma Diagnosis and Treatment Industry Volume (K Unit) Forecast, by Application 2019 & 2032
- Table 107: Rest of Asia Pacific Glioma Diagnosis and Treatment Industry Revenue (Million) Forecast, by Application 2019 & 2032
- Table 108: Rest of Asia Pacific Glioma Diagnosis and Treatment Industry Volume (K Unit) Forecast, by Application 2019 & 2032
- Table 109: Global Glioma Diagnosis and Treatment Industry Revenue Million Forecast, by Treatment 2019 & 2032
- Table 110: Global Glioma Diagnosis and Treatment Industry Volume K Unit Forecast, by Treatment 2019 & 2032
- Table 111: Global Glioma Diagnosis and Treatment Industry Revenue Million Forecast, by End -User 2019 & 2032
- Table 112: Global Glioma Diagnosis and Treatment Industry Volume K Unit Forecast, by End -User 2019 & 2032
- Table 113: Global Glioma Diagnosis and Treatment Industry Revenue Million Forecast, by Country 2019 & 2032
- Table 114: Global Glioma Diagnosis and Treatment Industry Volume K Unit Forecast, by Country 2019 & 2032
- Table 115: GCC Glioma Diagnosis and Treatment Industry Revenue (Million) Forecast, by Application 2019 & 2032
- Table 116: GCC Glioma Diagnosis and Treatment Industry Volume (K Unit) Forecast, by Application 2019 & 2032
- Table 117: South Africa Glioma Diagnosis and Treatment Industry Revenue (Million) Forecast, by Application 2019 & 2032
- Table 118: South Africa Glioma Diagnosis and Treatment Industry Volume (K Unit) Forecast, by Application 2019 & 2032
- Table 119: Rest of Middle East and Africa Glioma Diagnosis and Treatment Industry Revenue (Million) Forecast, by Application 2019 & 2032
- Table 120: Rest of Middle East and Africa Glioma Diagnosis and Treatment Industry Volume (K Unit) Forecast, by Application 2019 & 2032
- Table 121: Global Glioma Diagnosis and Treatment Industry Revenue Million Forecast, by Treatment 2019 & 2032
- Table 122: Global Glioma Diagnosis and Treatment Industry Volume K Unit Forecast, by Treatment 2019 & 2032
- Table 123: Global Glioma Diagnosis and Treatment Industry Revenue Million Forecast, by End -User 2019 & 2032
- Table 124: Global Glioma Diagnosis and Treatment Industry Volume K Unit Forecast, by End -User 2019 & 2032
- Table 125: Global Glioma Diagnosis and Treatment Industry Revenue Million Forecast, by Country 2019 & 2032
- Table 126: Global Glioma Diagnosis and Treatment Industry Volume K Unit Forecast, by Country 2019 & 2032
- Table 127: Brazil Glioma Diagnosis and Treatment Industry Revenue (Million) Forecast, by Application 2019 & 2032
- Table 128: Brazil Glioma Diagnosis and Treatment Industry Volume (K Unit) Forecast, by Application 2019 & 2032
- Table 129: Argentina Glioma Diagnosis and Treatment Industry Revenue (Million) Forecast, by Application 2019 & 2032
- Table 130: Argentina Glioma Diagnosis and Treatment Industry Volume (K Unit) Forecast, by Application 2019 & 2032
- Table 131: Rest of South America Glioma Diagnosis and Treatment Industry Revenue (Million) Forecast, by Application 2019 & 2032
- Table 132: Rest of South America Glioma Diagnosis and Treatment Industry Volume (K Unit) Forecast, by Application 2019 & 2032
Frequently Asked Questions
1. What is the projected Compound Annual Growth Rate (CAGR) of the Glioma Diagnosis and Treatment Industry?
The projected CAGR is approximately 8.00%.
2. Which companies are prominent players in the Glioma Diagnosis and Treatment Industry?
Key companies in the market include Teva Pharmaceutical Industries Ltd , Arbor Pharmaceuticals LLC, Amgen Inc, Merck & Co Inc, F Hoffmann-La Roche Ltd, Eli Lilly and Company, Sun Pharmaceutical Industries Ltd, Lanthen Pharmaceutical, Bristol-Myers Squibb Company, Pfizer Inc.
3. What are the main segments of the Glioma Diagnosis and Treatment Industry?
The market segments include Treatment, End -User.
4. Can you provide details about the market size?
The market size is estimated to be USD 2.80 Million as of 2022.
5. What are some drivers contributing to market growth?
Increasing Prevalence of Brain Disorders; Strong R&D Initiatives from Key Players; Increasing Aging Population.
6. What are the notable trends driving market growth?
Chemotherapy Segment is Expected to Dominate the Market Over the Forecast Period.
7. Are there any restraints impacting market growth?
Reimbursement Issues and Stringent Regulatory Guidelines; High Cost and Side Effects Associated with Therapies.
8. Can you provide examples of recent developments in the market?
June 2023: Chimeric Therapeutics activated the Phase 1B clinical trial in patients with recurrent and/ or progressive glioblastoma multiforme (GBM) to assess the safety and efficacy of CHM 1101, the company's first-in-class CLTX CAR T cell therapy.
9. What pricing options are available for accessing the report?
Pricing options include single-user, multi-user, and enterprise licenses priced at USD 4750, USD 5250, and USD 8750 respectively.
10. Is the market size provided in terms of value or volume?
The market size is provided in terms of value, measured in Million and volume, measured in K Unit.
11. Are there any specific market keywords associated with the report?
Yes, the market keyword associated with the report is "Glioma Diagnosis and Treatment Industry," which aids in identifying and referencing the specific market segment covered.
12. How do I determine which pricing option suits my needs best?
The pricing options vary based on user requirements and access needs. Individual users may opt for single-user licenses, while businesses requiring broader access may choose multi-user or enterprise licenses for cost-effective access to the report.
13. Are there any additional resources or data provided in the Glioma Diagnosis and Treatment Industry report?
While the report offers comprehensive insights, it's advisable to review the specific contents or supplementary materials provided to ascertain if additional resources or data are available.
14. How can I stay updated on further developments or reports in the Glioma Diagnosis and Treatment Industry?
To stay informed about further developments, trends, and reports in the Glioma Diagnosis and Treatment Industry, consider subscribing to industry newsletters, following relevant companies and organizations, or regularly checking reputable industry news sources and publications.
Methodology
Step 1 - Identification of Relevant Samples Size from Population Database


Step 2 - Approaches for Defining Global Market Size (Value, Volume* & Price*)

Note*: In applicable scenarios
Step 3 - Data Sources
Primary Research
- Web Analytics
- Survey Reports
- Research Institute
- Latest Research Reports
- Opinion Leaders
Secondary Research
- Annual Reports
- White Paper
- Latest Press Release
- Industry Association
- Paid Database
- Investor Presentations

Step 4 - Data Triangulation
Involves using different sources of information in order to increase the validity of a study
These sources are likely to be stakeholders in a program - participants, other researchers, program staff, other community members, and so on.
Then we put all data in single framework & apply various statistical tools to find out the dynamic on the market.
During the analysis stage, feedback from the stakeholder groups would be compared to determine areas of agreement as well as areas of divergence


