
Key Insights
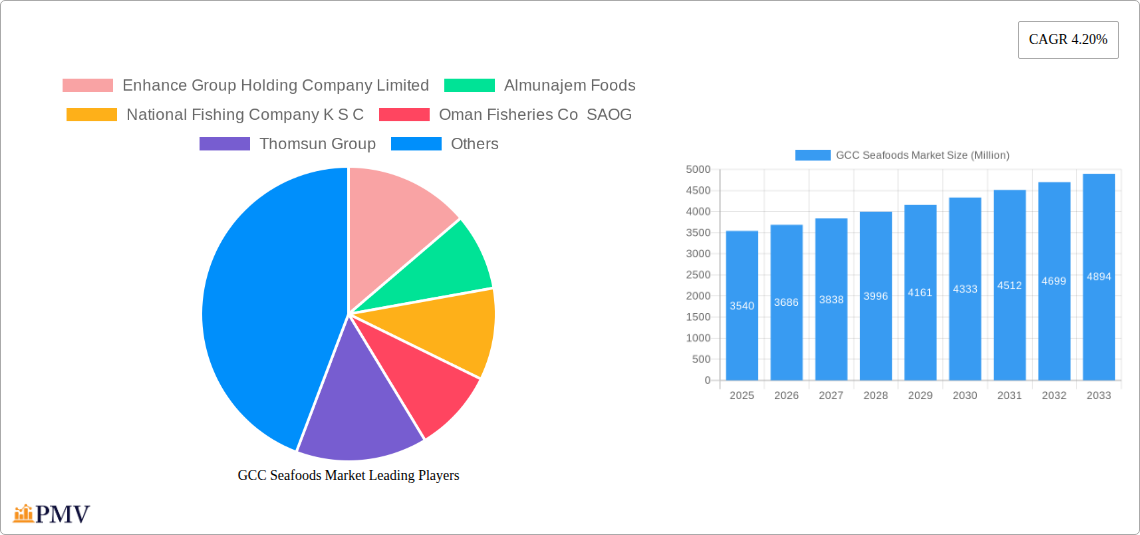
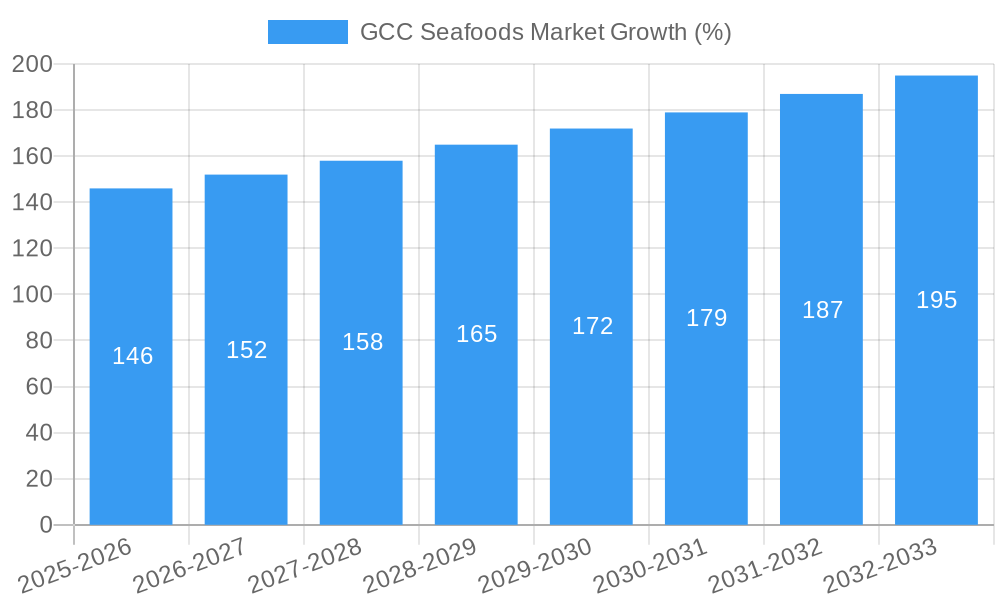
The GCC seafood market, valued at $3.54 billion in 2025, exhibits robust growth potential, projected to expand at a CAGR of 4.2% from 2025 to 2033. This expansion is fueled by several key factors. Rising disposable incomes within the GCC region are driving increased seafood consumption, particularly among younger demographics. The region's burgeoning tourism sector further contributes to market growth, with seafood featuring prominently in restaurant menus and hospitality offerings. Government initiatives promoting sustainable fishing practices and diversification of seafood sources also contribute positively. However, the market faces challenges, including price volatility influenced by global supply chain disruptions and fluctuations in fuel costs impacting transportation. Furthermore, growing consumer awareness of sustainable sourcing and ethical seafood practices presents both a challenge and an opportunity for market players. To capitalize on this, companies are increasingly focusing on eco-friendly practices and transparency in their supply chains, leading to premium pricing for sustainably sourced products. The market is segmented by form (canned, fresh/chilled, frozen, processed), distribution channel (off-trade, on-trade), country (Bahrain, Kuwait, Oman, Qatar, Saudi Arabia, UAE), and type (fish, shrimp, other seafood). The dominance of specific segments will likely shift over the forecast period, with potentially increased demand for convenient, processed seafood options and a growing preference for sustainably sourced products.
The competitive landscape is characterized by a mix of large multinational corporations and regional players. Key companies like Enhance Group Holding Company Limited, Almunajem Foods, and National Fishing Company K S C are actively shaping the market through product innovation, expansion of distribution networks, and strategic partnerships. Future growth will depend on effectively navigating the challenges related to sustainability, price volatility, and consumer preferences while capitalizing on the region's growing economic prosperity and tourism sector. Expansion into new product categories, including value-added seafood products and ready-to-eat meals, will also be crucial for companies to maintain a competitive edge. Analyzing the specific segment performance within each GCC country will be essential for targeted marketing strategies and investment decisions. The market shows strong promise for sustainable and innovative seafood businesses that prioritize quality, sustainability, and meet evolving consumer preferences.
GCC Seafoods Market: A Comprehensive Market Research Report (2019-2033)
This comprehensive report provides an in-depth analysis of the GCC Seafoods Market, offering invaluable insights for businesses operating within or planning to enter this dynamic sector. Covering the period 2019-2033, with a base year of 2025 and a forecast period of 2025-2033, this report presents a detailed overview of market structure, competitive landscape, growth drivers, challenges, and future outlook. The report leverages extensive data analysis to deliver actionable intelligence, enabling informed strategic decision-making. The market is segmented by form (Canned, Fresh/Chilled, Frozen, Processed), distribution channel (Off-Trade, On-Trade), country (Bahrain, Kuwait, Oman, Qatar, Saudi Arabia, UAE), and seafood type (Fish, Shrimp, Other Seafood).
GCC Seafoods Market Market Structure & Competitive Dynamics
The GCC seafood market exhibits a moderately concentrated structure, with several key players holding significant market share. The market is characterized by a dynamic interplay of established players like Enhance Group Holding Company Limited and National Fishing Company K S C, and emerging companies focused on innovation and niche market segments. Regulatory frameworks, varying across GCC countries, influence market access and operational costs. Innovation is primarily driven by product diversification, improved processing techniques, and the adoption of sustainable fishing practices. Product substitution is limited due to the unique nutritional profiles and culinary preferences associated with specific seafood types. End-user trends show a growing preference for healthy, sustainably sourced seafood, impacting product development strategies. M&A activity has been relatively moderate in recent years, with deal values averaging xx Million. For instance, the investment by the Gulf Japan Food Fund in Oman Fisheries Co SAOG in May 2022 highlights the potential for increased consolidation. Key metrics include:
- Market Concentration: Moderately Concentrated (xx% held by top 5 players)
- Average M&A Deal Value: xx Million
- Innovation Focus: Sustainable sourcing, value-added products
- Regulatory Landscape: Varying across GCC countries
GCC Seafoods Market Industry Trends & Insights
The GCC seafood market is projected to witness a CAGR of xx% during the forecast period (2025-2033). This growth is fueled by several factors including rising disposable incomes, increasing population, changing dietary habits, and the growing popularity of seafood in the region. Technological disruptions, such as improved cold chain logistics and advanced processing techniques, are enhancing product quality and shelf life. Consumer preferences are shifting towards healthier, sustainably sourced, and convenient seafood options. Competitive dynamics are characterized by a mix of established players and emerging companies, leading to increased product innovation and competitive pricing. Market penetration for value-added seafood products, like pre-packaged meals and ready-to-eat options, is steadily increasing, driven by changing lifestyle and demand for convenience. The market share of frozen and processed seafood is expected to grow significantly, fueled by long shelf life and convenience.
Dominant Markets & Segments in GCC Seafoods Market
The UAE currently holds the largest market share in the GCC seafood market, driven by strong economic growth, a large and diverse population, and well-developed infrastructure. Within the segmentation:
- Leading Country: United Arab Emirates
- Leading Form: Frozen seafood
- Leading Distribution Channel: Off-trade (retail and wholesale)
- Leading Seafood Type: Shrimp
Key Drivers for UAE Dominance:
- Strong economic growth and high disposable incomes.
- Large and diverse population with varied culinary preferences.
- Well-developed import and distribution networks.
- Increased investment in modern cold chain infrastructure.
Further analysis demonstrates a strong growth trajectory for processed and frozen seafood across the region due to their convenience and extended shelf life. The off-trade channel dominates due to the accessibility and scale of retail and wholesale distribution networks.
GCC Seafoods Market Product Innovations
Recent product innovations in the GCC seafood market focus on value-added products, such as ready-to-eat meals and convenient packaging formats catering to busy lifestyles. Technological advancements in processing and preservation techniques are improving product quality and safety. Companies are increasingly emphasizing sustainability by focusing on responsibly sourced seafood and eco-friendly packaging. These innovations aim to meet the evolving consumer demands for convenience, health, and sustainability, enhancing competitive advantage.
Report Segmentation & Scope
This report provides a detailed segmentation of the GCC seafood market based on:
- Form: Canned, Fresh/Chilled, Frozen, Processed (Growth projections and market size provided for each). Frozen seafood is expected to exhibit the highest growth due to longer shelf life and convenience.
- Distribution Channel: Off-Trade (Retail, Wholesale), On-Trade (Foodservice) (Market size and competitive dynamics detailed for each). Off-trade dominates due to its wide reach.
- Country: Bahrain, Kuwait, Oman, Qatar, Saudi Arabia, UAE (Individual market analysis for each country). UAE currently holds the largest market share.
- Seafood Type: Fish, Shrimp, Other Seafood (Growth forecasts and market size for each). Shrimp enjoys significant demand.
Key Drivers of GCC Seafoods Market Growth
The GCC seafood market's growth is driven by several factors: rising disposable incomes leading to increased spending on premium food products; a growing population with diverse culinary preferences; government initiatives supporting the seafood industry; and advancements in cold-chain infrastructure ensuring better product quality and freshness. The increasing popularity of healthy and convenient seafood options further fuels market expansion.
Challenges in the GCC Seafoods Market Sector
Challenges include maintaining a stable supply chain vulnerable to disruptions in global markets; adhering to stringent food safety and quality regulations varying across the region; and facing intense competition from both local and international players. Fluctuations in seafood prices also present a significant challenge for businesses. These factors can affect profitability and market share, requiring strategic mitigation.
Leading Players in the GCC Seafoods Market Market
- Enhance Group Holding Company Limited
- Almunajem Foods
- National Fishing Company K S C
- Oman Fisheries Co SAOG
- Thomsun Group
- Sea Pride LLC
- Albatha Group
- The Deep Seafood Company
- Blue Island PLC
- Yamama Al-Baida Gen Trading & Cont Est
Key Developments in GCC Seafoods Market Sector
- May 2022: Gulf Japan Food Fund invested in Oman Fisheries Co SAOG, expanding its global reach.
- February 2022: Asmak signed a strategic distribution agreement with Fish Farm in the UAE, broadening its market access.
Strategic GCC Seafoods Market Market Outlook
The GCC seafood market presents significant growth opportunities in the coming years. Strategic investments in sustainable fishing practices, technological advancements in processing and distribution, and diversification into value-added products are expected to shape the future of the industry. Focusing on consumer preferences for health, convenience, and sustainability will be key to achieving success in this dynamic market. The market is poised for continued expansion, driven by the factors detailed above and the region's commitment to economic diversification and food security.
GCC Seafoods Market Segmentation
-
1. Type
- 1.1. Fish
- 1.2. Shrimp
- 1.3. Other Seafood
-
2. Form
- 2.1. Canned
- 2.2. Fresh / Chilled
- 2.3. Frozen
- 2.4. Processed
-
3. Distribution Channel
-
3.1. Off-Trade
- 3.1.1. Convenience Stores
- 3.1.2. Online Channel
- 3.1.3. Supermarkets and Hypermarkets
- 3.1.4. Others
- 3.2. On-Trade
-
3.1. Off-Trade
GCC Seafoods Market Segmentation By Geography
-
1. North America
- 1.1. United States
- 1.2. Canada
- 1.3. Mexico
-
2. South America
- 2.1. Brazil
- 2.2. Argentina
- 2.3. Rest of South America
-
3. Europe
- 3.1. United Kingdom
- 3.2. Germany
- 3.3. France
- 3.4. Italy
- 3.5. Spain
- 3.6. Russia
- 3.7. Benelux
- 3.8. Nordics
- 3.9. Rest of Europe
-
4. Middle East & Africa
- 4.1. Turkey
- 4.2. Israel
- 4.3. GCC
- 4.4. North Africa
- 4.5. South Africa
- 4.6. Rest of Middle East & Africa
-
5. Asia Pacific
- 5.1. China
- 5.2. India
- 5.3. Japan
- 5.4. South Korea
- 5.5. ASEAN
- 5.6. Oceania
- 5.7. Rest of Asia Pacific
GCC Seafoods Market REPORT HIGHLIGHTS
| Aspects | Details |
|---|---|
| Study Period | 2019-2033 |
| Base Year | 2024 |
| Estimated Year | 2025 |
| Forecast Period | 2025-2033 |
| Historical Period | 2019-2024 |
| Growth Rate | CAGR of 4.20% from 2019-2033 |
| Segmentation |
|
Table of Contents
- 1. Introduction
- 1.1. Research Scope
- 1.2. Market Segmentation
- 1.3. Research Methodology
- 1.4. Definitions and Assumptions
- 2. Executive Summary
- 2.1. Introduction
- 3. Market Dynamics
- 3.1. Introduction
- 3.2. Market Drivers
- 3.2.1. Escalating Demand for Processed Poultry Products; Favorable Government Initiatives to Boost Production
- 3.3. Market Restrains
- 3.3.1. Rising Vegan Trend among Young Consumers; Deeper Penetration of Red Meat Across Saudi Arabia
- 3.4. Market Trends
- 3.4.1. OTHER KEY INDUSTRY TRENDS COVERED IN THE REPORT
- 4. Market Factor Analysis
- 4.1. Porters Five Forces
- 4.2. Supply/Value Chain
- 4.3. PESTEL analysis
- 4.4. Market Entropy
- 4.5. Patent/Trademark Analysis
- 5. Global GCC Seafoods Market Analysis, Insights and Forecast, 2019-2031
- 5.1. Market Analysis, Insights and Forecast - by Type
- 5.1.1. Fish
- 5.1.2. Shrimp
- 5.1.3. Other Seafood
- 5.2. Market Analysis, Insights and Forecast - by Form
- 5.2.1. Canned
- 5.2.2. Fresh / Chilled
- 5.2.3. Frozen
- 5.2.4. Processed
- 5.3. Market Analysis, Insights and Forecast - by Distribution Channel
- 5.3.1. Off-Trade
- 5.3.1.1. Convenience Stores
- 5.3.1.2. Online Channel
- 5.3.1.3. Supermarkets and Hypermarkets
- 5.3.1.4. Others
- 5.3.2. On-Trade
- 5.3.1. Off-Trade
- 5.4. Market Analysis, Insights and Forecast - by Region
- 5.4.1. North America
- 5.4.2. South America
- 5.4.3. Europe
- 5.4.4. Middle East & Africa
- 5.4.5. Asia Pacific
- 5.1. Market Analysis, Insights and Forecast - by Type
- 6. North America GCC Seafoods Market Analysis, Insights and Forecast, 2019-2031
- 6.1. Market Analysis, Insights and Forecast - by Type
- 6.1.1. Fish
- 6.1.2. Shrimp
- 6.1.3. Other Seafood
- 6.2. Market Analysis, Insights and Forecast - by Form
- 6.2.1. Canned
- 6.2.2. Fresh / Chilled
- 6.2.3. Frozen
- 6.2.4. Processed
- 6.3. Market Analysis, Insights and Forecast - by Distribution Channel
- 6.3.1. Off-Trade
- 6.3.1.1. Convenience Stores
- 6.3.1.2. Online Channel
- 6.3.1.3. Supermarkets and Hypermarkets
- 6.3.1.4. Others
- 6.3.2. On-Trade
- 6.3.1. Off-Trade
- 6.1. Market Analysis, Insights and Forecast - by Type
- 7. South America GCC Seafoods Market Analysis, Insights and Forecast, 2019-2031
- 7.1. Market Analysis, Insights and Forecast - by Type
- 7.1.1. Fish
- 7.1.2. Shrimp
- 7.1.3. Other Seafood
- 7.2. Market Analysis, Insights and Forecast - by Form
- 7.2.1. Canned
- 7.2.2. Fresh / Chilled
- 7.2.3. Frozen
- 7.2.4. Processed
- 7.3. Market Analysis, Insights and Forecast - by Distribution Channel
- 7.3.1. Off-Trade
- 7.3.1.1. Convenience Stores
- 7.3.1.2. Online Channel
- 7.3.1.3. Supermarkets and Hypermarkets
- 7.3.1.4. Others
- 7.3.2. On-Trade
- 7.3.1. Off-Trade
- 7.1. Market Analysis, Insights and Forecast - by Type
- 8. Europe GCC Seafoods Market Analysis, Insights and Forecast, 2019-2031
- 8.1. Market Analysis, Insights and Forecast - by Type
- 8.1.1. Fish
- 8.1.2. Shrimp
- 8.1.3. Other Seafood
- 8.2. Market Analysis, Insights and Forecast - by Form
- 8.2.1. Canned
- 8.2.2. Fresh / Chilled
- 8.2.3. Frozen
- 8.2.4. Processed
- 8.3. Market Analysis, Insights and Forecast - by Distribution Channel
- 8.3.1. Off-Trade
- 8.3.1.1. Convenience Stores
- 8.3.1.2. Online Channel
- 8.3.1.3. Supermarkets and Hypermarkets
- 8.3.1.4. Others
- 8.3.2. On-Trade
- 8.3.1. Off-Trade
- 8.1. Market Analysis, Insights and Forecast - by Type
- 9. Middle East & Africa GCC Seafoods Market Analysis, Insights and Forecast, 2019-2031
- 9.1. Market Analysis, Insights and Forecast - by Type
- 9.1.1. Fish
- 9.1.2. Shrimp
- 9.1.3. Other Seafood
- 9.2. Market Analysis, Insights and Forecast - by Form
- 9.2.1. Canned
- 9.2.2. Fresh / Chilled
- 9.2.3. Frozen
- 9.2.4. Processed
- 9.3. Market Analysis, Insights and Forecast - by Distribution Channel
- 9.3.1. Off-Trade
- 9.3.1.1. Convenience Stores
- 9.3.1.2. Online Channel
- 9.3.1.3. Supermarkets and Hypermarkets
- 9.3.1.4. Others
- 9.3.2. On-Trade
- 9.3.1. Off-Trade
- 9.1. Market Analysis, Insights and Forecast - by Type
- 10. Asia Pacific GCC Seafoods Market Analysis, Insights and Forecast, 2019-2031
- 10.1. Market Analysis, Insights and Forecast - by Type
- 10.1.1. Fish
- 10.1.2. Shrimp
- 10.1.3. Other Seafood
- 10.2. Market Analysis, Insights and Forecast - by Form
- 10.2.1. Canned
- 10.2.2. Fresh / Chilled
- 10.2.3. Frozen
- 10.2.4. Processed
- 10.3. Market Analysis, Insights and Forecast - by Distribution Channel
- 10.3.1. Off-Trade
- 10.3.1.1. Convenience Stores
- 10.3.1.2. Online Channel
- 10.3.1.3. Supermarkets and Hypermarkets
- 10.3.1.4. Others
- 10.3.2. On-Trade
- 10.3.1. Off-Trade
- 10.1. Market Analysis, Insights and Forecast - by Type
- 11. North America GCC Seafoods Market Analysis, Insights and Forecast, 2019-2031
- 11.1. Market Analysis, Insights and Forecast - By Country/Sub-region
- 11.1.1 United States
- 11.1.2 Canada
- 11.1.3 Mexico
- 11.1.4 Rest of North America
- 12. Europe GCC Seafoods Market Analysis, Insights and Forecast, 2019-2031
- 12.1. Market Analysis, Insights and Forecast - By Country/Sub-region
- 12.1.1 United Kingdom
- 12.1.2 Germany
- 12.1.3 France
- 12.1.4 Russia
- 12.1.5 Italy
- 12.1.6 Spain
- 12.1.7 Rest of Europe
- 13. Asia Pacific GCC Seafoods Market Analysis, Insights and Forecast, 2019-2031
- 13.1. Market Analysis, Insights and Forecast - By Country/Sub-region
- 13.1.1 India
- 13.1.2 China
- 13.1.3 Japan
- 13.1.4 Australia
- 13.1.5 Rest of Asia Pacific
- 14. South America GCC Seafoods Market Analysis, Insights and Forecast, 2019-2031
- 14.1. Market Analysis, Insights and Forecast - By Country/Sub-region
- 14.1.1 Brazil
- 14.1.2 Argentina
- 14.1.3 Rest of South America
- 15. Middle East and Africa GCC Seafoods Market Analysis, Insights and Forecast, 2019-2031
- 15.1. Market Analysis, Insights and Forecast - By Country/Sub-region
- 15.1.1 South Africa
- 15.1.2 United Arab Emirates
- 15.1.3 Rest of Middle East and Africa
- 16. Competitive Analysis
- 16.1. Global Market Share Analysis 2024
- 16.2. Company Profiles
- 16.2.1 Enhance Group Holding Company Limited
- 16.2.1.1. Overview
- 16.2.1.2. Products
- 16.2.1.3. SWOT Analysis
- 16.2.1.4. Recent Developments
- 16.2.1.5. Financials (Based on Availability)
- 16.2.2 Almunajem Foods
- 16.2.2.1. Overview
- 16.2.2.2. Products
- 16.2.2.3. SWOT Analysis
- 16.2.2.4. Recent Developments
- 16.2.2.5. Financials (Based on Availability)
- 16.2.3 National Fishing Company K S C
- 16.2.3.1. Overview
- 16.2.3.2. Products
- 16.2.3.3. SWOT Analysis
- 16.2.3.4. Recent Developments
- 16.2.3.5. Financials (Based on Availability)
- 16.2.4 Oman Fisheries Co SAOG
- 16.2.4.1. Overview
- 16.2.4.2. Products
- 16.2.4.3. SWOT Analysis
- 16.2.4.4. Recent Developments
- 16.2.4.5. Financials (Based on Availability)
- 16.2.5 Thomsun Group
- 16.2.5.1. Overview
- 16.2.5.2. Products
- 16.2.5.3. SWOT Analysis
- 16.2.5.4. Recent Developments
- 16.2.5.5. Financials (Based on Availability)
- 16.2.6 Sea Pride LLC
- 16.2.6.1. Overview
- 16.2.6.2. Products
- 16.2.6.3. SWOT Analysis
- 16.2.6.4. Recent Developments
- 16.2.6.5. Financials (Based on Availability)
- 16.2.7 Albatha Group
- 16.2.7.1. Overview
- 16.2.7.2. Products
- 16.2.7.3. SWOT Analysis
- 16.2.7.4. Recent Developments
- 16.2.7.5. Financials (Based on Availability)
- 16.2.8 The Deep Seafood Company
- 16.2.8.1. Overview
- 16.2.8.2. Products
- 16.2.8.3. SWOT Analysis
- 16.2.8.4. Recent Developments
- 16.2.8.5. Financials (Based on Availability)
- 16.2.9 Blue Island PLC
- 16.2.9.1. Overview
- 16.2.9.2. Products
- 16.2.9.3. SWOT Analysis
- 16.2.9.4. Recent Developments
- 16.2.9.5. Financials (Based on Availability)
- 16.2.10 Yamama Al-Baida Gen Trading & Cont Est
- 16.2.10.1. Overview
- 16.2.10.2. Products
- 16.2.10.3. SWOT Analysis
- 16.2.10.4. Recent Developments
- 16.2.10.5. Financials (Based on Availability)
- 16.2.1 Enhance Group Holding Company Limited
List of Figures
- Figure 1: Global GCC Seafoods Market Revenue Breakdown (Million, %) by Region 2024 & 2032
- Figure 2: Global GCC Seafoods Market Volume Breakdown (Tons, %) by Region 2024 & 2032
- Figure 3: North America GCC Seafoods Market Revenue (Million), by Country 2024 & 2032
- Figure 4: North America GCC Seafoods Market Volume (Tons), by Country 2024 & 2032
- Figure 5: North America GCC Seafoods Market Revenue Share (%), by Country 2024 & 2032
- Figure 6: North America GCC Seafoods Market Volume Share (%), by Country 2024 & 2032
- Figure 7: Europe GCC Seafoods Market Revenue (Million), by Country 2024 & 2032
- Figure 8: Europe GCC Seafoods Market Volume (Tons), by Country 2024 & 2032
- Figure 9: Europe GCC Seafoods Market Revenue Share (%), by Country 2024 & 2032
- Figure 10: Europe GCC Seafoods Market Volume Share (%), by Country 2024 & 2032
- Figure 11: Asia Pacific GCC Seafoods Market Revenue (Million), by Country 2024 & 2032
- Figure 12: Asia Pacific GCC Seafoods Market Volume (Tons), by Country 2024 & 2032
- Figure 13: Asia Pacific GCC Seafoods Market Revenue Share (%), by Country 2024 & 2032
- Figure 14: Asia Pacific GCC Seafoods Market Volume Share (%), by Country 2024 & 2032
- Figure 15: South America GCC Seafoods Market Revenue (Million), by Country 2024 & 2032
- Figure 16: South America GCC Seafoods Market Volume (Tons), by Country 2024 & 2032
- Figure 17: South America GCC Seafoods Market Revenue Share (%), by Country 2024 & 2032
- Figure 18: South America GCC Seafoods Market Volume Share (%), by Country 2024 & 2032
- Figure 19: Middle East and Africa GCC Seafoods Market Revenue (Million), by Country 2024 & 2032
- Figure 20: Middle East and Africa GCC Seafoods Market Volume (Tons), by Country 2024 & 2032
- Figure 21: Middle East and Africa GCC Seafoods Market Revenue Share (%), by Country 2024 & 2032
- Figure 22: Middle East and Africa GCC Seafoods Market Volume Share (%), by Country 2024 & 2032
- Figure 23: North America GCC Seafoods Market Revenue (Million), by Type 2024 & 2032
- Figure 24: North America GCC Seafoods Market Volume (Tons), by Type 2024 & 2032
- Figure 25: North America GCC Seafoods Market Revenue Share (%), by Type 2024 & 2032
- Figure 26: North America GCC Seafoods Market Volume Share (%), by Type 2024 & 2032
- Figure 27: North America GCC Seafoods Market Revenue (Million), by Form 2024 & 2032
- Figure 28: North America GCC Seafoods Market Volume (Tons), by Form 2024 & 2032
- Figure 29: North America GCC Seafoods Market Revenue Share (%), by Form 2024 & 2032
- Figure 30: North America GCC Seafoods Market Volume Share (%), by Form 2024 & 2032
- Figure 31: North America GCC Seafoods Market Revenue (Million), by Distribution Channel 2024 & 2032
- Figure 32: North America GCC Seafoods Market Volume (Tons), by Distribution Channel 2024 & 2032
- Figure 33: North America GCC Seafoods Market Revenue Share (%), by Distribution Channel 2024 & 2032
- Figure 34: North America GCC Seafoods Market Volume Share (%), by Distribution Channel 2024 & 2032
- Figure 35: North America GCC Seafoods Market Revenue (Million), by Country 2024 & 2032
- Figure 36: North America GCC Seafoods Market Volume (Tons), by Country 2024 & 2032
- Figure 37: North America GCC Seafoods Market Revenue Share (%), by Country 2024 & 2032
- Figure 38: North America GCC Seafoods Market Volume Share (%), by Country 2024 & 2032
- Figure 39: South America GCC Seafoods Market Revenue (Million), by Type 2024 & 2032
- Figure 40: South America GCC Seafoods Market Volume (Tons), by Type 2024 & 2032
- Figure 41: South America GCC Seafoods Market Revenue Share (%), by Type 2024 & 2032
- Figure 42: South America GCC Seafoods Market Volume Share (%), by Type 2024 & 2032
- Figure 43: South America GCC Seafoods Market Revenue (Million), by Form 2024 & 2032
- Figure 44: South America GCC Seafoods Market Volume (Tons), by Form 2024 & 2032
- Figure 45: South America GCC Seafoods Market Revenue Share (%), by Form 2024 & 2032
- Figure 46: South America GCC Seafoods Market Volume Share (%), by Form 2024 & 2032
- Figure 47: South America GCC Seafoods Market Revenue (Million), by Distribution Channel 2024 & 2032
- Figure 48: South America GCC Seafoods Market Volume (Tons), by Distribution Channel 2024 & 2032
- Figure 49: South America GCC Seafoods Market Revenue Share (%), by Distribution Channel 2024 & 2032
- Figure 50: South America GCC Seafoods Market Volume Share (%), by Distribution Channel 2024 & 2032
- Figure 51: South America GCC Seafoods Market Revenue (Million), by Country 2024 & 2032
- Figure 52: South America GCC Seafoods Market Volume (Tons), by Country 2024 & 2032
- Figure 53: South America GCC Seafoods Market Revenue Share (%), by Country 2024 & 2032
- Figure 54: South America GCC Seafoods Market Volume Share (%), by Country 2024 & 2032
- Figure 55: Europe GCC Seafoods Market Revenue (Million), by Type 2024 & 2032
- Figure 56: Europe GCC Seafoods Market Volume (Tons), by Type 2024 & 2032
- Figure 57: Europe GCC Seafoods Market Revenue Share (%), by Type 2024 & 2032
- Figure 58: Europe GCC Seafoods Market Volume Share (%), by Type 2024 & 2032
- Figure 59: Europe GCC Seafoods Market Revenue (Million), by Form 2024 & 2032
- Figure 60: Europe GCC Seafoods Market Volume (Tons), by Form 2024 & 2032
- Figure 61: Europe GCC Seafoods Market Revenue Share (%), by Form 2024 & 2032
- Figure 62: Europe GCC Seafoods Market Volume Share (%), by Form 2024 & 2032
- Figure 63: Europe GCC Seafoods Market Revenue (Million), by Distribution Channel 2024 & 2032
- Figure 64: Europe GCC Seafoods Market Volume (Tons), by Distribution Channel 2024 & 2032
- Figure 65: Europe GCC Seafoods Market Revenue Share (%), by Distribution Channel 2024 & 2032
- Figure 66: Europe GCC Seafoods Market Volume Share (%), by Distribution Channel 2024 & 2032
- Figure 67: Europe GCC Seafoods Market Revenue (Million), by Country 2024 & 2032
- Figure 68: Europe GCC Seafoods Market Volume (Tons), by Country 2024 & 2032
- Figure 69: Europe GCC Seafoods Market Revenue Share (%), by Country 2024 & 2032
- Figure 70: Europe GCC Seafoods Market Volume Share (%), by Country 2024 & 2032
- Figure 71: Middle East & Africa GCC Seafoods Market Revenue (Million), by Type 2024 & 2032
- Figure 72: Middle East & Africa GCC Seafoods Market Volume (Tons), by Type 2024 & 2032
- Figure 73: Middle East & Africa GCC Seafoods Market Revenue Share (%), by Type 2024 & 2032
- Figure 74: Middle East & Africa GCC Seafoods Market Volume Share (%), by Type 2024 & 2032
- Figure 75: Middle East & Africa GCC Seafoods Market Revenue (Million), by Form 2024 & 2032
- Figure 76: Middle East & Africa GCC Seafoods Market Volume (Tons), by Form 2024 & 2032
- Figure 77: Middle East & Africa GCC Seafoods Market Revenue Share (%), by Form 2024 & 2032
- Figure 78: Middle East & Africa GCC Seafoods Market Volume Share (%), by Form 2024 & 2032
- Figure 79: Middle East & Africa GCC Seafoods Market Revenue (Million), by Distribution Channel 2024 & 2032
- Figure 80: Middle East & Africa GCC Seafoods Market Volume (Tons), by Distribution Channel 2024 & 2032
- Figure 81: Middle East & Africa GCC Seafoods Market Revenue Share (%), by Distribution Channel 2024 & 2032
- Figure 82: Middle East & Africa GCC Seafoods Market Volume Share (%), by Distribution Channel 2024 & 2032
- Figure 83: Middle East & Africa GCC Seafoods Market Revenue (Million), by Country 2024 & 2032
- Figure 84: Middle East & Africa GCC Seafoods Market Volume (Tons), by Country 2024 & 2032
- Figure 85: Middle East & Africa GCC Seafoods Market Revenue Share (%), by Country 2024 & 2032
- Figure 86: Middle East & Africa GCC Seafoods Market Volume Share (%), by Country 2024 & 2032
- Figure 87: Asia Pacific GCC Seafoods Market Revenue (Million), by Type 2024 & 2032
- Figure 88: Asia Pacific GCC Seafoods Market Volume (Tons), by Type 2024 & 2032
- Figure 89: Asia Pacific GCC Seafoods Market Revenue Share (%), by Type 2024 & 2032
- Figure 90: Asia Pacific GCC Seafoods Market Volume Share (%), by Type 2024 & 2032
- Figure 91: Asia Pacific GCC Seafoods Market Revenue (Million), by Form 2024 & 2032
- Figure 92: Asia Pacific GCC Seafoods Market Volume (Tons), by Form 2024 & 2032
- Figure 93: Asia Pacific GCC Seafoods Market Revenue Share (%), by Form 2024 & 2032
- Figure 94: Asia Pacific GCC Seafoods Market Volume Share (%), by Form 2024 & 2032
- Figure 95: Asia Pacific GCC Seafoods Market Revenue (Million), by Distribution Channel 2024 & 2032
- Figure 96: Asia Pacific GCC Seafoods Market Volume (Tons), by Distribution Channel 2024 & 2032
- Figure 97: Asia Pacific GCC Seafoods Market Revenue Share (%), by Distribution Channel 2024 & 2032
- Figure 98: Asia Pacific GCC Seafoods Market Volume Share (%), by Distribution Channel 2024 & 2032
- Figure 99: Asia Pacific GCC Seafoods Market Revenue (Million), by Country 2024 & 2032
- Figure 100: Asia Pacific GCC Seafoods Market Volume (Tons), by Country 2024 & 2032
- Figure 101: Asia Pacific GCC Seafoods Market Revenue Share (%), by Country 2024 & 2032
- Figure 102: Asia Pacific GCC Seafoods Market Volume Share (%), by Country 2024 & 2032
List of Tables
- Table 1: Global GCC Seafoods Market Revenue Million Forecast, by Region 2019 & 2032
- Table 2: Global GCC Seafoods Market Volume Tons Forecast, by Region 2019 & 2032
- Table 3: Global GCC Seafoods Market Revenue Million Forecast, by Type 2019 & 2032
- Table 4: Global GCC Seafoods Market Volume Tons Forecast, by Type 2019 & 2032
- Table 5: Global GCC Seafoods Market Revenue Million Forecast, by Form 2019 & 2032
- Table 6: Global GCC Seafoods Market Volume Tons Forecast, by Form 2019 & 2032
- Table 7: Global GCC Seafoods Market Revenue Million Forecast, by Distribution Channel 2019 & 2032
- Table 8: Global GCC Seafoods Market Volume Tons Forecast, by Distribution Channel 2019 & 2032
- Table 9: Global GCC Seafoods Market Revenue Million Forecast, by Region 2019 & 2032
- Table 10: Global GCC Seafoods Market Volume Tons Forecast, by Region 2019 & 2032
- Table 11: Global GCC Seafoods Market Revenue Million Forecast, by Country 2019 & 2032
- Table 12: Global GCC Seafoods Market Volume Tons Forecast, by Country 2019 & 2032
- Table 13: United States GCC Seafoods Market Revenue (Million) Forecast, by Application 2019 & 2032
- Table 14: United States GCC Seafoods Market Volume (Tons) Forecast, by Application 2019 & 2032
- Table 15: Canada GCC Seafoods Market Revenue (Million) Forecast, by Application 2019 & 2032
- Table 16: Canada GCC Seafoods Market Volume (Tons) Forecast, by Application 2019 & 2032
- Table 17: Mexico GCC Seafoods Market Revenue (Million) Forecast, by Application 2019 & 2032
- Table 18: Mexico GCC Seafoods Market Volume (Tons) Forecast, by Application 2019 & 2032
- Table 19: Rest of North America GCC Seafoods Market Revenue (Million) Forecast, by Application 2019 & 2032
- Table 20: Rest of North America GCC Seafoods Market Volume (Tons) Forecast, by Application 2019 & 2032
- Table 21: Global GCC Seafoods Market Revenue Million Forecast, by Country 2019 & 2032
- Table 22: Global GCC Seafoods Market Volume Tons Forecast, by Country 2019 & 2032
- Table 23: United Kingdom GCC Seafoods Market Revenue (Million) Forecast, by Application 2019 & 2032
- Table 24: United Kingdom GCC Seafoods Market Volume (Tons) Forecast, by Application 2019 & 2032
- Table 25: Germany GCC Seafoods Market Revenue (Million) Forecast, by Application 2019 & 2032
- Table 26: Germany GCC Seafoods Market Volume (Tons) Forecast, by Application 2019 & 2032
- Table 27: France GCC Seafoods Market Revenue (Million) Forecast, by Application 2019 & 2032
- Table 28: France GCC Seafoods Market Volume (Tons) Forecast, by Application 2019 & 2032
- Table 29: Russia GCC Seafoods Market Revenue (Million) Forecast, by Application 2019 & 2032
- Table 30: Russia GCC Seafoods Market Volume (Tons) Forecast, by Application 2019 & 2032
- Table 31: Italy GCC Seafoods Market Revenue (Million) Forecast, by Application 2019 & 2032
- Table 32: Italy GCC Seafoods Market Volume (Tons) Forecast, by Application 2019 & 2032
- Table 33: Spain GCC Seafoods Market Revenue (Million) Forecast, by Application 2019 & 2032
- Table 34: Spain GCC Seafoods Market Volume (Tons) Forecast, by Application 2019 & 2032
- Table 35: Rest of Europe GCC Seafoods Market Revenue (Million) Forecast, by Application 2019 & 2032
- Table 36: Rest of Europe GCC Seafoods Market Volume (Tons) Forecast, by Application 2019 & 2032
- Table 37: Global GCC Seafoods Market Revenue Million Forecast, by Country 2019 & 2032
- Table 38: Global GCC Seafoods Market Volume Tons Forecast, by Country 2019 & 2032
- Table 39: India GCC Seafoods Market Revenue (Million) Forecast, by Application 2019 & 2032
- Table 40: India GCC Seafoods Market Volume (Tons) Forecast, by Application 2019 & 2032
- Table 41: China GCC Seafoods Market Revenue (Million) Forecast, by Application 2019 & 2032
- Table 42: China GCC Seafoods Market Volume (Tons) Forecast, by Application 2019 & 2032
- Table 43: Japan GCC Seafoods Market Revenue (Million) Forecast, by Application 2019 & 2032
- Table 44: Japan GCC Seafoods Market Volume (Tons) Forecast, by Application 2019 & 2032
- Table 45: Australia GCC Seafoods Market Revenue (Million) Forecast, by Application 2019 & 2032
- Table 46: Australia GCC Seafoods Market Volume (Tons) Forecast, by Application 2019 & 2032
- Table 47: Rest of Asia Pacific GCC Seafoods Market Revenue (Million) Forecast, by Application 2019 & 2032
- Table 48: Rest of Asia Pacific GCC Seafoods Market Volume (Tons) Forecast, by Application 2019 & 2032
- Table 49: Global GCC Seafoods Market Revenue Million Forecast, by Country 2019 & 2032
- Table 50: Global GCC Seafoods Market Volume Tons Forecast, by Country 2019 & 2032
- Table 51: Brazil GCC Seafoods Market Revenue (Million) Forecast, by Application 2019 & 2032
- Table 52: Brazil GCC Seafoods Market Volume (Tons) Forecast, by Application 2019 & 2032
- Table 53: Argentina GCC Seafoods Market Revenue (Million) Forecast, by Application 2019 & 2032
- Table 54: Argentina GCC Seafoods Market Volume (Tons) Forecast, by Application 2019 & 2032
- Table 55: Rest of South America GCC Seafoods Market Revenue (Million) Forecast, by Application 2019 & 2032
- Table 56: Rest of South America GCC Seafoods Market Volume (Tons) Forecast, by Application 2019 & 2032
- Table 57: Global GCC Seafoods Market Revenue Million Forecast, by Country 2019 & 2032
- Table 58: Global GCC Seafoods Market Volume Tons Forecast, by Country 2019 & 2032
- Table 59: South Africa GCC Seafoods Market Revenue (Million) Forecast, by Application 2019 & 2032
- Table 60: South Africa GCC Seafoods Market Volume (Tons) Forecast, by Application 2019 & 2032
- Table 61: United Arab Emirates GCC Seafoods Market Revenue (Million) Forecast, by Application 2019 & 2032
- Table 62: United Arab Emirates GCC Seafoods Market Volume (Tons) Forecast, by Application 2019 & 2032
- Table 63: Rest of Middle East and Africa GCC Seafoods Market Revenue (Million) Forecast, by Application 2019 & 2032
- Table 64: Rest of Middle East and Africa GCC Seafoods Market Volume (Tons) Forecast, by Application 2019 & 2032
- Table 65: Global GCC Seafoods Market Revenue Million Forecast, by Type 2019 & 2032
- Table 66: Global GCC Seafoods Market Volume Tons Forecast, by Type 2019 & 2032
- Table 67: Global GCC Seafoods Market Revenue Million Forecast, by Form 2019 & 2032
- Table 68: Global GCC Seafoods Market Volume Tons Forecast, by Form 2019 & 2032
- Table 69: Global GCC Seafoods Market Revenue Million Forecast, by Distribution Channel 2019 & 2032
- Table 70: Global GCC Seafoods Market Volume Tons Forecast, by Distribution Channel 2019 & 2032
- Table 71: Global GCC Seafoods Market Revenue Million Forecast, by Country 2019 & 2032
- Table 72: Global GCC Seafoods Market Volume Tons Forecast, by Country 2019 & 2032
- Table 73: United States GCC Seafoods Market Revenue (Million) Forecast, by Application 2019 & 2032
- Table 74: United States GCC Seafoods Market Volume (Tons) Forecast, by Application 2019 & 2032
- Table 75: Canada GCC Seafoods Market Revenue (Million) Forecast, by Application 2019 & 2032
- Table 76: Canada GCC Seafoods Market Volume (Tons) Forecast, by Application 2019 & 2032
- Table 77: Mexico GCC Seafoods Market Revenue (Million) Forecast, by Application 2019 & 2032
- Table 78: Mexico GCC Seafoods Market Volume (Tons) Forecast, by Application 2019 & 2032
- Table 79: Global GCC Seafoods Market Revenue Million Forecast, by Type 2019 & 2032
- Table 80: Global GCC Seafoods Market Volume Tons Forecast, by Type 2019 & 2032
- Table 81: Global GCC Seafoods Market Revenue Million Forecast, by Form 2019 & 2032
- Table 82: Global GCC Seafoods Market Volume Tons Forecast, by Form 2019 & 2032
- Table 83: Global GCC Seafoods Market Revenue Million Forecast, by Distribution Channel 2019 & 2032
- Table 84: Global GCC Seafoods Market Volume Tons Forecast, by Distribution Channel 2019 & 2032
- Table 85: Global GCC Seafoods Market Revenue Million Forecast, by Country 2019 & 2032
- Table 86: Global GCC Seafoods Market Volume Tons Forecast, by Country 2019 & 2032
- Table 87: Brazil GCC Seafoods Market Revenue (Million) Forecast, by Application 2019 & 2032
- Table 88: Brazil GCC Seafoods Market Volume (Tons) Forecast, by Application 2019 & 2032
- Table 89: Argentina GCC Seafoods Market Revenue (Million) Forecast, by Application 2019 & 2032
- Table 90: Argentina GCC Seafoods Market Volume (Tons) Forecast, by Application 2019 & 2032
- Table 91: Rest of South America GCC Seafoods Market Revenue (Million) Forecast, by Application 2019 & 2032
- Table 92: Rest of South America GCC Seafoods Market Volume (Tons) Forecast, by Application 2019 & 2032
- Table 93: Global GCC Seafoods Market Revenue Million Forecast, by Type 2019 & 2032
- Table 94: Global GCC Seafoods Market Volume Tons Forecast, by Type 2019 & 2032
- Table 95: Global GCC Seafoods Market Revenue Million Forecast, by Form 2019 & 2032
- Table 96: Global GCC Seafoods Market Volume Tons Forecast, by Form 2019 & 2032
- Table 97: Global GCC Seafoods Market Revenue Million Forecast, by Distribution Channel 2019 & 2032
- Table 98: Global GCC Seafoods Market Volume Tons Forecast, by Distribution Channel 2019 & 2032
- Table 99: Global GCC Seafoods Market Revenue Million Forecast, by Country 2019 & 2032
- Table 100: Global GCC Seafoods Market Volume Tons Forecast, by Country 2019 & 2032
- Table 101: United Kingdom GCC Seafoods Market Revenue (Million) Forecast, by Application 2019 & 2032
- Table 102: United Kingdom GCC Seafoods Market Volume (Tons) Forecast, by Application 2019 & 2032
- Table 103: Germany GCC Seafoods Market Revenue (Million) Forecast, by Application 2019 & 2032
- Table 104: Germany GCC Seafoods Market Volume (Tons) Forecast, by Application 2019 & 2032
- Table 105: France GCC Seafoods Market Revenue (Million) Forecast, by Application 2019 & 2032
- Table 106: France GCC Seafoods Market Volume (Tons) Forecast, by Application 2019 & 2032
- Table 107: Italy GCC Seafoods Market Revenue (Million) Forecast, by Application 2019 & 2032
- Table 108: Italy GCC Seafoods Market Volume (Tons) Forecast, by Application 2019 & 2032
- Table 109: Spain GCC Seafoods Market Revenue (Million) Forecast, by Application 2019 & 2032
- Table 110: Spain GCC Seafoods Market Volume (Tons) Forecast, by Application 2019 & 2032
- Table 111: Russia GCC Seafoods Market Revenue (Million) Forecast, by Application 2019 & 2032
- Table 112: Russia GCC Seafoods Market Volume (Tons) Forecast, by Application 2019 & 2032
- Table 113: Benelux GCC Seafoods Market Revenue (Million) Forecast, by Application 2019 & 2032
- Table 114: Benelux GCC Seafoods Market Volume (Tons) Forecast, by Application 2019 & 2032
- Table 115: Nordics GCC Seafoods Market Revenue (Million) Forecast, by Application 2019 & 2032
- Table 116: Nordics GCC Seafoods Market Volume (Tons) Forecast, by Application 2019 & 2032
- Table 117: Rest of Europe GCC Seafoods Market Revenue (Million) Forecast, by Application 2019 & 2032
- Table 118: Rest of Europe GCC Seafoods Market Volume (Tons) Forecast, by Application 2019 & 2032
- Table 119: Global GCC Seafoods Market Revenue Million Forecast, by Type 2019 & 2032
- Table 120: Global GCC Seafoods Market Volume Tons Forecast, by Type 2019 & 2032
- Table 121: Global GCC Seafoods Market Revenue Million Forecast, by Form 2019 & 2032
- Table 122: Global GCC Seafoods Market Volume Tons Forecast, by Form 2019 & 2032
- Table 123: Global GCC Seafoods Market Revenue Million Forecast, by Distribution Channel 2019 & 2032
- Table 124: Global GCC Seafoods Market Volume Tons Forecast, by Distribution Channel 2019 & 2032
- Table 125: Global GCC Seafoods Market Revenue Million Forecast, by Country 2019 & 2032
- Table 126: Global GCC Seafoods Market Volume Tons Forecast, by Country 2019 & 2032
- Table 127: Turkey GCC Seafoods Market Revenue (Million) Forecast, by Application 2019 & 2032
- Table 128: Turkey GCC Seafoods Market Volume (Tons) Forecast, by Application 2019 & 2032
- Table 129: Israel GCC Seafoods Market Revenue (Million) Forecast, by Application 2019 & 2032
- Table 130: Israel GCC Seafoods Market Volume (Tons) Forecast, by Application 2019 & 2032
- Table 131: GCC GCC Seafoods Market Revenue (Million) Forecast, by Application 2019 & 2032
- Table 132: GCC GCC Seafoods Market Volume (Tons) Forecast, by Application 2019 & 2032
- Table 133: North Africa GCC Seafoods Market Revenue (Million) Forecast, by Application 2019 & 2032
- Table 134: North Africa GCC Seafoods Market Volume (Tons) Forecast, by Application 2019 & 2032
- Table 135: South Africa GCC Seafoods Market Revenue (Million) Forecast, by Application 2019 & 2032
- Table 136: South Africa GCC Seafoods Market Volume (Tons) Forecast, by Application 2019 & 2032
- Table 137: Rest of Middle East & Africa GCC Seafoods Market Revenue (Million) Forecast, by Application 2019 & 2032
- Table 138: Rest of Middle East & Africa GCC Seafoods Market Volume (Tons) Forecast, by Application 2019 & 2032
- Table 139: Global GCC Seafoods Market Revenue Million Forecast, by Type 2019 & 2032
- Table 140: Global GCC Seafoods Market Volume Tons Forecast, by Type 2019 & 2032
- Table 141: Global GCC Seafoods Market Revenue Million Forecast, by Form 2019 & 2032
- Table 142: Global GCC Seafoods Market Volume Tons Forecast, by Form 2019 & 2032
- Table 143: Global GCC Seafoods Market Revenue Million Forecast, by Distribution Channel 2019 & 2032
- Table 144: Global GCC Seafoods Market Volume Tons Forecast, by Distribution Channel 2019 & 2032
- Table 145: Global GCC Seafoods Market Revenue Million Forecast, by Country 2019 & 2032
- Table 146: Global GCC Seafoods Market Volume Tons Forecast, by Country 2019 & 2032
- Table 147: China GCC Seafoods Market Revenue (Million) Forecast, by Application 2019 & 2032
- Table 148: China GCC Seafoods Market Volume (Tons) Forecast, by Application 2019 & 2032
- Table 149: India GCC Seafoods Market Revenue (Million) Forecast, by Application 2019 & 2032
- Table 150: India GCC Seafoods Market Volume (Tons) Forecast, by Application 2019 & 2032
- Table 151: Japan GCC Seafoods Market Revenue (Million) Forecast, by Application 2019 & 2032
- Table 152: Japan GCC Seafoods Market Volume (Tons) Forecast, by Application 2019 & 2032
- Table 153: South Korea GCC Seafoods Market Revenue (Million) Forecast, by Application 2019 & 2032
- Table 154: South Korea GCC Seafoods Market Volume (Tons) Forecast, by Application 2019 & 2032
- Table 155: ASEAN GCC Seafoods Market Revenue (Million) Forecast, by Application 2019 & 2032
- Table 156: ASEAN GCC Seafoods Market Volume (Tons) Forecast, by Application 2019 & 2032
- Table 157: Oceania GCC Seafoods Market Revenue (Million) Forecast, by Application 2019 & 2032
- Table 158: Oceania GCC Seafoods Market Volume (Tons) Forecast, by Application 2019 & 2032
- Table 159: Rest of Asia Pacific GCC Seafoods Market Revenue (Million) Forecast, by Application 2019 & 2032
- Table 160: Rest of Asia Pacific GCC Seafoods Market Volume (Tons) Forecast, by Application 2019 & 2032
Frequently Asked Questions
1. What is the projected Compound Annual Growth Rate (CAGR) of the GCC Seafoods Market?
The projected CAGR is approximately 4.20%.
2. Which companies are prominent players in the GCC Seafoods Market?
Key companies in the market include Enhance Group Holding Company Limited, Almunajem Foods, National Fishing Company K S C, Oman Fisheries Co SAOG, Thomsun Group, Sea Pride LLC, Albatha Group, The Deep Seafood Company, Blue Island PLC, Yamama Al-Baida Gen Trading & Cont Est.
3. What are the main segments of the GCC Seafoods Market?
The market segments include Type, Form, Distribution Channel.
4. Can you provide details about the market size?
The market size is estimated to be USD 3.54 Million as of 2022.
5. What are some drivers contributing to market growth?
Escalating Demand for Processed Poultry Products; Favorable Government Initiatives to Boost Production.
6. What are the notable trends driving market growth?
OTHER KEY INDUSTRY TRENDS COVERED IN THE REPORT.
7. Are there any restraints impacting market growth?
Rising Vegan Trend among Young Consumers; Deeper Penetration of Red Meat Across Saudi Arabia.
8. Can you provide examples of recent developments in the market?
May 2022: Gulf Japan Food Fund has invested in Oman Fisheries Co SAOG. This help to take Oman Fisheries' capability to expand its footprint across the global markets.February 2022: Asmak announced a strategic distribution agreement with Fish Farm, a UAE-based aquaculture company. Under this agreement, Asmak distributes fish farm products to capture a wider audience locally and regionally through its processing facility and strong distribution channels, including wholesale, foodservice, and retail.
9. What pricing options are available for accessing the report?
Pricing options include single-user, multi-user, and enterprise licenses priced at USD 3800, USD 4500, and USD 5800 respectively.
10. Is the market size provided in terms of value or volume?
The market size is provided in terms of value, measured in Million and volume, measured in Tons.
11. Are there any specific market keywords associated with the report?
Yes, the market keyword associated with the report is "GCC Seafoods Market," which aids in identifying and referencing the specific market segment covered.
12. How do I determine which pricing option suits my needs best?
The pricing options vary based on user requirements and access needs. Individual users may opt for single-user licenses, while businesses requiring broader access may choose multi-user or enterprise licenses for cost-effective access to the report.
13. Are there any additional resources or data provided in the GCC Seafoods Market report?
While the report offers comprehensive insights, it's advisable to review the specific contents or supplementary materials provided to ascertain if additional resources or data are available.
14. How can I stay updated on further developments or reports in the GCC Seafoods Market?
To stay informed about further developments, trends, and reports in the GCC Seafoods Market, consider subscribing to industry newsletters, following relevant companies and organizations, or regularly checking reputable industry news sources and publications.
Methodology
Step 1 - Identification of Relevant Samples Size from Population Database


Step 2 - Approaches for Defining Global Market Size (Value, Volume* & Price*)

Note*: In applicable scenarios
Step 3 - Data Sources
Primary Research
- Web Analytics
- Survey Reports
- Research Institute
- Latest Research Reports
- Opinion Leaders
Secondary Research
- Annual Reports
- White Paper
- Latest Press Release
- Industry Association
- Paid Database
- Investor Presentations

Step 4 - Data Triangulation
Involves using different sources of information in order to increase the validity of a study
These sources are likely to be stakeholders in a program - participants, other researchers, program staff, other community members, and so on.
Then we put all data in single framework & apply various statistical tools to find out the dynamic on the market.
During the analysis stage, feedback from the stakeholder groups would be compared to determine areas of agreement as well as areas of divergence


