
Key Insights
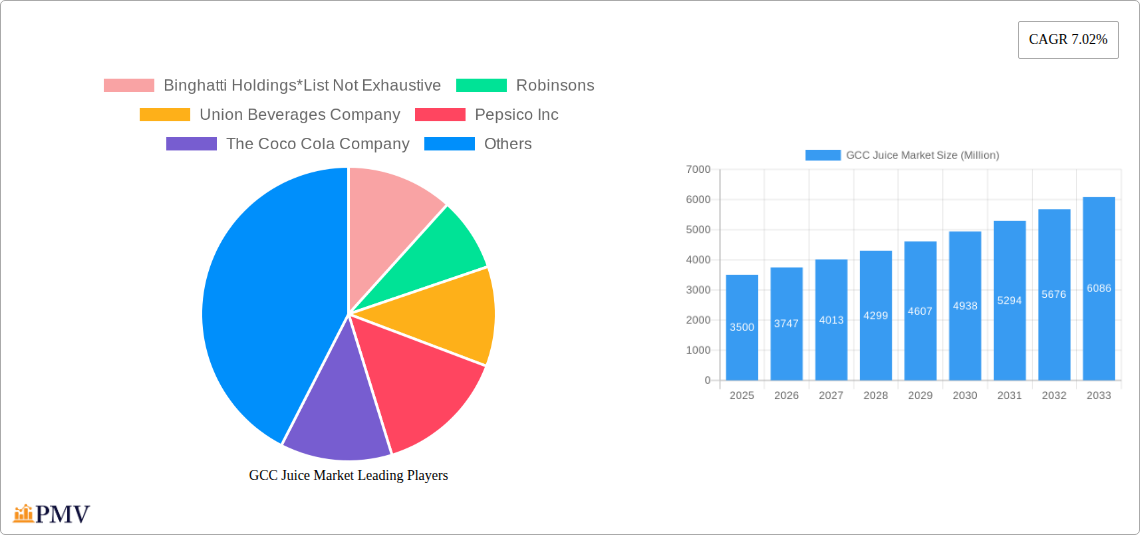
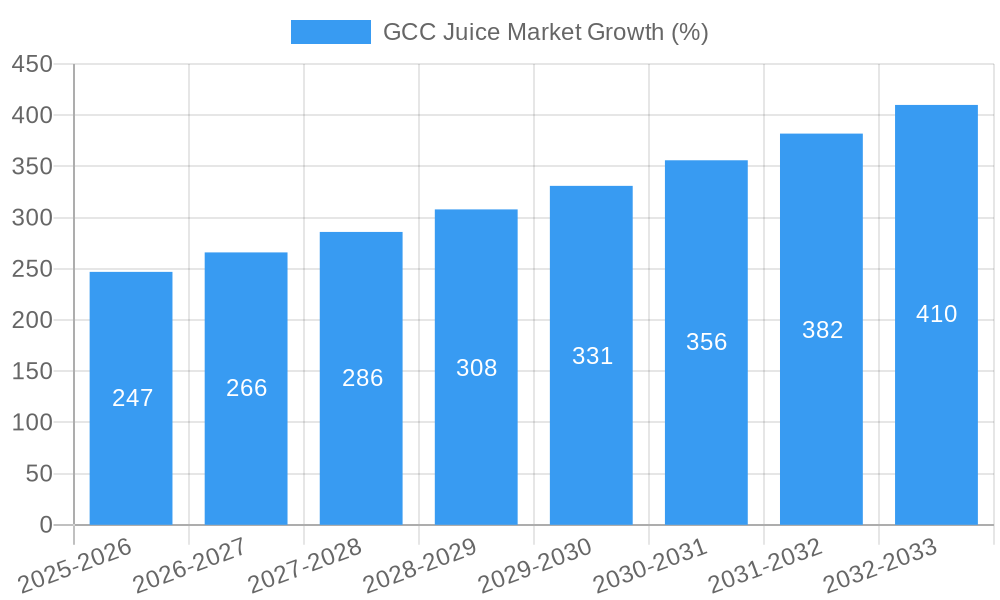
The GCC juice market, valued at $3.5 billion in 2025, is projected to experience robust growth, driven by increasing health consciousness, rising disposable incomes, and the growing popularity of convenient, on-the-go beverages. The market's Compound Annual Growth Rate (CAGR) of 7.02% from 2025 to 2033 indicates significant expansion opportunities. Key drivers include the increasing demand for functional beverages enriched with vitamins and antioxidants, the rising preference for natural and organic juices, and the expanding presence of international and local juice brands within the region. Consumer preference shifts towards healthier lifestyles are fueling this growth, with consumers actively seeking out options that align with their wellness goals. The diverse product portfolio, encompassing fruit juices, vegetable juices, nectars, and other innovative blends, caters to a wide range of consumer tastes and preferences. Distribution channels are diversifying, with supermarkets and hypermarkets remaining dominant, while online stores and convenience stores are experiencing rapid growth, reflecting changing consumer shopping habits and the increasing penetration of e-commerce in the GCC.
Market segmentation reveals significant potential within specific product types and distribution channels. The fruit juice segment is expected to maintain its market dominance due to its widespread appeal and established consumer base. However, the vegetable juice and nectar segments are poised for considerable growth, driven by rising awareness of their nutritional benefits. The expansion of online retail channels presents lucrative avenues for juice companies to enhance their market reach and build direct consumer relationships. Competitive landscape analysis reveals a mix of multinational corporations (PepsiCo, Coca-Cola) and regional players, each leveraging their unique strengths to capture market share. The presence of established local brands alongside global giants indicates a dynamic and competitive market environment. Challenges to growth might include fluctuating fruit prices, stringent regulations regarding food safety and labeling, and increasing competition. Successful players will need to focus on product innovation, efficient supply chain management, and targeted marketing strategies to succeed in this dynamic and evolving market.
GCC Juice Market: A Comprehensive Report (2019-2033)
This comprehensive report provides a detailed analysis of the GCC juice market, encompassing market size, segmentation, competitive landscape, and future growth projections from 2019 to 2033. The study period covers the historical period (2019-2024), the base year (2025), and the forecast period (2025-2033). The report is essential for industry stakeholders, investors, and market researchers seeking actionable insights into this dynamic sector. The estimated market size in 2025 is xx Million.
GCC Juice Market Structure & Competitive Dynamics
The GCC juice market exhibits a moderately concentrated structure, with key players like PepsiCo Inc., The Coca-Cola Company, and Del Monte Foods Inc. holding significant market share. However, a considerable number of regional and local players also contribute to the overall market dynamics. The market is characterized by intense competition, driven by factors such as new product launches, aggressive marketing strategies, and pricing wars.
Innovation in the GCC juice market is primarily focused on product diversification, incorporating natural ingredients, health-conscious formulations, and convenient packaging options. The regulatory framework, while generally supportive of the food and beverage industry, involves stringent quality control and labeling regulations. Product substitutes, such as carbonated drinks and other beverages, pose a significant competitive threat. Consumer trends increasingly favor healthier options, driving demand for functional juices and natural ingredients.
Mergers and acquisitions (M&A) activity in the GCC juice market has been moderate in recent years. While precise deal values are not publicly available for all transactions, significant M&A activities often involve smaller regional players being acquired by larger multinational corporations. For instance, xx Million worth of M&A deals were recorded in 2024, with a majority involving the acquisition of smaller local juice brands by larger international players. This indicates a consolidation trend within the market.
- Market Concentration: Moderately concentrated, with a few dominant players and numerous smaller competitors.
- Innovation: Focus on natural ingredients, functional benefits, and convenient packaging.
- Regulatory Framework: Stringent quality control and labeling regulations.
- Product Substitutes: Carbonated drinks, other non-alcoholic beverages.
- End-User Trends: Growing preference for healthier, natural, and functional juice options.
- M&A Activity: Moderate activity, primarily involving acquisitions of smaller local brands by larger corporations.
GCC Juice Market Industry Trends & Insights
The GCC juice market is witnessing robust growth, driven by several key factors. Rising disposable incomes, changing lifestyles, increasing health awareness, and the growing popularity of convenience foods are contributing to the market's expansion. Technological advancements in processing and packaging are also playing a crucial role. The market is experiencing a shift towards healthier and more convenient beverage options, with a rise in demand for fruit juices with added nutritional benefits and functional ingredients, and ready-to-drink (RTD) formats.
The market exhibits strong growth potential, estimated at a Compound Annual Growth Rate (CAGR) of xx% during the forecast period (2025-2033). Market penetration remains relatively high in major urban areas, with ongoing efforts to expand reach into smaller towns and rural regions. The increasing preference for healthier alternatives and the evolving consumer tastes are key drivers of this market expansion. Competition among industry players remains intense, prompting innovation and marketing strategies to cater to the evolving consumer preferences.
Consumer preferences are significantly influencing market trends, with a growing demand for healthier, organic, and functional juices. This trend is prompting manufacturers to innovate and develop new product lines that cater to the evolving consumer preferences. The technological disruptions in production and distribution, including automation and e-commerce, contribute significantly to the market dynamics.
Dominant Markets & Segments in GCC Juice Market
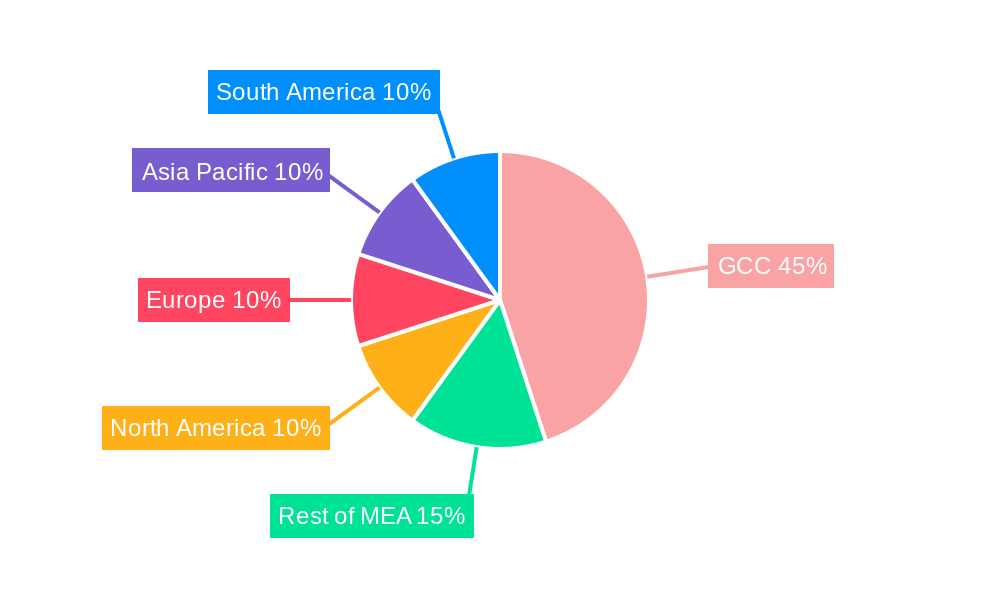
The UAE and Saudi Arabia represent the most significant markets within the GCC region. Their larger populations, higher disposable incomes, and robust retail infrastructure contribute to their dominance. Within the product type segment, fruit juice enjoys the largest market share, followed by nectar and vegetable juice. The "other product types" category exhibits the slowest growth, which is largely attributed to less consumer acceptance and high-end pricing.
- Leading Region/Country: UAE and Saudi Arabia (due to larger population, higher disposable income and well-developed retail infrastructure)
- Leading Product Type: Fruit Juice (high consumer preference and wide availability)
- Leading Distribution Channel: Supermarkets and Hypermarkets (high consumer accessibility and brand visibility)
The dominance of supermarkets and hypermarkets as the leading distribution channel is primarily due to wider consumer reach, established supply chains, and the ability to display a larger variety of products. However, convenience stores and online stores are emerging as rapidly growing channels, especially in densely populated urban areas.
- Key Drivers for Dominant Markets:
- UAE and Saudi Arabia: High disposable incomes, large population, well-established retail infrastructure, strong government support for the food and beverage industry.
- Fruit Juice: High consumer acceptance, wide variety of flavors available.
- Supermarkets/Hypermarkets: Extensive reach, effective supply chain, convenient shopping environment.
GCC Juice Market Product Innovations
Recent product innovations focus on enhancing the nutritional value and convenience of juices. This includes introducing functional juices with added vitamins and antioxidants, using natural sweeteners, and developing ready-to-drink (RTD) packaging for convenient consumption. The market also sees an increase in organic and locally sourced juice offerings to meet the rising consumer demand for healthier options. Technological advancements in juice extraction and preservation techniques contribute to improving the quality and shelf life of the products.
Report Segmentation & Scope
This report segments the GCC juice market based on product type (fruit juice, vegetable juice, nectar, other product types) and distribution channel (supermarkets and hypermarkets, convenience stores, online stores, other distribution channels). Each segment's growth projections, market sizes, and competitive dynamics are analyzed in detail. The report provides insights into the growth potential and market share of each segment based on historical data and future projections. For instance, the fruit juice segment is projected to exhibit the highest growth rate during the forecast period due to the rising preference for natural and healthy options. Similarly, the online store segment is expected to witness significant growth due to growing e-commerce penetration and increasing consumer comfort with online shopping.
Key Drivers of GCC Juice Market Growth
Several factors drive the GCC juice market's growth. The region's expanding population and rising disposable incomes lead to increased consumer spending on food and beverages. Health-conscious consumers are actively seeking healthier beverage alternatives, boosting the demand for fruit and vegetable juices. Government initiatives supporting the local food and beverage industry further promote market expansion. Technological advancements in juice processing and packaging enhance product quality, shelf life, and convenience.
Challenges in the GCC Juice Market Sector
The GCC juice market faces challenges such as fluctuating raw material prices, stringent regulatory compliance requirements, and the presence of substitute beverages. Supply chain disruptions can impact the availability and pricing of raw materials. Intense competition from established international players and local brands necessitates continuous innovation and marketing efforts. The ever changing consumer demands and preferences necessitates product diversification, and maintaining a higher profit margin.
Leading Players in the GCC Juice Market Market
- Binghatti Holdings
- Robinsons
- Union Beverages Company
- Pepsico Inc
- The Coco Cola Company
- The Berry Company
- Go: Organic
- Almrai Company
- Del Monte Foods Inc
- Al Rabie Saudi Foods Co
Key Developments in GCC Juice Market Sector
- November 2021: Star, a UAE beverage company, launched a naturally sweetened fruit drink using Stevia.
- September 2022: Joe & The Juice opened two locations in Dubai.
- October 2022: Pret A Manger opened its first Kuwaiti location.
Strategic GCC Juice Market Market Outlook
The GCC juice market holds significant growth potential driven by increasing health consciousness, evolving consumer preferences, and technological advancements. Strategic opportunities exist for companies to focus on innovative product development, enhancing distribution networks, and leveraging e-commerce platforms. Expanding into new markets within the GCC region and exploring export opportunities can further unlock market potential. The continued focus on healthy and convenient beverage options will remain a key growth accelerator for the GCC juice market.
GCC Juice Market Segmentation
-
1. Product Type
- 1.1. Fruit Juice
- 1.2. Vegetable Juice
- 1.3. Nectar
- 1.4. Other Product Types
-
2. Distribution Channel
- 2.1. Supermarkets and Hypermarkets
- 2.2. Convenience Stores
- 2.3. Online Stores
- 2.4. Other Distribution Channels
-
3. Geography
- 3.1. United Arab Emirates
- 3.2. Saudi Arabia
- 3.3. Qatar
- 3.4. Rest of Gulf Cooperation Council
GCC Juice Market Segmentation By Geography
- 1. United Arab Emirates
- 2. Saudi Arabia
- 3. Qatar
- 4. Rest of Gulf Cooperation Council
GCC Juice Market REPORT HIGHLIGHTS
| Aspects | Details |
|---|---|
| Study Period | 2019-2033 |
| Base Year | 2024 |
| Estimated Year | 2025 |
| Forecast Period | 2025-2033 |
| Historical Period | 2019-2024 |
| Growth Rate | CAGR of 7.02% from 2019-2033 |
| Segmentation |
|
Table of Contents
- 1. Introduction
- 1.1. Research Scope
- 1.2. Market Segmentation
- 1.3. Research Methodology
- 1.4. Definitions and Assumptions
- 2. Executive Summary
- 2.1. Introduction
- 3. Market Dynamics
- 3.1. Introduction
- 3.2. Market Drivers
- 3.2.1. Rising Demand for Clean Label Food & Beverage Products; Rising Demand for Dairy Products
- 3.3. Market Restrains
- 3.3.1. Presence of Preservatives in Ready Meals may Hamper the Market Growth
- 3.4. Market Trends
- 3.4.1. The Changing Pattern of Beverage Consumption among Saudi Consumers
- 4. Market Factor Analysis
- 4.1. Porters Five Forces
- 4.2. Supply/Value Chain
- 4.3. PESTEL analysis
- 4.4. Market Entropy
- 4.5. Patent/Trademark Analysis
- 5. Global GCC Juice Market Analysis, Insights and Forecast, 2019-2031
- 5.1. Market Analysis, Insights and Forecast - by Product Type
- 5.1.1. Fruit Juice
- 5.1.2. Vegetable Juice
- 5.1.3. Nectar
- 5.1.4. Other Product Types
- 5.2. Market Analysis, Insights and Forecast - by Distribution Channel
- 5.2.1. Supermarkets and Hypermarkets
- 5.2.2. Convenience Stores
- 5.2.3. Online Stores
- 5.2.4. Other Distribution Channels
- 5.3. Market Analysis, Insights and Forecast - by Geography
- 5.3.1. United Arab Emirates
- 5.3.2. Saudi Arabia
- 5.3.3. Qatar
- 5.3.4. Rest of Gulf Cooperation Council
- 5.4. Market Analysis, Insights and Forecast - by Region
- 5.4.1. United Arab Emirates
- 5.4.2. Saudi Arabia
- 5.4.3. Qatar
- 5.4.4. Rest of Gulf Cooperation Council
- 5.1. Market Analysis, Insights and Forecast - by Product Type
- 6. United Arab Emirates GCC Juice Market Analysis, Insights and Forecast, 2019-2031
- 6.1. Market Analysis, Insights and Forecast - by Product Type
- 6.1.1. Fruit Juice
- 6.1.2. Vegetable Juice
- 6.1.3. Nectar
- 6.1.4. Other Product Types
- 6.2. Market Analysis, Insights and Forecast - by Distribution Channel
- 6.2.1. Supermarkets and Hypermarkets
- 6.2.2. Convenience Stores
- 6.2.3. Online Stores
- 6.2.4. Other Distribution Channels
- 6.3. Market Analysis, Insights and Forecast - by Geography
- 6.3.1. United Arab Emirates
- 6.3.2. Saudi Arabia
- 6.3.3. Qatar
- 6.3.4. Rest of Gulf Cooperation Council
- 6.1. Market Analysis, Insights and Forecast - by Product Type
- 7. Saudi Arabia GCC Juice Market Analysis, Insights and Forecast, 2019-2031
- 7.1. Market Analysis, Insights and Forecast - by Product Type
- 7.1.1. Fruit Juice
- 7.1.2. Vegetable Juice
- 7.1.3. Nectar
- 7.1.4. Other Product Types
- 7.2. Market Analysis, Insights and Forecast - by Distribution Channel
- 7.2.1. Supermarkets and Hypermarkets
- 7.2.2. Convenience Stores
- 7.2.3. Online Stores
- 7.2.4. Other Distribution Channels
- 7.3. Market Analysis, Insights and Forecast - by Geography
- 7.3.1. United Arab Emirates
- 7.3.2. Saudi Arabia
- 7.3.3. Qatar
- 7.3.4. Rest of Gulf Cooperation Council
- 7.1. Market Analysis, Insights and Forecast - by Product Type
- 8. Qatar GCC Juice Market Analysis, Insights and Forecast, 2019-2031
- 8.1. Market Analysis, Insights and Forecast - by Product Type
- 8.1.1. Fruit Juice
- 8.1.2. Vegetable Juice
- 8.1.3. Nectar
- 8.1.4. Other Product Types
- 8.2. Market Analysis, Insights and Forecast - by Distribution Channel
- 8.2.1. Supermarkets and Hypermarkets
- 8.2.2. Convenience Stores
- 8.2.3. Online Stores
- 8.2.4. Other Distribution Channels
- 8.3. Market Analysis, Insights and Forecast - by Geography
- 8.3.1. United Arab Emirates
- 8.3.2. Saudi Arabia
- 8.3.3. Qatar
- 8.3.4. Rest of Gulf Cooperation Council
- 8.1. Market Analysis, Insights and Forecast - by Product Type
- 9. Rest of Gulf Cooperation Council GCC Juice Market Analysis, Insights and Forecast, 2019-2031
- 9.1. Market Analysis, Insights and Forecast - by Product Type
- 9.1.1. Fruit Juice
- 9.1.2. Vegetable Juice
- 9.1.3. Nectar
- 9.1.4. Other Product Types
- 9.2. Market Analysis, Insights and Forecast - by Distribution Channel
- 9.2.1. Supermarkets and Hypermarkets
- 9.2.2. Convenience Stores
- 9.2.3. Online Stores
- 9.2.4. Other Distribution Channels
- 9.3. Market Analysis, Insights and Forecast - by Geography
- 9.3.1. United Arab Emirates
- 9.3.2. Saudi Arabia
- 9.3.3. Qatar
- 9.3.4. Rest of Gulf Cooperation Council
- 9.1. Market Analysis, Insights and Forecast - by Product Type
- 10. North America GCC Juice Market Analysis, Insights and Forecast, 2019-2031
- 10.1. Market Analysis, Insights and Forecast - By Country/Sub-region
- 10.1.1 United States
- 10.1.2 Canada
- 10.1.3 Mexico
- 11. Europe GCC Juice Market Analysis, Insights and Forecast, 2019-2031
- 11.1. Market Analysis, Insights and Forecast - By Country/Sub-region
- 11.1.1 Germany
- 11.1.2 United Kingdom
- 11.1.3 France
- 11.1.4 Spain
- 11.1.5 Italy
- 11.1.6 Spain
- 11.1.7 Belgium
- 11.1.8 Netherland
- 11.1.9 Nordics
- 11.1.10 Rest of Europe
- 12. Asia Pacific GCC Juice Market Analysis, Insights and Forecast, 2019-2031
- 12.1. Market Analysis, Insights and Forecast - By Country/Sub-region
- 12.1.1 China
- 12.1.2 Japan
- 12.1.3 India
- 12.1.4 South Korea
- 12.1.5 Southeast Asia
- 12.1.6 Australia
- 12.1.7 Indonesia
- 12.1.8 Phillipes
- 12.1.9 Singapore
- 12.1.10 Thailandc
- 12.1.11 Rest of Asia Pacific
- 13. South America GCC Juice Market Analysis, Insights and Forecast, 2019-2031
- 13.1. Market Analysis, Insights and Forecast - By Country/Sub-region
- 13.1.1 Brazil
- 13.1.2 Argentina
- 13.1.3 Peru
- 13.1.4 Chile
- 13.1.5 Colombia
- 13.1.6 Ecuador
- 13.1.7 Venezuela
- 13.1.8 Rest of South America
- 14. North America GCC Juice Market Analysis, Insights and Forecast, 2019-2031
- 14.1. Market Analysis, Insights and Forecast - By Country/Sub-region
- 14.1.1 United States
- 14.1.2 Canada
- 14.1.3 Mexico
- 15. MEA GCC Juice Market Analysis, Insights and Forecast, 2019-2031
- 15.1. Market Analysis, Insights and Forecast - By Country/Sub-region
- 15.1.1 United Arab Emirates
- 15.1.2 Saudi Arabia
- 15.1.3 South Africa
- 15.1.4 Rest of Middle East and Africa
- 16. Competitive Analysis
- 16.1. Global Market Share Analysis 2024
- 16.2. Company Profiles
- 16.2.1 Binghatti Holdings*List Not Exhaustive
- 16.2.1.1. Overview
- 16.2.1.2. Products
- 16.2.1.3. SWOT Analysis
- 16.2.1.4. Recent Developments
- 16.2.1.5. Financials (Based on Availability)
- 16.2.2 Robinsons
- 16.2.2.1. Overview
- 16.2.2.2. Products
- 16.2.2.3. SWOT Analysis
- 16.2.2.4. Recent Developments
- 16.2.2.5. Financials (Based on Availability)
- 16.2.3 Union Beverages Company
- 16.2.3.1. Overview
- 16.2.3.2. Products
- 16.2.3.3. SWOT Analysis
- 16.2.3.4. Recent Developments
- 16.2.3.5. Financials (Based on Availability)
- 16.2.4 Pepsico Inc
- 16.2.4.1. Overview
- 16.2.4.2. Products
- 16.2.4.3. SWOT Analysis
- 16.2.4.4. Recent Developments
- 16.2.4.5. Financials (Based on Availability)
- 16.2.5 The Coco Cola Company
- 16.2.5.1. Overview
- 16.2.5.2. Products
- 16.2.5.3. SWOT Analysis
- 16.2.5.4. Recent Developments
- 16.2.5.5. Financials (Based on Availability)
- 16.2.6 The Berry Company
- 16.2.6.1. Overview
- 16.2.6.2. Products
- 16.2.6.3. SWOT Analysis
- 16.2.6.4. Recent Developments
- 16.2.6.5. Financials (Based on Availability)
- 16.2.7 Go
- 16.2.7.1. Overview
- 16.2.7.2. Products
- 16.2.7.3. SWOT Analysis
- 16.2.7.4. Recent Developments
- 16.2.7.5. Financials (Based on Availability)
- 16.2.1 Binghatti Holdings*List Not Exhaustive
List of Figures
- Figure 1: Global GCC Juice Market Revenue Breakdown (Million, %) by Region 2024 & 2032
- Figure 2: Global GCC Juice Market Volume Breakdown (Liters, %) by Region 2024 & 2032
- Figure 3: North America GCC Juice Market Revenue (Million), by Country 2024 & 2032
- Figure 4: North America GCC Juice Market Volume (Liters), by Country 2024 & 2032
- Figure 5: North America GCC Juice Market Revenue Share (%), by Country 2024 & 2032
- Figure 6: North America GCC Juice Market Volume Share (%), by Country 2024 & 2032
- Figure 7: Europe GCC Juice Market Revenue (Million), by Country 2024 & 2032
- Figure 8: Europe GCC Juice Market Volume (Liters), by Country 2024 & 2032
- Figure 9: Europe GCC Juice Market Revenue Share (%), by Country 2024 & 2032
- Figure 10: Europe GCC Juice Market Volume Share (%), by Country 2024 & 2032
- Figure 11: Asia Pacific GCC Juice Market Revenue (Million), by Country 2024 & 2032
- Figure 12: Asia Pacific GCC Juice Market Volume (Liters), by Country 2024 & 2032
- Figure 13: Asia Pacific GCC Juice Market Revenue Share (%), by Country 2024 & 2032
- Figure 14: Asia Pacific GCC Juice Market Volume Share (%), by Country 2024 & 2032
- Figure 15: South America GCC Juice Market Revenue (Million), by Country 2024 & 2032
- Figure 16: South America GCC Juice Market Volume (Liters), by Country 2024 & 2032
- Figure 17: South America GCC Juice Market Revenue Share (%), by Country 2024 & 2032
- Figure 18: South America GCC Juice Market Volume Share (%), by Country 2024 & 2032
- Figure 19: North America GCC Juice Market Revenue (Million), by Country 2024 & 2032
- Figure 20: North America GCC Juice Market Volume (Liters), by Country 2024 & 2032
- Figure 21: North America GCC Juice Market Revenue Share (%), by Country 2024 & 2032
- Figure 22: North America GCC Juice Market Volume Share (%), by Country 2024 & 2032
- Figure 23: MEA GCC Juice Market Revenue (Million), by Country 2024 & 2032
- Figure 24: MEA GCC Juice Market Volume (Liters), by Country 2024 & 2032
- Figure 25: MEA GCC Juice Market Revenue Share (%), by Country 2024 & 2032
- Figure 26: MEA GCC Juice Market Volume Share (%), by Country 2024 & 2032
- Figure 27: United Arab Emirates GCC Juice Market Revenue (Million), by Product Type 2024 & 2032
- Figure 28: United Arab Emirates GCC Juice Market Volume (Liters), by Product Type 2024 & 2032
- Figure 29: United Arab Emirates GCC Juice Market Revenue Share (%), by Product Type 2024 & 2032
- Figure 30: United Arab Emirates GCC Juice Market Volume Share (%), by Product Type 2024 & 2032
- Figure 31: United Arab Emirates GCC Juice Market Revenue (Million), by Distribution Channel 2024 & 2032
- Figure 32: United Arab Emirates GCC Juice Market Volume (Liters), by Distribution Channel 2024 & 2032
- Figure 33: United Arab Emirates GCC Juice Market Revenue Share (%), by Distribution Channel 2024 & 2032
- Figure 34: United Arab Emirates GCC Juice Market Volume Share (%), by Distribution Channel 2024 & 2032
- Figure 35: United Arab Emirates GCC Juice Market Revenue (Million), by Geography 2024 & 2032
- Figure 36: United Arab Emirates GCC Juice Market Volume (Liters), by Geography 2024 & 2032
- Figure 37: United Arab Emirates GCC Juice Market Revenue Share (%), by Geography 2024 & 2032
- Figure 38: United Arab Emirates GCC Juice Market Volume Share (%), by Geography 2024 & 2032
- Figure 39: United Arab Emirates GCC Juice Market Revenue (Million), by Country 2024 & 2032
- Figure 40: United Arab Emirates GCC Juice Market Volume (Liters), by Country 2024 & 2032
- Figure 41: United Arab Emirates GCC Juice Market Revenue Share (%), by Country 2024 & 2032
- Figure 42: United Arab Emirates GCC Juice Market Volume Share (%), by Country 2024 & 2032
- Figure 43: Saudi Arabia GCC Juice Market Revenue (Million), by Product Type 2024 & 2032
- Figure 44: Saudi Arabia GCC Juice Market Volume (Liters), by Product Type 2024 & 2032
- Figure 45: Saudi Arabia GCC Juice Market Revenue Share (%), by Product Type 2024 & 2032
- Figure 46: Saudi Arabia GCC Juice Market Volume Share (%), by Product Type 2024 & 2032
- Figure 47: Saudi Arabia GCC Juice Market Revenue (Million), by Distribution Channel 2024 & 2032
- Figure 48: Saudi Arabia GCC Juice Market Volume (Liters), by Distribution Channel 2024 & 2032
- Figure 49: Saudi Arabia GCC Juice Market Revenue Share (%), by Distribution Channel 2024 & 2032
- Figure 50: Saudi Arabia GCC Juice Market Volume Share (%), by Distribution Channel 2024 & 2032
- Figure 51: Saudi Arabia GCC Juice Market Revenue (Million), by Geography 2024 & 2032
- Figure 52: Saudi Arabia GCC Juice Market Volume (Liters), by Geography 2024 & 2032
- Figure 53: Saudi Arabia GCC Juice Market Revenue Share (%), by Geography 2024 & 2032
- Figure 54: Saudi Arabia GCC Juice Market Volume Share (%), by Geography 2024 & 2032
- Figure 55: Saudi Arabia GCC Juice Market Revenue (Million), by Country 2024 & 2032
- Figure 56: Saudi Arabia GCC Juice Market Volume (Liters), by Country 2024 & 2032
- Figure 57: Saudi Arabia GCC Juice Market Revenue Share (%), by Country 2024 & 2032
- Figure 58: Saudi Arabia GCC Juice Market Volume Share (%), by Country 2024 & 2032
- Figure 59: Qatar GCC Juice Market Revenue (Million), by Product Type 2024 & 2032
- Figure 60: Qatar GCC Juice Market Volume (Liters), by Product Type 2024 & 2032
- Figure 61: Qatar GCC Juice Market Revenue Share (%), by Product Type 2024 & 2032
- Figure 62: Qatar GCC Juice Market Volume Share (%), by Product Type 2024 & 2032
- Figure 63: Qatar GCC Juice Market Revenue (Million), by Distribution Channel 2024 & 2032
- Figure 64: Qatar GCC Juice Market Volume (Liters), by Distribution Channel 2024 & 2032
- Figure 65: Qatar GCC Juice Market Revenue Share (%), by Distribution Channel 2024 & 2032
- Figure 66: Qatar GCC Juice Market Volume Share (%), by Distribution Channel 2024 & 2032
- Figure 67: Qatar GCC Juice Market Revenue (Million), by Geography 2024 & 2032
- Figure 68: Qatar GCC Juice Market Volume (Liters), by Geography 2024 & 2032
- Figure 69: Qatar GCC Juice Market Revenue Share (%), by Geography 2024 & 2032
- Figure 70: Qatar GCC Juice Market Volume Share (%), by Geography 2024 & 2032
- Figure 71: Qatar GCC Juice Market Revenue (Million), by Country 2024 & 2032
- Figure 72: Qatar GCC Juice Market Volume (Liters), by Country 2024 & 2032
- Figure 73: Qatar GCC Juice Market Revenue Share (%), by Country 2024 & 2032
- Figure 74: Qatar GCC Juice Market Volume Share (%), by Country 2024 & 2032
- Figure 75: Rest of Gulf Cooperation Council GCC Juice Market Revenue (Million), by Product Type 2024 & 2032
- Figure 76: Rest of Gulf Cooperation Council GCC Juice Market Volume (Liters), by Product Type 2024 & 2032
- Figure 77: Rest of Gulf Cooperation Council GCC Juice Market Revenue Share (%), by Product Type 2024 & 2032
- Figure 78: Rest of Gulf Cooperation Council GCC Juice Market Volume Share (%), by Product Type 2024 & 2032
- Figure 79: Rest of Gulf Cooperation Council GCC Juice Market Revenue (Million), by Distribution Channel 2024 & 2032
- Figure 80: Rest of Gulf Cooperation Council GCC Juice Market Volume (Liters), by Distribution Channel 2024 & 2032
- Figure 81: Rest of Gulf Cooperation Council GCC Juice Market Revenue Share (%), by Distribution Channel 2024 & 2032
- Figure 82: Rest of Gulf Cooperation Council GCC Juice Market Volume Share (%), by Distribution Channel 2024 & 2032
- Figure 83: Rest of Gulf Cooperation Council GCC Juice Market Revenue (Million), by Geography 2024 & 2032
- Figure 84: Rest of Gulf Cooperation Council GCC Juice Market Volume (Liters), by Geography 2024 & 2032
- Figure 85: Rest of Gulf Cooperation Council GCC Juice Market Revenue Share (%), by Geography 2024 & 2032
- Figure 86: Rest of Gulf Cooperation Council GCC Juice Market Volume Share (%), by Geography 2024 & 2032
- Figure 87: Rest of Gulf Cooperation Council GCC Juice Market Revenue (Million), by Country 2024 & 2032
- Figure 88: Rest of Gulf Cooperation Council GCC Juice Market Volume (Liters), by Country 2024 & 2032
- Figure 89: Rest of Gulf Cooperation Council GCC Juice Market Revenue Share (%), by Country 2024 & 2032
- Figure 90: Rest of Gulf Cooperation Council GCC Juice Market Volume Share (%), by Country 2024 & 2032
List of Tables
- Table 1: Global GCC Juice Market Revenue Million Forecast, by Region 2019 & 2032
- Table 2: Global GCC Juice Market Volume Liters Forecast, by Region 2019 & 2032
- Table 3: Global GCC Juice Market Revenue Million Forecast, by Product Type 2019 & 2032
- Table 4: Global GCC Juice Market Volume Liters Forecast, by Product Type 2019 & 2032
- Table 5: Global GCC Juice Market Revenue Million Forecast, by Distribution Channel 2019 & 2032
- Table 6: Global GCC Juice Market Volume Liters Forecast, by Distribution Channel 2019 & 2032
- Table 7: Global GCC Juice Market Revenue Million Forecast, by Geography 2019 & 2032
- Table 8: Global GCC Juice Market Volume Liters Forecast, by Geography 2019 & 2032
- Table 9: Global GCC Juice Market Revenue Million Forecast, by Region 2019 & 2032
- Table 10: Global GCC Juice Market Volume Liters Forecast, by Region 2019 & 2032
- Table 11: Global GCC Juice Market Revenue Million Forecast, by Country 2019 & 2032
- Table 12: Global GCC Juice Market Volume Liters Forecast, by Country 2019 & 2032
- Table 13: United States GCC Juice Market Revenue (Million) Forecast, by Application 2019 & 2032
- Table 14: United States GCC Juice Market Volume (Liters) Forecast, by Application 2019 & 2032
- Table 15: Canada GCC Juice Market Revenue (Million) Forecast, by Application 2019 & 2032
- Table 16: Canada GCC Juice Market Volume (Liters) Forecast, by Application 2019 & 2032
- Table 17: Mexico GCC Juice Market Revenue (Million) Forecast, by Application 2019 & 2032
- Table 18: Mexico GCC Juice Market Volume (Liters) Forecast, by Application 2019 & 2032
- Table 19: Global GCC Juice Market Revenue Million Forecast, by Country 2019 & 2032
- Table 20: Global GCC Juice Market Volume Liters Forecast, by Country 2019 & 2032
- Table 21: Germany GCC Juice Market Revenue (Million) Forecast, by Application 2019 & 2032
- Table 22: Germany GCC Juice Market Volume (Liters) Forecast, by Application 2019 & 2032
- Table 23: United Kingdom GCC Juice Market Revenue (Million) Forecast, by Application 2019 & 2032
- Table 24: United Kingdom GCC Juice Market Volume (Liters) Forecast, by Application 2019 & 2032
- Table 25: France GCC Juice Market Revenue (Million) Forecast, by Application 2019 & 2032
- Table 26: France GCC Juice Market Volume (Liters) Forecast, by Application 2019 & 2032
- Table 27: Spain GCC Juice Market Revenue (Million) Forecast, by Application 2019 & 2032
- Table 28: Spain GCC Juice Market Volume (Liters) Forecast, by Application 2019 & 2032
- Table 29: Italy GCC Juice Market Revenue (Million) Forecast, by Application 2019 & 2032
- Table 30: Italy GCC Juice Market Volume (Liters) Forecast, by Application 2019 & 2032
- Table 31: Spain GCC Juice Market Revenue (Million) Forecast, by Application 2019 & 2032
- Table 32: Spain GCC Juice Market Volume (Liters) Forecast, by Application 2019 & 2032
- Table 33: Belgium GCC Juice Market Revenue (Million) Forecast, by Application 2019 & 2032
- Table 34: Belgium GCC Juice Market Volume (Liters) Forecast, by Application 2019 & 2032
- Table 35: Netherland GCC Juice Market Revenue (Million) Forecast, by Application 2019 & 2032
- Table 36: Netherland GCC Juice Market Volume (Liters) Forecast, by Application 2019 & 2032
- Table 37: Nordics GCC Juice Market Revenue (Million) Forecast, by Application 2019 & 2032
- Table 38: Nordics GCC Juice Market Volume (Liters) Forecast, by Application 2019 & 2032
- Table 39: Rest of Europe GCC Juice Market Revenue (Million) Forecast, by Application 2019 & 2032
- Table 40: Rest of Europe GCC Juice Market Volume (Liters) Forecast, by Application 2019 & 2032
- Table 41: Global GCC Juice Market Revenue Million Forecast, by Country 2019 & 2032
- Table 42: Global GCC Juice Market Volume Liters Forecast, by Country 2019 & 2032
- Table 43: China GCC Juice Market Revenue (Million) Forecast, by Application 2019 & 2032
- Table 44: China GCC Juice Market Volume (Liters) Forecast, by Application 2019 & 2032
- Table 45: Japan GCC Juice Market Revenue (Million) Forecast, by Application 2019 & 2032
- Table 46: Japan GCC Juice Market Volume (Liters) Forecast, by Application 2019 & 2032
- Table 47: India GCC Juice Market Revenue (Million) Forecast, by Application 2019 & 2032
- Table 48: India GCC Juice Market Volume (Liters) Forecast, by Application 2019 & 2032
- Table 49: South Korea GCC Juice Market Revenue (Million) Forecast, by Application 2019 & 2032
- Table 50: South Korea GCC Juice Market Volume (Liters) Forecast, by Application 2019 & 2032
- Table 51: Southeast Asia GCC Juice Market Revenue (Million) Forecast, by Application 2019 & 2032
- Table 52: Southeast Asia GCC Juice Market Volume (Liters) Forecast, by Application 2019 & 2032
- Table 53: Australia GCC Juice Market Revenue (Million) Forecast, by Application 2019 & 2032
- Table 54: Australia GCC Juice Market Volume (Liters) Forecast, by Application 2019 & 2032
- Table 55: Indonesia GCC Juice Market Revenue (Million) Forecast, by Application 2019 & 2032
- Table 56: Indonesia GCC Juice Market Volume (Liters) Forecast, by Application 2019 & 2032
- Table 57: Phillipes GCC Juice Market Revenue (Million) Forecast, by Application 2019 & 2032
- Table 58: Phillipes GCC Juice Market Volume (Liters) Forecast, by Application 2019 & 2032
- Table 59: Singapore GCC Juice Market Revenue (Million) Forecast, by Application 2019 & 2032
- Table 60: Singapore GCC Juice Market Volume (Liters) Forecast, by Application 2019 & 2032
- Table 61: Thailandc GCC Juice Market Revenue (Million) Forecast, by Application 2019 & 2032
- Table 62: Thailandc GCC Juice Market Volume (Liters) Forecast, by Application 2019 & 2032
- Table 63: Rest of Asia Pacific GCC Juice Market Revenue (Million) Forecast, by Application 2019 & 2032
- Table 64: Rest of Asia Pacific GCC Juice Market Volume (Liters) Forecast, by Application 2019 & 2032
- Table 65: Global GCC Juice Market Revenue Million Forecast, by Country 2019 & 2032
- Table 66: Global GCC Juice Market Volume Liters Forecast, by Country 2019 & 2032
- Table 67: Brazil GCC Juice Market Revenue (Million) Forecast, by Application 2019 & 2032
- Table 68: Brazil GCC Juice Market Volume (Liters) Forecast, by Application 2019 & 2032
- Table 69: Argentina GCC Juice Market Revenue (Million) Forecast, by Application 2019 & 2032
- Table 70: Argentina GCC Juice Market Volume (Liters) Forecast, by Application 2019 & 2032
- Table 71: Peru GCC Juice Market Revenue (Million) Forecast, by Application 2019 & 2032
- Table 72: Peru GCC Juice Market Volume (Liters) Forecast, by Application 2019 & 2032
- Table 73: Chile GCC Juice Market Revenue (Million) Forecast, by Application 2019 & 2032
- Table 74: Chile GCC Juice Market Volume (Liters) Forecast, by Application 2019 & 2032
- Table 75: Colombia GCC Juice Market Revenue (Million) Forecast, by Application 2019 & 2032
- Table 76: Colombia GCC Juice Market Volume (Liters) Forecast, by Application 2019 & 2032
- Table 77: Ecuador GCC Juice Market Revenue (Million) Forecast, by Application 2019 & 2032
- Table 78: Ecuador GCC Juice Market Volume (Liters) Forecast, by Application 2019 & 2032
- Table 79: Venezuela GCC Juice Market Revenue (Million) Forecast, by Application 2019 & 2032
- Table 80: Venezuela GCC Juice Market Volume (Liters) Forecast, by Application 2019 & 2032
- Table 81: Rest of South America GCC Juice Market Revenue (Million) Forecast, by Application 2019 & 2032
- Table 82: Rest of South America GCC Juice Market Volume (Liters) Forecast, by Application 2019 & 2032
- Table 83: Global GCC Juice Market Revenue Million Forecast, by Country 2019 & 2032
- Table 84: Global GCC Juice Market Volume Liters Forecast, by Country 2019 & 2032
- Table 85: United States GCC Juice Market Revenue (Million) Forecast, by Application 2019 & 2032
- Table 86: United States GCC Juice Market Volume (Liters) Forecast, by Application 2019 & 2032
- Table 87: Canada GCC Juice Market Revenue (Million) Forecast, by Application 2019 & 2032
- Table 88: Canada GCC Juice Market Volume (Liters) Forecast, by Application 2019 & 2032
- Table 89: Mexico GCC Juice Market Revenue (Million) Forecast, by Application 2019 & 2032
- Table 90: Mexico GCC Juice Market Volume (Liters) Forecast, by Application 2019 & 2032
- Table 91: Global GCC Juice Market Revenue Million Forecast, by Country 2019 & 2032
- Table 92: Global GCC Juice Market Volume Liters Forecast, by Country 2019 & 2032
- Table 93: United Arab Emirates GCC Juice Market Revenue (Million) Forecast, by Application 2019 & 2032
- Table 94: United Arab Emirates GCC Juice Market Volume (Liters) Forecast, by Application 2019 & 2032
- Table 95: Saudi Arabia GCC Juice Market Revenue (Million) Forecast, by Application 2019 & 2032
- Table 96: Saudi Arabia GCC Juice Market Volume (Liters) Forecast, by Application 2019 & 2032
- Table 97: South Africa GCC Juice Market Revenue (Million) Forecast, by Application 2019 & 2032
- Table 98: South Africa GCC Juice Market Volume (Liters) Forecast, by Application 2019 & 2032
- Table 99: Rest of Middle East and Africa GCC Juice Market Revenue (Million) Forecast, by Application 2019 & 2032
- Table 100: Rest of Middle East and Africa GCC Juice Market Volume (Liters) Forecast, by Application 2019 & 2032
- Table 101: Global GCC Juice Market Revenue Million Forecast, by Product Type 2019 & 2032
- Table 102: Global GCC Juice Market Volume Liters Forecast, by Product Type 2019 & 2032
- Table 103: Global GCC Juice Market Revenue Million Forecast, by Distribution Channel 2019 & 2032
- Table 104: Global GCC Juice Market Volume Liters Forecast, by Distribution Channel 2019 & 2032
- Table 105: Global GCC Juice Market Revenue Million Forecast, by Geography 2019 & 2032
- Table 106: Global GCC Juice Market Volume Liters Forecast, by Geography 2019 & 2032
- Table 107: Global GCC Juice Market Revenue Million Forecast, by Country 2019 & 2032
- Table 108: Global GCC Juice Market Volume Liters Forecast, by Country 2019 & 2032
- Table 109: Global GCC Juice Market Revenue Million Forecast, by Product Type 2019 & 2032
- Table 110: Global GCC Juice Market Volume Liters Forecast, by Product Type 2019 & 2032
- Table 111: Global GCC Juice Market Revenue Million Forecast, by Distribution Channel 2019 & 2032
- Table 112: Global GCC Juice Market Volume Liters Forecast, by Distribution Channel 2019 & 2032
- Table 113: Global GCC Juice Market Revenue Million Forecast, by Geography 2019 & 2032
- Table 114: Global GCC Juice Market Volume Liters Forecast, by Geography 2019 & 2032
- Table 115: Global GCC Juice Market Revenue Million Forecast, by Country 2019 & 2032
- Table 116: Global GCC Juice Market Volume Liters Forecast, by Country 2019 & 2032
- Table 117: Global GCC Juice Market Revenue Million Forecast, by Product Type 2019 & 2032
- Table 118: Global GCC Juice Market Volume Liters Forecast, by Product Type 2019 & 2032
- Table 119: Global GCC Juice Market Revenue Million Forecast, by Distribution Channel 2019 & 2032
- Table 120: Global GCC Juice Market Volume Liters Forecast, by Distribution Channel 2019 & 2032
- Table 121: Global GCC Juice Market Revenue Million Forecast, by Geography 2019 & 2032
- Table 122: Global GCC Juice Market Volume Liters Forecast, by Geography 2019 & 2032
- Table 123: Global GCC Juice Market Revenue Million Forecast, by Country 2019 & 2032
- Table 124: Global GCC Juice Market Volume Liters Forecast, by Country 2019 & 2032
- Table 125: Global GCC Juice Market Revenue Million Forecast, by Product Type 2019 & 2032
- Table 126: Global GCC Juice Market Volume Liters Forecast, by Product Type 2019 & 2032
- Table 127: Global GCC Juice Market Revenue Million Forecast, by Distribution Channel 2019 & 2032
- Table 128: Global GCC Juice Market Volume Liters Forecast, by Distribution Channel 2019 & 2032
- Table 129: Global GCC Juice Market Revenue Million Forecast, by Geography 2019 & 2032
- Table 130: Global GCC Juice Market Volume Liters Forecast, by Geography 2019 & 2032
- Table 131: Global GCC Juice Market Revenue Million Forecast, by Country 2019 & 2032
- Table 132: Global GCC Juice Market Volume Liters Forecast, by Country 2019 & 2032
Frequently Asked Questions
1. What is the projected Compound Annual Growth Rate (CAGR) of the GCC Juice Market?
The projected CAGR is approximately 7.02%.
2. Which companies are prominent players in the GCC Juice Market?
Key companies in the market include Binghatti Holdings*List Not Exhaustive, Robinsons, Union Beverages Company, Pepsico Inc, The Coco Cola Company, The Berry Company, Go: Organic, Almrai Company, Del Monte Foods Inc, Al Rabie Saudi Foods Co.
3. What are the main segments of the GCC Juice Market?
The market segments include Product Type, Distribution Channel, Geography.
4. Can you provide details about the market size?
The market size is estimated to be USD 3.5 Million as of 2022.
5. What are some drivers contributing to market growth?
Rising Demand for Clean Label Food & Beverage Products; Rising Demand for Dairy Products.
6. What are the notable trends driving market growth?
The Changing Pattern of Beverage Consumption among Saudi Consumers.
7. Are there any restraints impacting market growth?
Presence of Preservatives in Ready Meals may Hamper the Market Growth.
8. Can you provide examples of recent developments in the market?
In October 2022, Pret A Manger opened its first location in Kuwait and plans to increase the number of its global stores by 2026. The location was opened by Kuwaiti franchise partner One PM at the Al Hamra Business Tower in the nation's capital.
9. What pricing options are available for accessing the report?
Pricing options include single-user, multi-user, and enterprise licenses priced at USD 4750, USD 5250, and USD 8750 respectively.
10. Is the market size provided in terms of value or volume?
The market size is provided in terms of value, measured in Million and volume, measured in Liters.
11. Are there any specific market keywords associated with the report?
Yes, the market keyword associated with the report is "GCC Juice Market," which aids in identifying and referencing the specific market segment covered.
12. How do I determine which pricing option suits my needs best?
The pricing options vary based on user requirements and access needs. Individual users may opt for single-user licenses, while businesses requiring broader access may choose multi-user or enterprise licenses for cost-effective access to the report.
13. Are there any additional resources or data provided in the GCC Juice Market report?
While the report offers comprehensive insights, it's advisable to review the specific contents or supplementary materials provided to ascertain if additional resources or data are available.
14. How can I stay updated on further developments or reports in the GCC Juice Market?
To stay informed about further developments, trends, and reports in the GCC Juice Market, consider subscribing to industry newsletters, following relevant companies and organizations, or regularly checking reputable industry news sources and publications.
Methodology
Step 1 - Identification of Relevant Samples Size from Population Database


Step 2 - Approaches for Defining Global Market Size (Value, Volume* & Price*)

Note*: In applicable scenarios
Step 3 - Data Sources
Primary Research
- Web Analytics
- Survey Reports
- Research Institute
- Latest Research Reports
- Opinion Leaders
Secondary Research
- Annual Reports
- White Paper
- Latest Press Release
- Industry Association
- Paid Database
- Investor Presentations

Step 4 - Data Triangulation
Involves using different sources of information in order to increase the validity of a study
These sources are likely to be stakeholders in a program - participants, other researchers, program staff, other community members, and so on.
Then we put all data in single framework & apply various statistical tools to find out the dynamic on the market.
During the analysis stage, feedback from the stakeholder groups would be compared to determine areas of agreement as well as areas of divergence


