
Key Insights
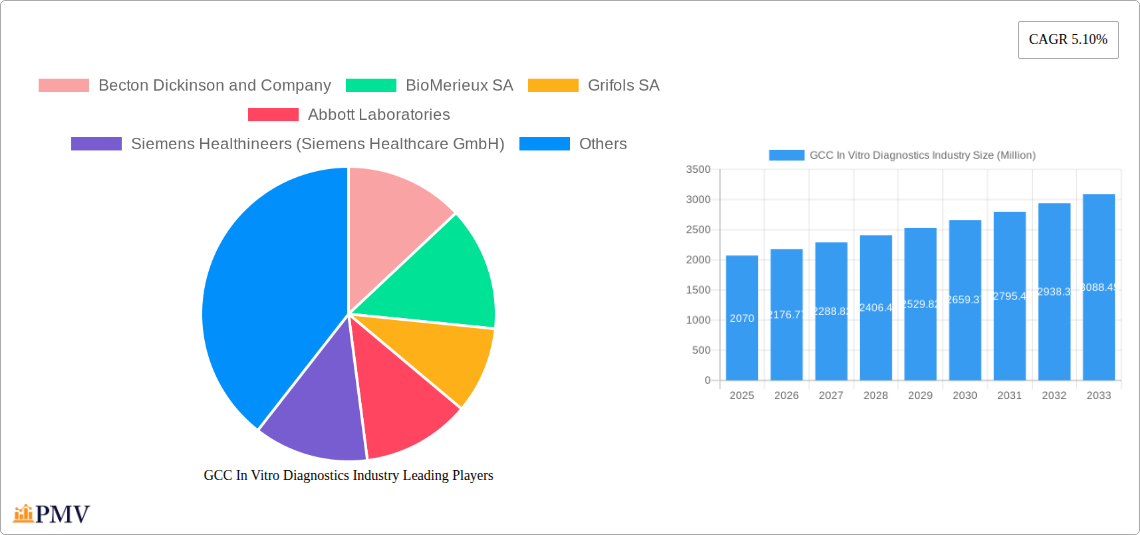
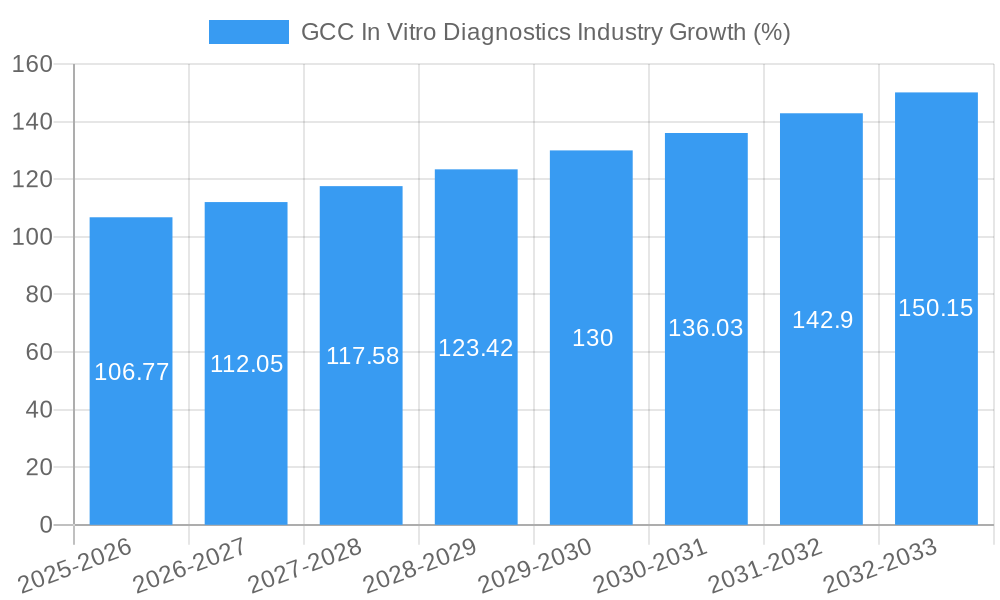
The GCC In Vitro Diagnostics (IVD) market presents a significant growth opportunity, projected to reach a substantial size driven by factors such as rising prevalence of chronic diseases (diabetes, cardiovascular diseases, and cancer), increasing healthcare expenditure, and growing adoption of advanced diagnostic technologies. The market's compound annual growth rate (CAGR) of 5.10% from 2019-2024 indicates a steady expansion, and this positive trend is expected to continue throughout the forecast period (2025-2033). Key market segments, including point-of-care diagnostics and molecular diagnostics, are experiencing robust growth due to their enhanced speed, accuracy, and efficiency. The increasing demand for rapid diagnostics, particularly for infectious diseases, further fuels market expansion. While the market is largely driven by hospital and diagnostic laboratory end-users, the growth of home-based diagnostics (self-blood glucose testing, for instance) and the increasing adoption of telehealth solutions are gradually expanding the market reach and accessibility. Major players like Becton Dickinson, BioMerieux, and Abbott Laboratories are significantly contributing to the market growth through strategic partnerships, product innovations, and investments in research and development. However, challenges such as regulatory hurdles and the high cost of advanced diagnostic technologies may act as potential restraints.
The market segmentation reveals significant opportunities across diverse areas. The disposable IVD device segment holds a larger market share due to its convenience and reduced risk of cross-contamination. Within applications, infectious disease diagnostics holds a substantial share driven by the prevalence of infectious diseases and the need for rapid and accurate diagnosis. Similarly, the growth of the diabetes segment is fueled by the rising incidence of diabetes in the GCC region. Technological advancements, particularly in molecular diagnostics and immunochemistry, are driving higher accuracy and efficiency in testing, leading to increased adoption across all segments. The regional focus on improving healthcare infrastructure and increasing government investments in healthcare initiatives will further stimulate the growth of the IVD market in the GCC. The increasing awareness about preventive healthcare and early diagnosis also contributes to the market’s expansion.
GCC In Vitro Diagnostics (IVD) Industry Market Report: 2019-2033
This comprehensive report provides a detailed analysis of the GCC In Vitro Diagnostics industry, offering valuable insights for stakeholders across the value chain. Covering the period from 2019 to 2033, with a base year of 2025 and a forecast period of 2025-2033, this report meticulously examines market dynamics, competitive landscapes, and future growth potential. The report features detailed segmentation by usability, application, end-user, diagnostic approach, technique, and product, providing a granular view of this rapidly evolving sector. Expect actionable intelligence crucial for strategic decision-making in this lucrative market.
GCC In Vitro Diagnostics Industry Market Structure & Competitive Dynamics
The GCC IVD market exhibits a moderately concentrated structure, with key players like Becton Dickinson and Company, BioMerieux SA, Grifols SA, Abbott Laboratories, Siemens Healthineers, Danaher Corporation, F Hoffmann-La Roche AG, DiaSorin, Thermo Fischer Scientific Inc, Qiagen NV, Sysmex Corporation, and Bio-Rad Laboratories holding significant market share. The combined market share of the top five players is estimated at xx%. Innovation within the ecosystem is driven by advancements in molecular diagnostics and point-of-care testing, fueled by substantial R&D investments. Regulatory frameworks, primarily overseen by national health ministries, are continually evolving to ensure quality and safety standards. The market witnesses considerable M&A activity, with deal values exceeding xx Million in the last five years. These transactions reflect strategic efforts to consolidate market share and expand product portfolios. End-user trends favor the adoption of automated, high-throughput systems in centralized laboratories, while the demand for rapid point-of-care diagnostics is growing in hospitals and clinics.
- Market Concentration: xx% market share held by top 5 players.
- M&A Activity: Deal values exceeding xx Million in the last 5 years.
- Regulatory Framework: Continuously evolving to ensure quality and safety.
- Innovation Ecosystem: Focused on molecular diagnostics and point-of-care testing.
GCC In Vitro Diagnostics Industry Trends & Insights
The GCC IVD market is experiencing robust growth, driven by factors such as rising prevalence of chronic diseases (diabetes, cancer), increasing healthcare expenditure, growing adoption of advanced diagnostic technologies, and government initiatives to improve healthcare infrastructure. The market is projected to register a CAGR of xx% during the forecast period (2025-2033). Technological disruptions, particularly in molecular diagnostics and automation, are significantly impacting market dynamics, leading to higher efficiency and improved diagnostic accuracy. Consumer preferences are shifting towards convenient, rapid, and reliable diagnostic solutions. Competitive dynamics are characterized by intense competition among established players and emerging companies, leading to innovation and price pressures. Market penetration of advanced technologies like next-generation sequencing (NGS) remains relatively low but is expected to increase significantly in the coming years.
Dominant Markets & Segments in GCC In Vitro Diagnostics Industry
The UAE and Saudi Arabia represent the most significant markets within the GCC region, accounting for over xx% of the total market value. The Infectious Disease segment dominates the application area, driven by the high prevalence of infectious ailments and government initiatives for disease surveillance. Within the product segment, Reagents represent the largest market share due to their recurring demand. Hospitals and clinics constitute the major end-user segment, owing to their extensive diagnostic needs. Centralized laboratory-based diagnostics currently hold a larger market share compared to point-of-care diagnostics, but the latter is experiencing rapid growth. Molecular diagnostics is a rapidly growing technique, driven by its high sensitivity and specificity.
Key Drivers (UAE & Saudi Arabia):
- High healthcare expenditure.
- Strong government support for healthcare infrastructure development.
- Increasing prevalence of chronic diseases.
Dominant Segments:
- Application: Infectious Disease
- End User: Hospitals and Clinics
- Product: Reagents
- Technique: Centralized Laboratory-based Diagnostics (currently) and Molecular Diagnostics (growing rapidly).
GCC In Vitro Diagnostics Industry Product Innovations
Recent advancements focus on improving the speed, accuracy, and accessibility of diagnostic testing. Miniaturization of instruments for point-of-care settings, development of rapid diagnostic tests (RDTs) for infectious diseases, and integration of artificial intelligence (AI) for data analysis are some key technological trends. These innovations cater to the growing demand for efficient and cost-effective diagnostic solutions. The market is also witnessing the emergence of personalized medicine-focused diagnostics, tailoring treatments to individual patient needs.
Report Segmentation & Scope
This report segments the GCC IVD market across various parameters, including:
- Usability: Disposable IVD Devices and Reusable IVD Devices (Growth projections and market size for each segment provided within the full report).
- Application: Infectious Disease, Diabetes, Cancer/Oncology, Cardiology, Autoimmune Disease, and Other Applications (Growth projections and market size for each segment provided within the full report).
- End User: Diagnostic Laboratories, Hospitals and Clinics, and Other End Users (Growth projections and market size for each segment provided within the full report).
- Diagnostic Approach: Point-of-Care Diagnostics and Centralized Laboratory-based Diagnostics (Growth projections and market size for each segment provided within the full report).
- Technique: Histochemistry, Molecular Diagnostics, Hematology, Self-blood Glucose Testing, Immunochemistry, and Other Techniques (Growth projections and market size for each segment provided within the full report).
- Product: Instrument, Reagent, and Other Products (Growth projections and market size for each segment provided within the full report).
Key Drivers of GCC In Vitro Diagnostics Industry Growth
The GCC IVD market growth is fueled by several factors, including the rising prevalence of chronic diseases, increasing healthcare spending, government initiatives to improve healthcare infrastructure, and the growing adoption of advanced diagnostic technologies. Technological advancements, such as molecular diagnostics and point-of-care testing, are also driving market expansion. Favorable government policies and regulations supporting the healthcare sector further contribute to market growth.
Challenges in the GCC In Vitro Diagnostics Industry Sector
Challenges include the relatively high cost of advanced diagnostic technologies, reliance on imports for certain IVD products, and the need for skilled personnel to operate sophisticated equipment. Regulatory hurdles and variations across different GCC countries can also pose challenges for market expansion. Furthermore, intense competition among existing players and the entry of new players can create price pressures.
Leading Players in the GCC In Vitro Diagnostics Industry Market
- Becton Dickinson and Company
- BioMerieux SA
- Grifols SA
- Abbott Laboratories
- Siemens Healthineers (Siemens Healthcare GmbH)
- Danaher Corporation
- F Hoffmann-La Roche AG
- DiaSorin
- Thermo Fischer Scientific Inc
- Qiagen NV
- Sysmex Corporation
- Bio-Rad Laboratories
Key Developments in GCC In Vitro Diagnostics Industry Sector
- July 2022: Saudi Arabia's Arabian International Healthcare Holding Company, TIBBIYAH, commenced a new Joint Venture (JV) with Swiss company Unilabs Diagnostics AB, expanding diagnostic services in the Kingdom.
- April 2022: United Arab Emirates Sheikh Shakhbout Medical City (SSMC) launched a point-of-care tool for antimicrobial management, enhancing infection control and treatment strategies.
Strategic GCC In Vitro Diagnostics Industry Market Outlook
The GCC IVD market presents significant opportunities for growth, driven by the increasing prevalence of chronic diseases and the growing demand for advanced diagnostic solutions. Strategic investments in infrastructure development, technological advancements, and talent acquisition will be key to capturing this market potential. Companies focusing on innovation, particularly in point-of-care diagnostics and personalized medicine, are likely to experience significant growth in the coming years.
GCC In Vitro Diagnostics Industry Segmentation
-
1. Technique
- 1.1. Histochemistry
- 1.2. Molecular Diagnostics
- 1.3. Hematology
- 1.4. Self-blood Glucose Testing
- 1.5. Immunochemistry
- 1.6. Other Techniques
-
2. Product
- 2.1. Instrument
- 2.2. Reagent
- 2.3. Other Products
-
3. Usability
- 3.1. Disposable IVD Device
- 3.2. Reusable IVD Device
-
4. Application
- 4.1. Infectious Disease
- 4.2. Diabetes
- 4.3. Cancer/Oncology
- 4.4. Cardiology
- 4.5. Autoimmune Disease
- 4.6. Other Applications
-
5. End User
- 5.1. Diagnostic Laboratories
- 5.2. Hospitals and Clinics
- 5.3. Other End Users
-
6. Diagnostic Approach
- 6.1. Point-of-Care Diagnostics
- 6.2. Centralized Laboratory-based Diagnostics
GCC In Vitro Diagnostics Industry Segmentation By Geography
-
1. North America
- 1.1. United States
- 1.2. Canada
- 1.3. Mexico
-
2. South America
- 2.1. Brazil
- 2.2. Argentina
- 2.3. Rest of South America
-
3. Europe
- 3.1. United Kingdom
- 3.2. Germany
- 3.3. France
- 3.4. Italy
- 3.5. Spain
- 3.6. Russia
- 3.7. Benelux
- 3.8. Nordics
- 3.9. Rest of Europe
-
4. Middle East & Africa
- 4.1. Turkey
- 4.2. Israel
- 4.3. GCC
- 4.4. North Africa
- 4.5. South Africa
- 4.6. Rest of Middle East & Africa
-
5. Asia Pacific
- 5.1. China
- 5.2. India
- 5.3. Japan
- 5.4. South Korea
- 5.5. ASEAN
- 5.6. Oceania
- 5.7. Rest of Asia Pacific
GCC In Vitro Diagnostics Industry REPORT HIGHLIGHTS
| Aspects | Details |
|---|---|
| Study Period | 2019-2033 |
| Base Year | 2024 |
| Estimated Year | 2025 |
| Forecast Period | 2025-2033 |
| Historical Period | 2019-2024 |
| Growth Rate | CAGR of 5.10% from 2019-2033 |
| Segmentation |
|
Table of Contents
- 1. Introduction
- 1.1. Research Scope
- 1.2. Market Segmentation
- 1.3. Research Methodology
- 1.4. Definitions and Assumptions
- 2. Executive Summary
- 2.1. Introduction
- 3. Market Dynamics
- 3.1. Introduction
- 3.2. Market Drivers
- 3.2.1. Growing Burden of Chronic Diseases and Infectious Diseases; Increasing Healthcare Expenditure
- 3.3. Market Restrains
- 3.3.1. Stringent Regulations
- 3.4. Market Trends
- 3.4.1. Point-of-care diagnostics Segment is Expected to Witness Growth Over The Forecast Period.
- 4. Market Factor Analysis
- 4.1. Porters Five Forces
- 4.2. Supply/Value Chain
- 4.3. PESTEL analysis
- 4.4. Market Entropy
- 4.5. Patent/Trademark Analysis
- 5. Global GCC In Vitro Diagnostics Industry Analysis, Insights and Forecast, 2019-2031
- 5.1. Market Analysis, Insights and Forecast - by Technique
- 5.1.1. Histochemistry
- 5.1.2. Molecular Diagnostics
- 5.1.3. Hematology
- 5.1.4. Self-blood Glucose Testing
- 5.1.5. Immunochemistry
- 5.1.6. Other Techniques
- 5.2. Market Analysis, Insights and Forecast - by Product
- 5.2.1. Instrument
- 5.2.2. Reagent
- 5.2.3. Other Products
- 5.3. Market Analysis, Insights and Forecast - by Usability
- 5.3.1. Disposable IVD Device
- 5.3.2. Reusable IVD Device
- 5.4. Market Analysis, Insights and Forecast - by Application
- 5.4.1. Infectious Disease
- 5.4.2. Diabetes
- 5.4.3. Cancer/Oncology
- 5.4.4. Cardiology
- 5.4.5. Autoimmune Disease
- 5.4.6. Other Applications
- 5.5. Market Analysis, Insights and Forecast - by End User
- 5.5.1. Diagnostic Laboratories
- 5.5.2. Hospitals and Clinics
- 5.5.3. Other End Users
- 5.6. Market Analysis, Insights and Forecast - by Diagnostic Approach
- 5.6.1. Point-of-Care Diagnostics
- 5.6.2. Centralized Laboratory-based Diagnostics
- 5.7. Market Analysis, Insights and Forecast - by Region
- 5.7.1. North America
- 5.7.2. South America
- 5.7.3. Europe
- 5.7.4. Middle East & Africa
- 5.7.5. Asia Pacific
- 5.1. Market Analysis, Insights and Forecast - by Technique
- 6. North America GCC In Vitro Diagnostics Industry Analysis, Insights and Forecast, 2019-2031
- 6.1. Market Analysis, Insights and Forecast - by Technique
- 6.1.1. Histochemistry
- 6.1.2. Molecular Diagnostics
- 6.1.3. Hematology
- 6.1.4. Self-blood Glucose Testing
- 6.1.5. Immunochemistry
- 6.1.6. Other Techniques
- 6.2. Market Analysis, Insights and Forecast - by Product
- 6.2.1. Instrument
- 6.2.2. Reagent
- 6.2.3. Other Products
- 6.3. Market Analysis, Insights and Forecast - by Usability
- 6.3.1. Disposable IVD Device
- 6.3.2. Reusable IVD Device
- 6.4. Market Analysis, Insights and Forecast - by Application
- 6.4.1. Infectious Disease
- 6.4.2. Diabetes
- 6.4.3. Cancer/Oncology
- 6.4.4. Cardiology
- 6.4.5. Autoimmune Disease
- 6.4.6. Other Applications
- 6.5. Market Analysis, Insights and Forecast - by End User
- 6.5.1. Diagnostic Laboratories
- 6.5.2. Hospitals and Clinics
- 6.5.3. Other End Users
- 6.6. Market Analysis, Insights and Forecast - by Diagnostic Approach
- 6.6.1. Point-of-Care Diagnostics
- 6.6.2. Centralized Laboratory-based Diagnostics
- 6.1. Market Analysis, Insights and Forecast - by Technique
- 7. South America GCC In Vitro Diagnostics Industry Analysis, Insights and Forecast, 2019-2031
- 7.1. Market Analysis, Insights and Forecast - by Technique
- 7.1.1. Histochemistry
- 7.1.2. Molecular Diagnostics
- 7.1.3. Hematology
- 7.1.4. Self-blood Glucose Testing
- 7.1.5. Immunochemistry
- 7.1.6. Other Techniques
- 7.2. Market Analysis, Insights and Forecast - by Product
- 7.2.1. Instrument
- 7.2.2. Reagent
- 7.2.3. Other Products
- 7.3. Market Analysis, Insights and Forecast - by Usability
- 7.3.1. Disposable IVD Device
- 7.3.2. Reusable IVD Device
- 7.4. Market Analysis, Insights and Forecast - by Application
- 7.4.1. Infectious Disease
- 7.4.2. Diabetes
- 7.4.3. Cancer/Oncology
- 7.4.4. Cardiology
- 7.4.5. Autoimmune Disease
- 7.4.6. Other Applications
- 7.5. Market Analysis, Insights and Forecast - by End User
- 7.5.1. Diagnostic Laboratories
- 7.5.2. Hospitals and Clinics
- 7.5.3. Other End Users
- 7.6. Market Analysis, Insights and Forecast - by Diagnostic Approach
- 7.6.1. Point-of-Care Diagnostics
- 7.6.2. Centralized Laboratory-based Diagnostics
- 7.1. Market Analysis, Insights and Forecast - by Technique
- 8. Europe GCC In Vitro Diagnostics Industry Analysis, Insights and Forecast, 2019-2031
- 8.1. Market Analysis, Insights and Forecast - by Technique
- 8.1.1. Histochemistry
- 8.1.2. Molecular Diagnostics
- 8.1.3. Hematology
- 8.1.4. Self-blood Glucose Testing
- 8.1.5. Immunochemistry
- 8.1.6. Other Techniques
- 8.2. Market Analysis, Insights and Forecast - by Product
- 8.2.1. Instrument
- 8.2.2. Reagent
- 8.2.3. Other Products
- 8.3. Market Analysis, Insights and Forecast - by Usability
- 8.3.1. Disposable IVD Device
- 8.3.2. Reusable IVD Device
- 8.4. Market Analysis, Insights and Forecast - by Application
- 8.4.1. Infectious Disease
- 8.4.2. Diabetes
- 8.4.3. Cancer/Oncology
- 8.4.4. Cardiology
- 8.4.5. Autoimmune Disease
- 8.4.6. Other Applications
- 8.5. Market Analysis, Insights and Forecast - by End User
- 8.5.1. Diagnostic Laboratories
- 8.5.2. Hospitals and Clinics
- 8.5.3. Other End Users
- 8.6. Market Analysis, Insights and Forecast - by Diagnostic Approach
- 8.6.1. Point-of-Care Diagnostics
- 8.6.2. Centralized Laboratory-based Diagnostics
- 8.1. Market Analysis, Insights and Forecast - by Technique
- 9. Middle East & Africa GCC In Vitro Diagnostics Industry Analysis, Insights and Forecast, 2019-2031
- 9.1. Market Analysis, Insights and Forecast - by Technique
- 9.1.1. Histochemistry
- 9.1.2. Molecular Diagnostics
- 9.1.3. Hematology
- 9.1.4. Self-blood Glucose Testing
- 9.1.5. Immunochemistry
- 9.1.6. Other Techniques
- 9.2. Market Analysis, Insights and Forecast - by Product
- 9.2.1. Instrument
- 9.2.2. Reagent
- 9.2.3. Other Products
- 9.3. Market Analysis, Insights and Forecast - by Usability
- 9.3.1. Disposable IVD Device
- 9.3.2. Reusable IVD Device
- 9.4. Market Analysis, Insights and Forecast - by Application
- 9.4.1. Infectious Disease
- 9.4.2. Diabetes
- 9.4.3. Cancer/Oncology
- 9.4.4. Cardiology
- 9.4.5. Autoimmune Disease
- 9.4.6. Other Applications
- 9.5. Market Analysis, Insights and Forecast - by End User
- 9.5.1. Diagnostic Laboratories
- 9.5.2. Hospitals and Clinics
- 9.5.3. Other End Users
- 9.6. Market Analysis, Insights and Forecast - by Diagnostic Approach
- 9.6.1. Point-of-Care Diagnostics
- 9.6.2. Centralized Laboratory-based Diagnostics
- 9.1. Market Analysis, Insights and Forecast - by Technique
- 10. Asia Pacific GCC In Vitro Diagnostics Industry Analysis, Insights and Forecast, 2019-2031
- 10.1. Market Analysis, Insights and Forecast - by Technique
- 10.1.1. Histochemistry
- 10.1.2. Molecular Diagnostics
- 10.1.3. Hematology
- 10.1.4. Self-blood Glucose Testing
- 10.1.5. Immunochemistry
- 10.1.6. Other Techniques
- 10.2. Market Analysis, Insights and Forecast - by Product
- 10.2.1. Instrument
- 10.2.2. Reagent
- 10.2.3. Other Products
- 10.3. Market Analysis, Insights and Forecast - by Usability
- 10.3.1. Disposable IVD Device
- 10.3.2. Reusable IVD Device
- 10.4. Market Analysis, Insights and Forecast - by Application
- 10.4.1. Infectious Disease
- 10.4.2. Diabetes
- 10.4.3. Cancer/Oncology
- 10.4.4. Cardiology
- 10.4.5. Autoimmune Disease
- 10.4.6. Other Applications
- 10.5. Market Analysis, Insights and Forecast - by End User
- 10.5.1. Diagnostic Laboratories
- 10.5.2. Hospitals and Clinics
- 10.5.3. Other End Users
- 10.6. Market Analysis, Insights and Forecast - by Diagnostic Approach
- 10.6.1. Point-of-Care Diagnostics
- 10.6.2. Centralized Laboratory-based Diagnostics
- 10.1. Market Analysis, Insights and Forecast - by Technique
- 11. Competitive Analysis
- 11.1. Global Market Share Analysis 2024
- 11.2. Company Profiles
- 11.2.1 Becton Dickinson and Company
- 11.2.1.1. Overview
- 11.2.1.2. Products
- 11.2.1.3. SWOT Analysis
- 11.2.1.4. Recent Developments
- 11.2.1.5. Financials (Based on Availability)
- 11.2.2 BioMerieux SA
- 11.2.2.1. Overview
- 11.2.2.2. Products
- 11.2.2.3. SWOT Analysis
- 11.2.2.4. Recent Developments
- 11.2.2.5. Financials (Based on Availability)
- 11.2.3 Grifols SA
- 11.2.3.1. Overview
- 11.2.3.2. Products
- 11.2.3.3. SWOT Analysis
- 11.2.3.4. Recent Developments
- 11.2.3.5. Financials (Based on Availability)
- 11.2.4 Abbott Laboratories
- 11.2.4.1. Overview
- 11.2.4.2. Products
- 11.2.4.3. SWOT Analysis
- 11.2.4.4. Recent Developments
- 11.2.4.5. Financials (Based on Availability)
- 11.2.5 Siemens Healthineers (Siemens Healthcare GmbH)
- 11.2.5.1. Overview
- 11.2.5.2. Products
- 11.2.5.3. SWOT Analysis
- 11.2.5.4. Recent Developments
- 11.2.5.5. Financials (Based on Availability)
- 11.2.6 Danaher Corporation
- 11.2.6.1. Overview
- 11.2.6.2. Products
- 11.2.6.3. SWOT Analysis
- 11.2.6.4. Recent Developments
- 11.2.6.5. Financials (Based on Availability)
- 11.2.7 F Hoffmann-La Roche AG
- 11.2.7.1. Overview
- 11.2.7.2. Products
- 11.2.7.3. SWOT Analysis
- 11.2.7.4. Recent Developments
- 11.2.7.5. Financials (Based on Availability)
- 11.2.8 DiaSorin
- 11.2.8.1. Overview
- 11.2.8.2. Products
- 11.2.8.3. SWOT Analysis
- 11.2.8.4. Recent Developments
- 11.2.8.5. Financials (Based on Availability)
- 11.2.9 Thermo Fischer Scientific Inc
- 11.2.9.1. Overview
- 11.2.9.2. Products
- 11.2.9.3. SWOT Analysis
- 11.2.9.4. Recent Developments
- 11.2.9.5. Financials (Based on Availability)
- 11.2.10 Qiagen NV
- 11.2.10.1. Overview
- 11.2.10.2. Products
- 11.2.10.3. SWOT Analysis
- 11.2.10.4. Recent Developments
- 11.2.10.5. Financials (Based on Availability)
- 11.2.11 Sysmex Corporation
- 11.2.11.1. Overview
- 11.2.11.2. Products
- 11.2.11.3. SWOT Analysis
- 11.2.11.4. Recent Developments
- 11.2.11.5. Financials (Based on Availability)
- 11.2.12 Bio-Rad Laboratories
- 11.2.12.1. Overview
- 11.2.12.2. Products
- 11.2.12.3. SWOT Analysis
- 11.2.12.4. Recent Developments
- 11.2.12.5. Financials (Based on Availability)
- 11.2.1 Becton Dickinson and Company
List of Figures
- Figure 1: Global GCC In Vitro Diagnostics Industry Revenue Breakdown (Million, %) by Region 2024 & 2032
- Figure 2: Global GCC In Vitro Diagnostics Industry Volume Breakdown (K Unit, %) by Region 2024 & 2032
- Figure 3: US GCC In Vitro Diagnostics Industry Revenue (Million), by Country 2024 & 2032
- Figure 4: US GCC In Vitro Diagnostics Industry Volume (K Unit), by Country 2024 & 2032
- Figure 5: US GCC In Vitro Diagnostics Industry Revenue Share (%), by Country 2024 & 2032
- Figure 6: US GCC In Vitro Diagnostics Industry Volume Share (%), by Country 2024 & 2032
- Figure 7: North America GCC In Vitro Diagnostics Industry Revenue (Million), by Technique 2024 & 2032
- Figure 8: North America GCC In Vitro Diagnostics Industry Volume (K Unit), by Technique 2024 & 2032
- Figure 9: North America GCC In Vitro Diagnostics Industry Revenue Share (%), by Technique 2024 & 2032
- Figure 10: North America GCC In Vitro Diagnostics Industry Volume Share (%), by Technique 2024 & 2032
- Figure 11: North America GCC In Vitro Diagnostics Industry Revenue (Million), by Product 2024 & 2032
- Figure 12: North America GCC In Vitro Diagnostics Industry Volume (K Unit), by Product 2024 & 2032
- Figure 13: North America GCC In Vitro Diagnostics Industry Revenue Share (%), by Product 2024 & 2032
- Figure 14: North America GCC In Vitro Diagnostics Industry Volume Share (%), by Product 2024 & 2032
- Figure 15: North America GCC In Vitro Diagnostics Industry Revenue (Million), by Usability 2024 & 2032
- Figure 16: North America GCC In Vitro Diagnostics Industry Volume (K Unit), by Usability 2024 & 2032
- Figure 17: North America GCC In Vitro Diagnostics Industry Revenue Share (%), by Usability 2024 & 2032
- Figure 18: North America GCC In Vitro Diagnostics Industry Volume Share (%), by Usability 2024 & 2032
- Figure 19: North America GCC In Vitro Diagnostics Industry Revenue (Million), by Application 2024 & 2032
- Figure 20: North America GCC In Vitro Diagnostics Industry Volume (K Unit), by Application 2024 & 2032
- Figure 21: North America GCC In Vitro Diagnostics Industry Revenue Share (%), by Application 2024 & 2032
- Figure 22: North America GCC In Vitro Diagnostics Industry Volume Share (%), by Application 2024 & 2032
- Figure 23: North America GCC In Vitro Diagnostics Industry Revenue (Million), by End User 2024 & 2032
- Figure 24: North America GCC In Vitro Diagnostics Industry Volume (K Unit), by End User 2024 & 2032
- Figure 25: North America GCC In Vitro Diagnostics Industry Revenue Share (%), by End User 2024 & 2032
- Figure 26: North America GCC In Vitro Diagnostics Industry Volume Share (%), by End User 2024 & 2032
- Figure 27: North America GCC In Vitro Diagnostics Industry Revenue (Million), by Diagnostic Approach 2024 & 2032
- Figure 28: North America GCC In Vitro Diagnostics Industry Volume (K Unit), by Diagnostic Approach 2024 & 2032
- Figure 29: North America GCC In Vitro Diagnostics Industry Revenue Share (%), by Diagnostic Approach 2024 & 2032
- Figure 30: North America GCC In Vitro Diagnostics Industry Volume Share (%), by Diagnostic Approach 2024 & 2032
- Figure 31: North America GCC In Vitro Diagnostics Industry Revenue (Million), by Country 2024 & 2032
- Figure 32: North America GCC In Vitro Diagnostics Industry Volume (K Unit), by Country 2024 & 2032
- Figure 33: North America GCC In Vitro Diagnostics Industry Revenue Share (%), by Country 2024 & 2032
- Figure 34: North America GCC In Vitro Diagnostics Industry Volume Share (%), by Country 2024 & 2032
- Figure 35: South America GCC In Vitro Diagnostics Industry Revenue (Million), by Technique 2024 & 2032
- Figure 36: South America GCC In Vitro Diagnostics Industry Volume (K Unit), by Technique 2024 & 2032
- Figure 37: South America GCC In Vitro Diagnostics Industry Revenue Share (%), by Technique 2024 & 2032
- Figure 38: South America GCC In Vitro Diagnostics Industry Volume Share (%), by Technique 2024 & 2032
- Figure 39: South America GCC In Vitro Diagnostics Industry Revenue (Million), by Product 2024 & 2032
- Figure 40: South America GCC In Vitro Diagnostics Industry Volume (K Unit), by Product 2024 & 2032
- Figure 41: South America GCC In Vitro Diagnostics Industry Revenue Share (%), by Product 2024 & 2032
- Figure 42: South America GCC In Vitro Diagnostics Industry Volume Share (%), by Product 2024 & 2032
- Figure 43: South America GCC In Vitro Diagnostics Industry Revenue (Million), by Usability 2024 & 2032
- Figure 44: South America GCC In Vitro Diagnostics Industry Volume (K Unit), by Usability 2024 & 2032
- Figure 45: South America GCC In Vitro Diagnostics Industry Revenue Share (%), by Usability 2024 & 2032
- Figure 46: South America GCC In Vitro Diagnostics Industry Volume Share (%), by Usability 2024 & 2032
- Figure 47: South America GCC In Vitro Diagnostics Industry Revenue (Million), by Application 2024 & 2032
- Figure 48: South America GCC In Vitro Diagnostics Industry Volume (K Unit), by Application 2024 & 2032
- Figure 49: South America GCC In Vitro Diagnostics Industry Revenue Share (%), by Application 2024 & 2032
- Figure 50: South America GCC In Vitro Diagnostics Industry Volume Share (%), by Application 2024 & 2032
- Figure 51: South America GCC In Vitro Diagnostics Industry Revenue (Million), by End User 2024 & 2032
- Figure 52: South America GCC In Vitro Diagnostics Industry Volume (K Unit), by End User 2024 & 2032
- Figure 53: South America GCC In Vitro Diagnostics Industry Revenue Share (%), by End User 2024 & 2032
- Figure 54: South America GCC In Vitro Diagnostics Industry Volume Share (%), by End User 2024 & 2032
- Figure 55: South America GCC In Vitro Diagnostics Industry Revenue (Million), by Diagnostic Approach 2024 & 2032
- Figure 56: South America GCC In Vitro Diagnostics Industry Volume (K Unit), by Diagnostic Approach 2024 & 2032
- Figure 57: South America GCC In Vitro Diagnostics Industry Revenue Share (%), by Diagnostic Approach 2024 & 2032
- Figure 58: South America GCC In Vitro Diagnostics Industry Volume Share (%), by Diagnostic Approach 2024 & 2032
- Figure 59: South America GCC In Vitro Diagnostics Industry Revenue (Million), by Country 2024 & 2032
- Figure 60: South America GCC In Vitro Diagnostics Industry Volume (K Unit), by Country 2024 & 2032
- Figure 61: South America GCC In Vitro Diagnostics Industry Revenue Share (%), by Country 2024 & 2032
- Figure 62: South America GCC In Vitro Diagnostics Industry Volume Share (%), by Country 2024 & 2032
- Figure 63: Europe GCC In Vitro Diagnostics Industry Revenue (Million), by Technique 2024 & 2032
- Figure 64: Europe GCC In Vitro Diagnostics Industry Volume (K Unit), by Technique 2024 & 2032
- Figure 65: Europe GCC In Vitro Diagnostics Industry Revenue Share (%), by Technique 2024 & 2032
- Figure 66: Europe GCC In Vitro Diagnostics Industry Volume Share (%), by Technique 2024 & 2032
- Figure 67: Europe GCC In Vitro Diagnostics Industry Revenue (Million), by Product 2024 & 2032
- Figure 68: Europe GCC In Vitro Diagnostics Industry Volume (K Unit), by Product 2024 & 2032
- Figure 69: Europe GCC In Vitro Diagnostics Industry Revenue Share (%), by Product 2024 & 2032
- Figure 70: Europe GCC In Vitro Diagnostics Industry Volume Share (%), by Product 2024 & 2032
- Figure 71: Europe GCC In Vitro Diagnostics Industry Revenue (Million), by Usability 2024 & 2032
- Figure 72: Europe GCC In Vitro Diagnostics Industry Volume (K Unit), by Usability 2024 & 2032
- Figure 73: Europe GCC In Vitro Diagnostics Industry Revenue Share (%), by Usability 2024 & 2032
- Figure 74: Europe GCC In Vitro Diagnostics Industry Volume Share (%), by Usability 2024 & 2032
- Figure 75: Europe GCC In Vitro Diagnostics Industry Revenue (Million), by Application 2024 & 2032
- Figure 76: Europe GCC In Vitro Diagnostics Industry Volume (K Unit), by Application 2024 & 2032
- Figure 77: Europe GCC In Vitro Diagnostics Industry Revenue Share (%), by Application 2024 & 2032
- Figure 78: Europe GCC In Vitro Diagnostics Industry Volume Share (%), by Application 2024 & 2032
- Figure 79: Europe GCC In Vitro Diagnostics Industry Revenue (Million), by End User 2024 & 2032
- Figure 80: Europe GCC In Vitro Diagnostics Industry Volume (K Unit), by End User 2024 & 2032
- Figure 81: Europe GCC In Vitro Diagnostics Industry Revenue Share (%), by End User 2024 & 2032
- Figure 82: Europe GCC In Vitro Diagnostics Industry Volume Share (%), by End User 2024 & 2032
- Figure 83: Europe GCC In Vitro Diagnostics Industry Revenue (Million), by Diagnostic Approach 2024 & 2032
- Figure 84: Europe GCC In Vitro Diagnostics Industry Volume (K Unit), by Diagnostic Approach 2024 & 2032
- Figure 85: Europe GCC In Vitro Diagnostics Industry Revenue Share (%), by Diagnostic Approach 2024 & 2032
- Figure 86: Europe GCC In Vitro Diagnostics Industry Volume Share (%), by Diagnostic Approach 2024 & 2032
- Figure 87: Europe GCC In Vitro Diagnostics Industry Revenue (Million), by Country 2024 & 2032
- Figure 88: Europe GCC In Vitro Diagnostics Industry Volume (K Unit), by Country 2024 & 2032
- Figure 89: Europe GCC In Vitro Diagnostics Industry Revenue Share (%), by Country 2024 & 2032
- Figure 90: Europe GCC In Vitro Diagnostics Industry Volume Share (%), by Country 2024 & 2032
- Figure 91: Middle East & Africa GCC In Vitro Diagnostics Industry Revenue (Million), by Technique 2024 & 2032
- Figure 92: Middle East & Africa GCC In Vitro Diagnostics Industry Volume (K Unit), by Technique 2024 & 2032
- Figure 93: Middle East & Africa GCC In Vitro Diagnostics Industry Revenue Share (%), by Technique 2024 & 2032
- Figure 94: Middle East & Africa GCC In Vitro Diagnostics Industry Volume Share (%), by Technique 2024 & 2032
- Figure 95: Middle East & Africa GCC In Vitro Diagnostics Industry Revenue (Million), by Product 2024 & 2032
- Figure 96: Middle East & Africa GCC In Vitro Diagnostics Industry Volume (K Unit), by Product 2024 & 2032
- Figure 97: Middle East & Africa GCC In Vitro Diagnostics Industry Revenue Share (%), by Product 2024 & 2032
- Figure 98: Middle East & Africa GCC In Vitro Diagnostics Industry Volume Share (%), by Product 2024 & 2032
- Figure 99: Middle East & Africa GCC In Vitro Diagnostics Industry Revenue (Million), by Usability 2024 & 2032
- Figure 100: Middle East & Africa GCC In Vitro Diagnostics Industry Volume (K Unit), by Usability 2024 & 2032
- Figure 101: Middle East & Africa GCC In Vitro Diagnostics Industry Revenue Share (%), by Usability 2024 & 2032
- Figure 102: Middle East & Africa GCC In Vitro Diagnostics Industry Volume Share (%), by Usability 2024 & 2032
- Figure 103: Middle East & Africa GCC In Vitro Diagnostics Industry Revenue (Million), by Application 2024 & 2032
- Figure 104: Middle East & Africa GCC In Vitro Diagnostics Industry Volume (K Unit), by Application 2024 & 2032
- Figure 105: Middle East & Africa GCC In Vitro Diagnostics Industry Revenue Share (%), by Application 2024 & 2032
- Figure 106: Middle East & Africa GCC In Vitro Diagnostics Industry Volume Share (%), by Application 2024 & 2032
- Figure 107: Middle East & Africa GCC In Vitro Diagnostics Industry Revenue (Million), by End User 2024 & 2032
- Figure 108: Middle East & Africa GCC In Vitro Diagnostics Industry Volume (K Unit), by End User 2024 & 2032
- Figure 109: Middle East & Africa GCC In Vitro Diagnostics Industry Revenue Share (%), by End User 2024 & 2032
- Figure 110: Middle East & Africa GCC In Vitro Diagnostics Industry Volume Share (%), by End User 2024 & 2032
- Figure 111: Middle East & Africa GCC In Vitro Diagnostics Industry Revenue (Million), by Diagnostic Approach 2024 & 2032
- Figure 112: Middle East & Africa GCC In Vitro Diagnostics Industry Volume (K Unit), by Diagnostic Approach 2024 & 2032
- Figure 113: Middle East & Africa GCC In Vitro Diagnostics Industry Revenue Share (%), by Diagnostic Approach 2024 & 2032
- Figure 114: Middle East & Africa GCC In Vitro Diagnostics Industry Volume Share (%), by Diagnostic Approach 2024 & 2032
- Figure 115: Middle East & Africa GCC In Vitro Diagnostics Industry Revenue (Million), by Country 2024 & 2032
- Figure 116: Middle East & Africa GCC In Vitro Diagnostics Industry Volume (K Unit), by Country 2024 & 2032
- Figure 117: Middle East & Africa GCC In Vitro Diagnostics Industry Revenue Share (%), by Country 2024 & 2032
- Figure 118: Middle East & Africa GCC In Vitro Diagnostics Industry Volume Share (%), by Country 2024 & 2032
- Figure 119: Asia Pacific GCC In Vitro Diagnostics Industry Revenue (Million), by Technique 2024 & 2032
- Figure 120: Asia Pacific GCC In Vitro Diagnostics Industry Volume (K Unit), by Technique 2024 & 2032
- Figure 121: Asia Pacific GCC In Vitro Diagnostics Industry Revenue Share (%), by Technique 2024 & 2032
- Figure 122: Asia Pacific GCC In Vitro Diagnostics Industry Volume Share (%), by Technique 2024 & 2032
- Figure 123: Asia Pacific GCC In Vitro Diagnostics Industry Revenue (Million), by Product 2024 & 2032
- Figure 124: Asia Pacific GCC In Vitro Diagnostics Industry Volume (K Unit), by Product 2024 & 2032
- Figure 125: Asia Pacific GCC In Vitro Diagnostics Industry Revenue Share (%), by Product 2024 & 2032
- Figure 126: Asia Pacific GCC In Vitro Diagnostics Industry Volume Share (%), by Product 2024 & 2032
- Figure 127: Asia Pacific GCC In Vitro Diagnostics Industry Revenue (Million), by Usability 2024 & 2032
- Figure 128: Asia Pacific GCC In Vitro Diagnostics Industry Volume (K Unit), by Usability 2024 & 2032
- Figure 129: Asia Pacific GCC In Vitro Diagnostics Industry Revenue Share (%), by Usability 2024 & 2032
- Figure 130: Asia Pacific GCC In Vitro Diagnostics Industry Volume Share (%), by Usability 2024 & 2032
- Figure 131: Asia Pacific GCC In Vitro Diagnostics Industry Revenue (Million), by Application 2024 & 2032
- Figure 132: Asia Pacific GCC In Vitro Diagnostics Industry Volume (K Unit), by Application 2024 & 2032
- Figure 133: Asia Pacific GCC In Vitro Diagnostics Industry Revenue Share (%), by Application 2024 & 2032
- Figure 134: Asia Pacific GCC In Vitro Diagnostics Industry Volume Share (%), by Application 2024 & 2032
- Figure 135: Asia Pacific GCC In Vitro Diagnostics Industry Revenue (Million), by End User 2024 & 2032
- Figure 136: Asia Pacific GCC In Vitro Diagnostics Industry Volume (K Unit), by End User 2024 & 2032
- Figure 137: Asia Pacific GCC In Vitro Diagnostics Industry Revenue Share (%), by End User 2024 & 2032
- Figure 138: Asia Pacific GCC In Vitro Diagnostics Industry Volume Share (%), by End User 2024 & 2032
- Figure 139: Asia Pacific GCC In Vitro Diagnostics Industry Revenue (Million), by Diagnostic Approach 2024 & 2032
- Figure 140: Asia Pacific GCC In Vitro Diagnostics Industry Volume (K Unit), by Diagnostic Approach 2024 & 2032
- Figure 141: Asia Pacific GCC In Vitro Diagnostics Industry Revenue Share (%), by Diagnostic Approach 2024 & 2032
- Figure 142: Asia Pacific GCC In Vitro Diagnostics Industry Volume Share (%), by Diagnostic Approach 2024 & 2032
- Figure 143: Asia Pacific GCC In Vitro Diagnostics Industry Revenue (Million), by Country 2024 & 2032
- Figure 144: Asia Pacific GCC In Vitro Diagnostics Industry Volume (K Unit), by Country 2024 & 2032
- Figure 145: Asia Pacific GCC In Vitro Diagnostics Industry Revenue Share (%), by Country 2024 & 2032
- Figure 146: Asia Pacific GCC In Vitro Diagnostics Industry Volume Share (%), by Country 2024 & 2032
List of Tables
- Table 1: Global GCC In Vitro Diagnostics Industry Revenue Million Forecast, by Region 2019 & 2032
- Table 2: Global GCC In Vitro Diagnostics Industry Volume K Unit Forecast, by Region 2019 & 2032
- Table 3: Global GCC In Vitro Diagnostics Industry Revenue Million Forecast, by Technique 2019 & 2032
- Table 4: Global GCC In Vitro Diagnostics Industry Volume K Unit Forecast, by Technique 2019 & 2032
- Table 5: Global GCC In Vitro Diagnostics Industry Revenue Million Forecast, by Product 2019 & 2032
- Table 6: Global GCC In Vitro Diagnostics Industry Volume K Unit Forecast, by Product 2019 & 2032
- Table 7: Global GCC In Vitro Diagnostics Industry Revenue Million Forecast, by Usability 2019 & 2032
- Table 8: Global GCC In Vitro Diagnostics Industry Volume K Unit Forecast, by Usability 2019 & 2032
- Table 9: Global GCC In Vitro Diagnostics Industry Revenue Million Forecast, by Application 2019 & 2032
- Table 10: Global GCC In Vitro Diagnostics Industry Volume K Unit Forecast, by Application 2019 & 2032
- Table 11: Global GCC In Vitro Diagnostics Industry Revenue Million Forecast, by End User 2019 & 2032
- Table 12: Global GCC In Vitro Diagnostics Industry Volume K Unit Forecast, by End User 2019 & 2032
- Table 13: Global GCC In Vitro Diagnostics Industry Revenue Million Forecast, by Diagnostic Approach 2019 & 2032
- Table 14: Global GCC In Vitro Diagnostics Industry Volume K Unit Forecast, by Diagnostic Approach 2019 & 2032
- Table 15: Global GCC In Vitro Diagnostics Industry Revenue Million Forecast, by Region 2019 & 2032
- Table 16: Global GCC In Vitro Diagnostics Industry Volume K Unit Forecast, by Region 2019 & 2032
- Table 17: Global GCC In Vitro Diagnostics Industry Revenue Million Forecast, by Country 2019 & 2032
- Table 18: Global GCC In Vitro Diagnostics Industry Volume K Unit Forecast, by Country 2019 & 2032
- Table 19: Global GCC In Vitro Diagnostics Industry Revenue Million Forecast, by Technique 2019 & 2032
- Table 20: Global GCC In Vitro Diagnostics Industry Volume K Unit Forecast, by Technique 2019 & 2032
- Table 21: Global GCC In Vitro Diagnostics Industry Revenue Million Forecast, by Product 2019 & 2032
- Table 22: Global GCC In Vitro Diagnostics Industry Volume K Unit Forecast, by Product 2019 & 2032
- Table 23: Global GCC In Vitro Diagnostics Industry Revenue Million Forecast, by Usability 2019 & 2032
- Table 24: Global GCC In Vitro Diagnostics Industry Volume K Unit Forecast, by Usability 2019 & 2032
- Table 25: Global GCC In Vitro Diagnostics Industry Revenue Million Forecast, by Application 2019 & 2032
- Table 26: Global GCC In Vitro Diagnostics Industry Volume K Unit Forecast, by Application 2019 & 2032
- Table 27: Global GCC In Vitro Diagnostics Industry Revenue Million Forecast, by End User 2019 & 2032
- Table 28: Global GCC In Vitro Diagnostics Industry Volume K Unit Forecast, by End User 2019 & 2032
- Table 29: Global GCC In Vitro Diagnostics Industry Revenue Million Forecast, by Diagnostic Approach 2019 & 2032
- Table 30: Global GCC In Vitro Diagnostics Industry Volume K Unit Forecast, by Diagnostic Approach 2019 & 2032
- Table 31: Global GCC In Vitro Diagnostics Industry Revenue Million Forecast, by Country 2019 & 2032
- Table 32: Global GCC In Vitro Diagnostics Industry Volume K Unit Forecast, by Country 2019 & 2032
- Table 33: United States GCC In Vitro Diagnostics Industry Revenue (Million) Forecast, by Application 2019 & 2032
- Table 34: United States GCC In Vitro Diagnostics Industry Volume (K Unit) Forecast, by Application 2019 & 2032
- Table 35: Canada GCC In Vitro Diagnostics Industry Revenue (Million) Forecast, by Application 2019 & 2032
- Table 36: Canada GCC In Vitro Diagnostics Industry Volume (K Unit) Forecast, by Application 2019 & 2032
- Table 37: Mexico GCC In Vitro Diagnostics Industry Revenue (Million) Forecast, by Application 2019 & 2032
- Table 38: Mexico GCC In Vitro Diagnostics Industry Volume (K Unit) Forecast, by Application 2019 & 2032
- Table 39: Global GCC In Vitro Diagnostics Industry Revenue Million Forecast, by Technique 2019 & 2032
- Table 40: Global GCC In Vitro Diagnostics Industry Volume K Unit Forecast, by Technique 2019 & 2032
- Table 41: Global GCC In Vitro Diagnostics Industry Revenue Million Forecast, by Product 2019 & 2032
- Table 42: Global GCC In Vitro Diagnostics Industry Volume K Unit Forecast, by Product 2019 & 2032
- Table 43: Global GCC In Vitro Diagnostics Industry Revenue Million Forecast, by Usability 2019 & 2032
- Table 44: Global GCC In Vitro Diagnostics Industry Volume K Unit Forecast, by Usability 2019 & 2032
- Table 45: Global GCC In Vitro Diagnostics Industry Revenue Million Forecast, by Application 2019 & 2032
- Table 46: Global GCC In Vitro Diagnostics Industry Volume K Unit Forecast, by Application 2019 & 2032
- Table 47: Global GCC In Vitro Diagnostics Industry Revenue Million Forecast, by End User 2019 & 2032
- Table 48: Global GCC In Vitro Diagnostics Industry Volume K Unit Forecast, by End User 2019 & 2032
- Table 49: Global GCC In Vitro Diagnostics Industry Revenue Million Forecast, by Diagnostic Approach 2019 & 2032
- Table 50: Global GCC In Vitro Diagnostics Industry Volume K Unit Forecast, by Diagnostic Approach 2019 & 2032
- Table 51: Global GCC In Vitro Diagnostics Industry Revenue Million Forecast, by Country 2019 & 2032
- Table 52: Global GCC In Vitro Diagnostics Industry Volume K Unit Forecast, by Country 2019 & 2032
- Table 53: Brazil GCC In Vitro Diagnostics Industry Revenue (Million) Forecast, by Application 2019 & 2032
- Table 54: Brazil GCC In Vitro Diagnostics Industry Volume (K Unit) Forecast, by Application 2019 & 2032
- Table 55: Argentina GCC In Vitro Diagnostics Industry Revenue (Million) Forecast, by Application 2019 & 2032
- Table 56: Argentina GCC In Vitro Diagnostics Industry Volume (K Unit) Forecast, by Application 2019 & 2032
- Table 57: Rest of South America GCC In Vitro Diagnostics Industry Revenue (Million) Forecast, by Application 2019 & 2032
- Table 58: Rest of South America GCC In Vitro Diagnostics Industry Volume (K Unit) Forecast, by Application 2019 & 2032
- Table 59: Global GCC In Vitro Diagnostics Industry Revenue Million Forecast, by Technique 2019 & 2032
- Table 60: Global GCC In Vitro Diagnostics Industry Volume K Unit Forecast, by Technique 2019 & 2032
- Table 61: Global GCC In Vitro Diagnostics Industry Revenue Million Forecast, by Product 2019 & 2032
- Table 62: Global GCC In Vitro Diagnostics Industry Volume K Unit Forecast, by Product 2019 & 2032
- Table 63: Global GCC In Vitro Diagnostics Industry Revenue Million Forecast, by Usability 2019 & 2032
- Table 64: Global GCC In Vitro Diagnostics Industry Volume K Unit Forecast, by Usability 2019 & 2032
- Table 65: Global GCC In Vitro Diagnostics Industry Revenue Million Forecast, by Application 2019 & 2032
- Table 66: Global GCC In Vitro Diagnostics Industry Volume K Unit Forecast, by Application 2019 & 2032
- Table 67: Global GCC In Vitro Diagnostics Industry Revenue Million Forecast, by End User 2019 & 2032
- Table 68: Global GCC In Vitro Diagnostics Industry Volume K Unit Forecast, by End User 2019 & 2032
- Table 69: Global GCC In Vitro Diagnostics Industry Revenue Million Forecast, by Diagnostic Approach 2019 & 2032
- Table 70: Global GCC In Vitro Diagnostics Industry Volume K Unit Forecast, by Diagnostic Approach 2019 & 2032
- Table 71: Global GCC In Vitro Diagnostics Industry Revenue Million Forecast, by Country 2019 & 2032
- Table 72: Global GCC In Vitro Diagnostics Industry Volume K Unit Forecast, by Country 2019 & 2032
- Table 73: United Kingdom GCC In Vitro Diagnostics Industry Revenue (Million) Forecast, by Application 2019 & 2032
- Table 74: United Kingdom GCC In Vitro Diagnostics Industry Volume (K Unit) Forecast, by Application 2019 & 2032
- Table 75: Germany GCC In Vitro Diagnostics Industry Revenue (Million) Forecast, by Application 2019 & 2032
- Table 76: Germany GCC In Vitro Diagnostics Industry Volume (K Unit) Forecast, by Application 2019 & 2032
- Table 77: France GCC In Vitro Diagnostics Industry Revenue (Million) Forecast, by Application 2019 & 2032
- Table 78: France GCC In Vitro Diagnostics Industry Volume (K Unit) Forecast, by Application 2019 & 2032
- Table 79: Italy GCC In Vitro Diagnostics Industry Revenue (Million) Forecast, by Application 2019 & 2032
- Table 80: Italy GCC In Vitro Diagnostics Industry Volume (K Unit) Forecast, by Application 2019 & 2032
- Table 81: Spain GCC In Vitro Diagnostics Industry Revenue (Million) Forecast, by Application 2019 & 2032
- Table 82: Spain GCC In Vitro Diagnostics Industry Volume (K Unit) Forecast, by Application 2019 & 2032
- Table 83: Russia GCC In Vitro Diagnostics Industry Revenue (Million) Forecast, by Application 2019 & 2032
- Table 84: Russia GCC In Vitro Diagnostics Industry Volume (K Unit) Forecast, by Application 2019 & 2032
- Table 85: Benelux GCC In Vitro Diagnostics Industry Revenue (Million) Forecast, by Application 2019 & 2032
- Table 86: Benelux GCC In Vitro Diagnostics Industry Volume (K Unit) Forecast, by Application 2019 & 2032
- Table 87: Nordics GCC In Vitro Diagnostics Industry Revenue (Million) Forecast, by Application 2019 & 2032
- Table 88: Nordics GCC In Vitro Diagnostics Industry Volume (K Unit) Forecast, by Application 2019 & 2032
- Table 89: Rest of Europe GCC In Vitro Diagnostics Industry Revenue (Million) Forecast, by Application 2019 & 2032
- Table 90: Rest of Europe GCC In Vitro Diagnostics Industry Volume (K Unit) Forecast, by Application 2019 & 2032
- Table 91: Global GCC In Vitro Diagnostics Industry Revenue Million Forecast, by Technique 2019 & 2032
- Table 92: Global GCC In Vitro Diagnostics Industry Volume K Unit Forecast, by Technique 2019 & 2032
- Table 93: Global GCC In Vitro Diagnostics Industry Revenue Million Forecast, by Product 2019 & 2032
- Table 94: Global GCC In Vitro Diagnostics Industry Volume K Unit Forecast, by Product 2019 & 2032
- Table 95: Global GCC In Vitro Diagnostics Industry Revenue Million Forecast, by Usability 2019 & 2032
- Table 96: Global GCC In Vitro Diagnostics Industry Volume K Unit Forecast, by Usability 2019 & 2032
- Table 97: Global GCC In Vitro Diagnostics Industry Revenue Million Forecast, by Application 2019 & 2032
- Table 98: Global GCC In Vitro Diagnostics Industry Volume K Unit Forecast, by Application 2019 & 2032
- Table 99: Global GCC In Vitro Diagnostics Industry Revenue Million Forecast, by End User 2019 & 2032
- Table 100: Global GCC In Vitro Diagnostics Industry Volume K Unit Forecast, by End User 2019 & 2032
- Table 101: Global GCC In Vitro Diagnostics Industry Revenue Million Forecast, by Diagnostic Approach 2019 & 2032
- Table 102: Global GCC In Vitro Diagnostics Industry Volume K Unit Forecast, by Diagnostic Approach 2019 & 2032
- Table 103: Global GCC In Vitro Diagnostics Industry Revenue Million Forecast, by Country 2019 & 2032
- Table 104: Global GCC In Vitro Diagnostics Industry Volume K Unit Forecast, by Country 2019 & 2032
- Table 105: Turkey GCC In Vitro Diagnostics Industry Revenue (Million) Forecast, by Application 2019 & 2032
- Table 106: Turkey GCC In Vitro Diagnostics Industry Volume (K Unit) Forecast, by Application 2019 & 2032
- Table 107: Israel GCC In Vitro Diagnostics Industry Revenue (Million) Forecast, by Application 2019 & 2032
- Table 108: Israel GCC In Vitro Diagnostics Industry Volume (K Unit) Forecast, by Application 2019 & 2032
- Table 109: GCC GCC In Vitro Diagnostics Industry Revenue (Million) Forecast, by Application 2019 & 2032
- Table 110: GCC GCC In Vitro Diagnostics Industry Volume (K Unit) Forecast, by Application 2019 & 2032
- Table 111: North Africa GCC In Vitro Diagnostics Industry Revenue (Million) Forecast, by Application 2019 & 2032
- Table 112: North Africa GCC In Vitro Diagnostics Industry Volume (K Unit) Forecast, by Application 2019 & 2032
- Table 113: South Africa GCC In Vitro Diagnostics Industry Revenue (Million) Forecast, by Application 2019 & 2032
- Table 114: South Africa GCC In Vitro Diagnostics Industry Volume (K Unit) Forecast, by Application 2019 & 2032
- Table 115: Rest of Middle East & Africa GCC In Vitro Diagnostics Industry Revenue (Million) Forecast, by Application 2019 & 2032
- Table 116: Rest of Middle East & Africa GCC In Vitro Diagnostics Industry Volume (K Unit) Forecast, by Application 2019 & 2032
- Table 117: Global GCC In Vitro Diagnostics Industry Revenue Million Forecast, by Technique 2019 & 2032
- Table 118: Global GCC In Vitro Diagnostics Industry Volume K Unit Forecast, by Technique 2019 & 2032
- Table 119: Global GCC In Vitro Diagnostics Industry Revenue Million Forecast, by Product 2019 & 2032
- Table 120: Global GCC In Vitro Diagnostics Industry Volume K Unit Forecast, by Product 2019 & 2032
- Table 121: Global GCC In Vitro Diagnostics Industry Revenue Million Forecast, by Usability 2019 & 2032
- Table 122: Global GCC In Vitro Diagnostics Industry Volume K Unit Forecast, by Usability 2019 & 2032
- Table 123: Global GCC In Vitro Diagnostics Industry Revenue Million Forecast, by Application 2019 & 2032
- Table 124: Global GCC In Vitro Diagnostics Industry Volume K Unit Forecast, by Application 2019 & 2032
- Table 125: Global GCC In Vitro Diagnostics Industry Revenue Million Forecast, by End User 2019 & 2032
- Table 126: Global GCC In Vitro Diagnostics Industry Volume K Unit Forecast, by End User 2019 & 2032
- Table 127: Global GCC In Vitro Diagnostics Industry Revenue Million Forecast, by Diagnostic Approach 2019 & 2032
- Table 128: Global GCC In Vitro Diagnostics Industry Volume K Unit Forecast, by Diagnostic Approach 2019 & 2032
- Table 129: Global GCC In Vitro Diagnostics Industry Revenue Million Forecast, by Country 2019 & 2032
- Table 130: Global GCC In Vitro Diagnostics Industry Volume K Unit Forecast, by Country 2019 & 2032
- Table 131: China GCC In Vitro Diagnostics Industry Revenue (Million) Forecast, by Application 2019 & 2032
- Table 132: China GCC In Vitro Diagnostics Industry Volume (K Unit) Forecast, by Application 2019 & 2032
- Table 133: India GCC In Vitro Diagnostics Industry Revenue (Million) Forecast, by Application 2019 & 2032
- Table 134: India GCC In Vitro Diagnostics Industry Volume (K Unit) Forecast, by Application 2019 & 2032
- Table 135: Japan GCC In Vitro Diagnostics Industry Revenue (Million) Forecast, by Application 2019 & 2032
- Table 136: Japan GCC In Vitro Diagnostics Industry Volume (K Unit) Forecast, by Application 2019 & 2032
- Table 137: South Korea GCC In Vitro Diagnostics Industry Revenue (Million) Forecast, by Application 2019 & 2032
- Table 138: South Korea GCC In Vitro Diagnostics Industry Volume (K Unit) Forecast, by Application 2019 & 2032
- Table 139: ASEAN GCC In Vitro Diagnostics Industry Revenue (Million) Forecast, by Application 2019 & 2032
- Table 140: ASEAN GCC In Vitro Diagnostics Industry Volume (K Unit) Forecast, by Application 2019 & 2032
- Table 141: Oceania GCC In Vitro Diagnostics Industry Revenue (Million) Forecast, by Application 2019 & 2032
- Table 142: Oceania GCC In Vitro Diagnostics Industry Volume (K Unit) Forecast, by Application 2019 & 2032
- Table 143: Rest of Asia Pacific GCC In Vitro Diagnostics Industry Revenue (Million) Forecast, by Application 2019 & 2032
- Table 144: Rest of Asia Pacific GCC In Vitro Diagnostics Industry Volume (K Unit) Forecast, by Application 2019 & 2032
Frequently Asked Questions
1. What is the projected Compound Annual Growth Rate (CAGR) of the GCC In Vitro Diagnostics Industry?
The projected CAGR is approximately 5.10%.
2. Which companies are prominent players in the GCC In Vitro Diagnostics Industry?
Key companies in the market include Becton Dickinson and Company, BioMerieux SA, Grifols SA, Abbott Laboratories, Siemens Healthineers (Siemens Healthcare GmbH), Danaher Corporation, F Hoffmann-La Roche AG, DiaSorin, Thermo Fischer Scientific Inc, Qiagen NV, Sysmex Corporation, Bio-Rad Laboratories.
3. What are the main segments of the GCC In Vitro Diagnostics Industry?
The market segments include Technique, Product, Usability, Application, End User, Diagnostic Approach.
4. Can you provide details about the market size?
The market size is estimated to be USD 2.07 Million as of 2022.
5. What are some drivers contributing to market growth?
Growing Burden of Chronic Diseases and Infectious Diseases; Increasing Healthcare Expenditure.
6. What are the notable trends driving market growth?
Point-of-care diagnostics Segment is Expected to Witness Growth Over The Forecast Period..
7. Are there any restraints impacting market growth?
Stringent Regulations.
8. Can you provide examples of recent developments in the market?
July 2022: Saudi Arabia's Arabian International Healthcare Holding Company, TIBBIYAH, commenced a new Joint Venture (JV) with Swiss company Unilabs Diagnostics AB.
9. What pricing options are available for accessing the report?
Pricing options include single-user, multi-user, and enterprise licenses priced at USD 3800, USD 4500, and USD 5800 respectively.
10. Is the market size provided in terms of value or volume?
The market size is provided in terms of value, measured in Million and volume, measured in K Unit.
11. Are there any specific market keywords associated with the report?
Yes, the market keyword associated with the report is "GCC In Vitro Diagnostics Industry," which aids in identifying and referencing the specific market segment covered.
12. How do I determine which pricing option suits my needs best?
The pricing options vary based on user requirements and access needs. Individual users may opt for single-user licenses, while businesses requiring broader access may choose multi-user or enterprise licenses for cost-effective access to the report.
13. Are there any additional resources or data provided in the GCC In Vitro Diagnostics Industry report?
While the report offers comprehensive insights, it's advisable to review the specific contents or supplementary materials provided to ascertain if additional resources or data are available.
14. How can I stay updated on further developments or reports in the GCC In Vitro Diagnostics Industry?
To stay informed about further developments, trends, and reports in the GCC In Vitro Diagnostics Industry, consider subscribing to industry newsletters, following relevant companies and organizations, or regularly checking reputable industry news sources and publications.
Methodology
Step 1 - Identification of Relevant Samples Size from Population Database


Step 2 - Approaches for Defining Global Market Size (Value, Volume* & Price*)

Note*: In applicable scenarios
Step 3 - Data Sources
Primary Research
- Web Analytics
- Survey Reports
- Research Institute
- Latest Research Reports
- Opinion Leaders
Secondary Research
- Annual Reports
- White Paper
- Latest Press Release
- Industry Association
- Paid Database
- Investor Presentations

Step 4 - Data Triangulation
Involves using different sources of information in order to increase the validity of a study
These sources are likely to be stakeholders in a program - participants, other researchers, program staff, other community members, and so on.
Then we put all data in single framework & apply various statistical tools to find out the dynamic on the market.
During the analysis stage, feedback from the stakeholder groups would be compared to determine areas of agreement as well as areas of divergence


