
Key Insights
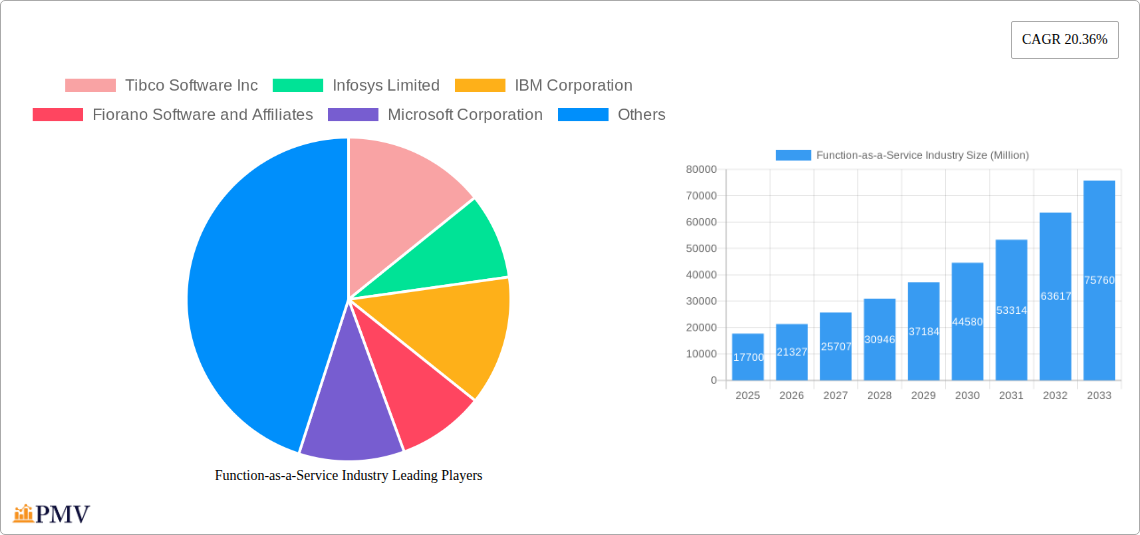
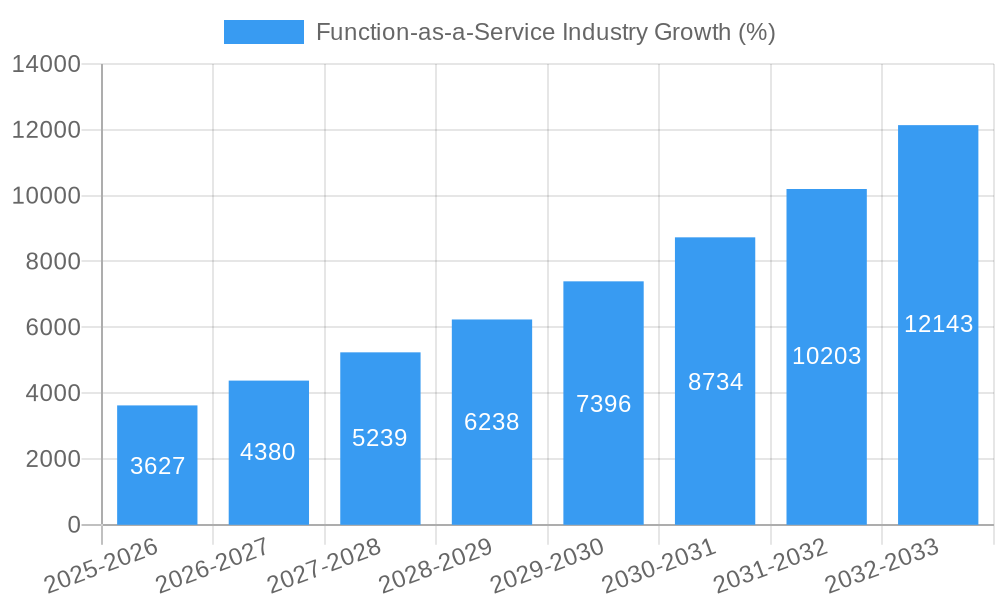
The Function-as-a-Service (FaaS) market is experiencing robust growth, projected to reach a market size of $17.70 billion in 2025 and exhibiting a Compound Annual Growth Rate (CAGR) of 20.36%. Several factors drive this expansion. The increasing adoption of cloud-native architectures and microservices, coupled with the need for scalable and cost-effective solutions, is fueling demand. Businesses are increasingly leveraging FaaS to reduce infrastructure management overhead and focus on core competencies. Furthermore, the rise of serverless computing and the integration of FaaS with other cloud services like AI and machine learning are accelerating market penetration across diverse sectors. The BFSI, IT and Telecommunication, and Retail industries are leading adopters, utilizing FaaS for applications ranging from real-time data processing and fraud detection to personalized customer experiences and improved operational efficiency. While the public cloud deployment model dominates currently, the hybrid cloud approach is gaining traction as organizations seek a balance between security, control, and scalability. The market is further segmented by organization size, with large enterprises exhibiting significant adoption rates, driven by their need to manage complex workflows and large-scale deployments.
Growth is expected to continue throughout the forecast period (2025-2033), propelled by the ongoing digital transformation and the increasing adoption of cloud computing globally. However, challenges remain, including security concerns, vendor lock-in, and the need for skilled developers proficient in serverless architectures. The competitive landscape is dynamic, with major players like Amazon Web Services, Microsoft, Google, and IBM actively investing in their FaaS offerings. Geographic expansion, particularly in the Asia-Pacific region driven by rapid digitalization in countries like India and China, will play a crucial role in shaping the future of the FaaS market. The continued innovation and development of FaaS platforms, along with improved integration with other cloud services, are poised to solidify its position as a critical component of modern cloud computing strategies.
Function-as-a-Service (FaaS) Industry Market Report: 2019-2033
This comprehensive report provides an in-depth analysis of the Function-as-a-Service (FaaS) industry, offering valuable insights for businesses and investors seeking to navigate this rapidly evolving market. The report covers the period 2019-2033, with a focus on the estimated year 2025. The global FaaS market is projected to reach $XX Million by 2033, exhibiting a robust Compound Annual Growth Rate (CAGR) of XX%. This detailed analysis covers market structure, competitive dynamics, industry trends, key players, and future growth prospects.
Function-as-a-Service Industry Market Structure & Competitive Dynamics
The FaaS market is characterized by a moderately concentrated landscape with several dominant players and numerous smaller niche providers. Key players such as Amazon Web Services (AWS), Microsoft Azure, and Google Cloud Platform (GCP) hold significant market share, benefiting from their established cloud infrastructure and extensive ecosystems. However, the market exhibits considerable dynamism due to ongoing innovation, strategic partnerships, and mergers & acquisitions (M&A) activity.
The market's innovation ecosystem is thriving, with continuous advancements in serverless computing, containerization technologies, and AI/ML integration driving new FaaS offerings. Regulatory frameworks, particularly around data privacy and security, significantly influence market development. Substitute products include traditional on-premise infrastructure and other cloud-based services; however, FaaS's inherent scalability and cost-effectiveness provide a strong competitive advantage. End-user trends point towards increasing adoption across diverse sectors, driven by the demand for agility, scalability, and reduced operational overhead.
M&A activity is a significant driver of market consolidation, with larger players strategically acquiring smaller companies to expand their capabilities and market reach. While precise deal values for all M&A activities are not publicly available, major deals have involved hundreds of millions of dollars, contributing to market consolidation and shaping the competitive landscape. For example, the estimated value of M&A activity in the last 5 years within the FaaS market is approximately $XX Million. Key players' market share estimates (2025) are: AWS (XX%), Microsoft Azure (XX%), Google Cloud (XX%), and Others (XX%).
Function-as-a-Service Industry Industry Trends & Insights
The FaaS market is experiencing significant growth fueled by several key factors. The increasing adoption of cloud-native architectures, the rise of microservices, and the growing demand for scalable and cost-effective solutions are primary drivers. Technological disruptions, particularly in areas such as serverless computing and edge computing, are further accelerating market expansion. Consumer preferences are shifting towards flexible and on-demand services, aligning perfectly with the characteristics of FaaS. The market exhibits strong competitive dynamics, with continuous innovation and strategic partnerships shaping its trajectory. Market penetration is expected to reach XX% by 2033.
The global market value for FaaS is expected to reach $XX Million in 2025 and then continue to grow at a CAGR of XX% to $XX Million by 2033. This substantial growth reflects the increasing adoption across various industries and the continued development of innovative FaaS solutions.
Dominant Markets & Segments in Function-as-a-Service Industry
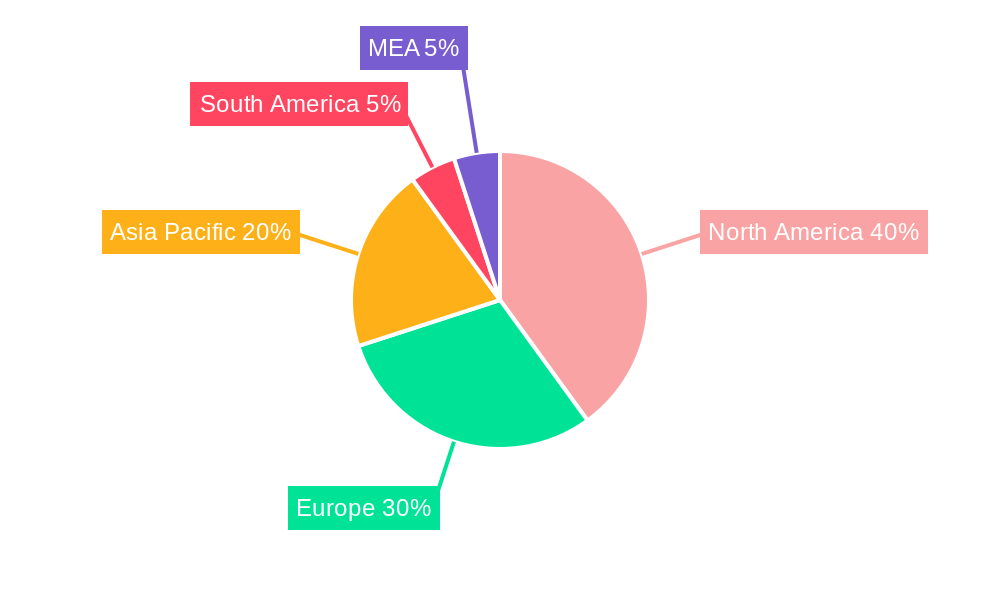
Leading Region/Country: North America currently dominates the FaaS market, driven by early adoption of cloud technologies, a robust technological infrastructure, and the presence of major cloud providers. However, the Asia-Pacific region is projected to experience the fastest growth rate in the forecast period due to increasing digitalization efforts and expanding cloud infrastructure investments. Europe is another significant market, with substantial growth expected from increased cloud adoption across various sectors.
By Type of Cloud Deployment: The Public cloud segment currently holds the largest market share, driven by its accessibility, cost-effectiveness, and ease of use. However, the Private and Hybrid cloud segments are gaining traction, driven by organizations' growing concerns regarding data security and compliance.
By Organization Size: Large Enterprises are the primary consumers of FaaS solutions due to their higher IT budgets and greater need for scalability and agility. However, SMEs are increasingly adopting FaaS, driven by its cost-effectiveness and ease of implementation.
By End-User: The BFSI sector is a major adopter of FaaS, driven by the need for secure and scalable solutions to manage financial transactions. The IT and Telecommunication, Retail, and Healthcare and Life Sciences sectors also show substantial FaaS adoption, driven by their unique requirements for scalability, flexibility, and cost optimization. Other end-users, including Media and Entertainment, Government, and Educational Institutions, are experiencing increased FaaS adoption. Specific growth drivers within each segment include economic policies encouraging digital transformation, robust technological infrastructure, and increased government support for cloud adoption.
Function-as-a-Service Industry Product Innovations
Recent product innovations in the FaaS space include enhanced serverless platforms, improved container orchestration tools, and the integration of AI/ML capabilities. These advancements allow developers to build and deploy applications more efficiently and effectively. Key competitive advantages for FaaS providers include superior scalability, ease of use, cost-effectiveness, and strong security features. These innovations are aligning with market demands for agility, efficiency, and reduced operational costs.
Report Segmentation & Scope
The report segments the FaaS market by:
Type of Cloud Deployment: Public, Private, and Hybrid, each with projected market sizes and competitive dynamics. Public cloud is expected to maintain its leading position, but Hybrid cloud is projected to see the fastest growth.
Organization Size: Small and Medium Enterprises (SMEs) and Large Enterprises, differentiated by their specific needs and adoption rates. Large enterprises currently drive the market, but SME adoption is a significant growth opportunity.
End-User: BFSI, IT and Telecommunication, Retail, Healthcare and Life Sciences, and Other End-Users (Media and Entertainment, Government, Educational Institutions), each with its own market dynamics and growth potential. The BFSI segment is a current leader, followed closely by IT and Telecommunication.
Key Drivers of Function-as-a-Service Industry Growth
Several factors are driving the growth of the FaaS market. The increasing adoption of cloud-native architectures and microservices significantly reduces development costs and increases deployment speed. Cost optimization through pay-as-you-go models and reduced operational overhead is a major attractor for businesses. Furthermore, supportive government policies and increased investment in digital infrastructure in various regions are accelerating market expansion. Technological advancements, including serverless computing, edge computing, and AI/ML integration, are further propelling growth.
Challenges in the Function-as-a-Service Industry Sector
Despite its immense potential, the FaaS market faces certain challenges. Maintaining security and compliance in a shared infrastructure environment is crucial. Vendor lock-in concerns can hinder adoption, while complex integration with existing systems and a lack of skilled developers can pose hurdles. Furthermore, pricing models and cost optimization strategies need continuous refinement. These challenges, while substantial, are not insurmountable and are addressed through ongoing innovation and market adaptation.
Leading Players in the Function-as-a-Service Industry Market
- Tibco Software Inc
- Infosys Limited
- IBM Corporation
- Fiorano Software and Affiliates
- Microsoft Corporation
- Amazon Web Services Inc
- Oracle Corporation
- Rogue Wave Software Inc
- Google Inc
- Dynatrace LLC
- SAP SE
Key Developments in Function-as-a-Service Industry Sector
December 2022: Tech Mahindra launched Cloud BlazeTech, an integrated platform aimed at optimizing economic value for cloud-powered organizations. This launch signifies a significant investment in the FaaS space and a move towards industry-neutral solutions.
November 2022: Hewlett Packard Enterprise and VMware announced the next phase of their partnership, integrating HPE GreenLake and VMware Cloud to offer a pay-as-you-go hybrid cloud solution. This collaboration strengthens the hybrid cloud segment of the FaaS market.
July 2022: Rackspace Technology launched the Rackspace Technology Cloud DNS v2 API, enhancing developer capabilities and providing free website domain hosting. This move increases developer accessibility and potentially fuels wider FaaS adoption.
March 2022: Microsoft Corp. launched advancements in cloud technology for healthcare and life sciences, including Azure Health Data Services. This highlights the growing importance of FaaS in specialized sectors and the potential for further expansion in this area.
Strategic Function-as-a-Service Industry Market Outlook
The FaaS market is poised for continued strong growth, driven by several factors. The increasing adoption of cloud-native architectures, the expansion of the hybrid cloud segment, and the continued development of innovative FaaS solutions will fuel market expansion. Strategic opportunities lie in providing specialized FaaS solutions tailored to specific industry needs and in focusing on enhancing security and compliance features. The market's future potential is significant, presenting opportunities for both established players and new entrants to capitalize on the growing demand for scalable, cost-effective, and secure cloud services.
Function-as-a-Service Industry Segmentation
-
1. Type of Cloud Deployment
- 1.1. Public
- 1.2. Private
- 1.3. Hybrid
-
2. Organization Size
- 2.1. Small and Medium Enterprises
- 2.2. Large Enterprises
-
3. End-User
- 3.1. BFSI
- 3.2. IT and Telecommunication
- 3.3. Retail
- 3.4. Healthcare and Life Sciences
- 3.5. Other En
Function-as-a-Service Industry Segmentation By Geography
- 1. North America
- 2. Europe
- 3. Asia Pacific
- 4. Rest of the World
Function-as-a-Service Industry REPORT HIGHLIGHTS
| Aspects | Details |
|---|---|
| Study Period | 2019-2033 |
| Base Year | 2024 |
| Estimated Year | 2025 |
| Forecast Period | 2025-2033 |
| Historical Period | 2019-2024 |
| Growth Rate | CAGR of 20.36% from 2019-2033 |
| Segmentation |
|
Table of Contents
- 1. Introduction
- 1.1. Research Scope
- 1.2. Market Segmentation
- 1.3. Research Methodology
- 1.4. Definitions and Assumptions
- 2. Executive Summary
- 2.1. Introduction
- 3. Market Dynamics
- 3.1. Introduction
- 3.2. Market Drivers
- 3.2.1. Growing shift towards serverless computing; Increasing focus towards agility of infrastructure and cost reduction
- 3.3. Market Restrains
- 3.3.1. Incompatibility of some applications with cloud environment
- 3.4. Market Trends
- 3.4.1. Hybrid Cloud to Drive the Growth of the Market for Security and Privacy Concerned End Users
- 4. Market Factor Analysis
- 4.1. Porters Five Forces
- 4.2. Supply/Value Chain
- 4.3. PESTEL analysis
- 4.4. Market Entropy
- 4.5. Patent/Trademark Analysis
- 5. Global Function-as-a-Service Industry Analysis, Insights and Forecast, 2019-2031
- 5.1. Market Analysis, Insights and Forecast - by Type of Cloud Deployment
- 5.1.1. Public
- 5.1.2. Private
- 5.1.3. Hybrid
- 5.2. Market Analysis, Insights and Forecast - by Organization Size
- 5.2.1. Small and Medium Enterprises
- 5.2.2. Large Enterprises
- 5.3. Market Analysis, Insights and Forecast - by End-User
- 5.3.1. BFSI
- 5.3.2. IT and Telecommunication
- 5.3.3. Retail
- 5.3.4. Healthcare and Life Sciences
- 5.3.5. Other En
- 5.4. Market Analysis, Insights and Forecast - by Region
- 5.4.1. North America
- 5.4.2. Europe
- 5.4.3. Asia Pacific
- 5.4.4. Rest of the World
- 5.1. Market Analysis, Insights and Forecast - by Type of Cloud Deployment
- 6. North America Function-as-a-Service Industry Analysis, Insights and Forecast, 2019-2031
- 6.1. Market Analysis, Insights and Forecast - by Type of Cloud Deployment
- 6.1.1. Public
- 6.1.2. Private
- 6.1.3. Hybrid
- 6.2. Market Analysis, Insights and Forecast - by Organization Size
- 6.2.1. Small and Medium Enterprises
- 6.2.2. Large Enterprises
- 6.3. Market Analysis, Insights and Forecast - by End-User
- 6.3.1. BFSI
- 6.3.2. IT and Telecommunication
- 6.3.3. Retail
- 6.3.4. Healthcare and Life Sciences
- 6.3.5. Other En
- 6.1. Market Analysis, Insights and Forecast - by Type of Cloud Deployment
- 7. Europe Function-as-a-Service Industry Analysis, Insights and Forecast, 2019-2031
- 7.1. Market Analysis, Insights and Forecast - by Type of Cloud Deployment
- 7.1.1. Public
- 7.1.2. Private
- 7.1.3. Hybrid
- 7.2. Market Analysis, Insights and Forecast - by Organization Size
- 7.2.1. Small and Medium Enterprises
- 7.2.2. Large Enterprises
- 7.3. Market Analysis, Insights and Forecast - by End-User
- 7.3.1. BFSI
- 7.3.2. IT and Telecommunication
- 7.3.3. Retail
- 7.3.4. Healthcare and Life Sciences
- 7.3.5. Other En
- 7.1. Market Analysis, Insights and Forecast - by Type of Cloud Deployment
- 8. Asia Pacific Function-as-a-Service Industry Analysis, Insights and Forecast, 2019-2031
- 8.1. Market Analysis, Insights and Forecast - by Type of Cloud Deployment
- 8.1.1. Public
- 8.1.2. Private
- 8.1.3. Hybrid
- 8.2. Market Analysis, Insights and Forecast - by Organization Size
- 8.2.1. Small and Medium Enterprises
- 8.2.2. Large Enterprises
- 8.3. Market Analysis, Insights and Forecast - by End-User
- 8.3.1. BFSI
- 8.3.2. IT and Telecommunication
- 8.3.3. Retail
- 8.3.4. Healthcare and Life Sciences
- 8.3.5. Other En
- 8.1. Market Analysis, Insights and Forecast - by Type of Cloud Deployment
- 9. Rest of the World Function-as-a-Service Industry Analysis, Insights and Forecast, 2019-2031
- 9.1. Market Analysis, Insights and Forecast - by Type of Cloud Deployment
- 9.1.1. Public
- 9.1.2. Private
- 9.1.3. Hybrid
- 9.2. Market Analysis, Insights and Forecast - by Organization Size
- 9.2.1. Small and Medium Enterprises
- 9.2.2. Large Enterprises
- 9.3. Market Analysis, Insights and Forecast - by End-User
- 9.3.1. BFSI
- 9.3.2. IT and Telecommunication
- 9.3.3. Retail
- 9.3.4. Healthcare and Life Sciences
- 9.3.5. Other En
- 9.1. Market Analysis, Insights and Forecast - by Type of Cloud Deployment
- 10. North America Function-as-a-Service Industry Analysis, Insights and Forecast, 2019-2031
- 10.1. Market Analysis, Insights and Forecast - By Country/Sub-region
- 10.1.1 United States
- 10.1.2 Canada
- 10.1.3 Mexico
- 11. Europe Function-as-a-Service Industry Analysis, Insights and Forecast, 2019-2031
- 11.1. Market Analysis, Insights and Forecast - By Country/Sub-region
- 11.1.1 Germany
- 11.1.2 United Kingdom
- 11.1.3 France
- 11.1.4 Spain
- 11.1.5 Italy
- 11.1.6 Spain
- 11.1.7 Belgium
- 11.1.8 Netherland
- 11.1.9 Nordics
- 11.1.10 Rest of Europe
- 12. Asia Pacific Function-as-a-Service Industry Analysis, Insights and Forecast, 2019-2031
- 12.1. Market Analysis, Insights and Forecast - By Country/Sub-region
- 12.1.1 China
- 12.1.2 Japan
- 12.1.3 India
- 12.1.4 South Korea
- 12.1.5 Southeast Asia
- 12.1.6 Australia
- 12.1.7 Indonesia
- 12.1.8 Phillipes
- 12.1.9 Singapore
- 12.1.10 Thailandc
- 12.1.11 Rest of Asia Pacific
- 13. South America Function-as-a-Service Industry Analysis, Insights and Forecast, 2019-2031
- 13.1. Market Analysis, Insights and Forecast - By Country/Sub-region
- 13.1.1 Brazil
- 13.1.2 Argentina
- 13.1.3 Peru
- 13.1.4 Chile
- 13.1.5 Colombia
- 13.1.6 Ecuador
- 13.1.7 Venezuela
- 13.1.8 Rest of South America
- 14. North America Function-as-a-Service Industry Analysis, Insights and Forecast, 2019-2031
- 14.1. Market Analysis, Insights and Forecast - By Country/Sub-region
- 14.1.1 United States
- 14.1.2 Canada
- 14.1.3 Mexico
- 15. MEA Function-as-a-Service Industry Analysis, Insights and Forecast, 2019-2031
- 15.1. Market Analysis, Insights and Forecast - By Country/Sub-region
- 15.1.1 United Arab Emirates
- 15.1.2 Saudi Arabia
- 15.1.3 South Africa
- 15.1.4 Rest of Middle East and Africa
- 16. Competitive Analysis
- 16.1. Global Market Share Analysis 2024
- 16.2. Company Profiles
- 16.2.1 Tibco Software Inc
- 16.2.1.1. Overview
- 16.2.1.2. Products
- 16.2.1.3. SWOT Analysis
- 16.2.1.4. Recent Developments
- 16.2.1.5. Financials (Based on Availability)
- 16.2.2 Infosys Limited
- 16.2.2.1. Overview
- 16.2.2.2. Products
- 16.2.2.3. SWOT Analysis
- 16.2.2.4. Recent Developments
- 16.2.2.5. Financials (Based on Availability)
- 16.2.3 IBM Corporation
- 16.2.3.1. Overview
- 16.2.3.2. Products
- 16.2.3.3. SWOT Analysis
- 16.2.3.4. Recent Developments
- 16.2.3.5. Financials (Based on Availability)
- 16.2.4 Fiorano Software and Affiliates
- 16.2.4.1. Overview
- 16.2.4.2. Products
- 16.2.4.3. SWOT Analysis
- 16.2.4.4. Recent Developments
- 16.2.4.5. Financials (Based on Availability)
- 16.2.5 Microsoft Corporation
- 16.2.5.1. Overview
- 16.2.5.2. Products
- 16.2.5.3. SWOT Analysis
- 16.2.5.4. Recent Developments
- 16.2.5.5. Financials (Based on Availability)
- 16.2.6 Amazon Web Services Inc
- 16.2.6.1. Overview
- 16.2.6.2. Products
- 16.2.6.3. SWOT Analysis
- 16.2.6.4. Recent Developments
- 16.2.6.5. Financials (Based on Availability)
- 16.2.7 Oracle Corporation
- 16.2.7.1. Overview
- 16.2.7.2. Products
- 16.2.7.3. SWOT Analysis
- 16.2.7.4. Recent Developments
- 16.2.7.5. Financials (Based on Availability)
- 16.2.8 Rogue Wave Software Inc
- 16.2.8.1. Overview
- 16.2.8.2. Products
- 16.2.8.3. SWOT Analysis
- 16.2.8.4. Recent Developments
- 16.2.8.5. Financials (Based on Availability)
- 16.2.9 Google Inc
- 16.2.9.1. Overview
- 16.2.9.2. Products
- 16.2.9.3. SWOT Analysis
- 16.2.9.4. Recent Developments
- 16.2.9.5. Financials (Based on Availability)
- 16.2.10 Dynatrace LLC
- 16.2.10.1. Overview
- 16.2.10.2. Products
- 16.2.10.3. SWOT Analysis
- 16.2.10.4. Recent Developments
- 16.2.10.5. Financials (Based on Availability)
- 16.2.11 SAP SE
- 16.2.11.1. Overview
- 16.2.11.2. Products
- 16.2.11.3. SWOT Analysis
- 16.2.11.4. Recent Developments
- 16.2.11.5. Financials (Based on Availability)
- 16.2.1 Tibco Software Inc
List of Figures
- Figure 1: Global Function-as-a-Service Industry Revenue Breakdown (Million, %) by Region 2024 & 2032
- Figure 2: Global Function-as-a-Service Industry Volume Breakdown (K Unit, %) by Region 2024 & 2032
- Figure 3: North America Function-as-a-Service Industry Revenue (Million), by Country 2024 & 2032
- Figure 4: North America Function-as-a-Service Industry Volume (K Unit), by Country 2024 & 2032
- Figure 5: North America Function-as-a-Service Industry Revenue Share (%), by Country 2024 & 2032
- Figure 6: North America Function-as-a-Service Industry Volume Share (%), by Country 2024 & 2032
- Figure 7: Europe Function-as-a-Service Industry Revenue (Million), by Country 2024 & 2032
- Figure 8: Europe Function-as-a-Service Industry Volume (K Unit), by Country 2024 & 2032
- Figure 9: Europe Function-as-a-Service Industry Revenue Share (%), by Country 2024 & 2032
- Figure 10: Europe Function-as-a-Service Industry Volume Share (%), by Country 2024 & 2032
- Figure 11: Asia Pacific Function-as-a-Service Industry Revenue (Million), by Country 2024 & 2032
- Figure 12: Asia Pacific Function-as-a-Service Industry Volume (K Unit), by Country 2024 & 2032
- Figure 13: Asia Pacific Function-as-a-Service Industry Revenue Share (%), by Country 2024 & 2032
- Figure 14: Asia Pacific Function-as-a-Service Industry Volume Share (%), by Country 2024 & 2032
- Figure 15: South America Function-as-a-Service Industry Revenue (Million), by Country 2024 & 2032
- Figure 16: South America Function-as-a-Service Industry Volume (K Unit), by Country 2024 & 2032
- Figure 17: South America Function-as-a-Service Industry Revenue Share (%), by Country 2024 & 2032
- Figure 18: South America Function-as-a-Service Industry Volume Share (%), by Country 2024 & 2032
- Figure 19: North America Function-as-a-Service Industry Revenue (Million), by Country 2024 & 2032
- Figure 20: North America Function-as-a-Service Industry Volume (K Unit), by Country 2024 & 2032
- Figure 21: North America Function-as-a-Service Industry Revenue Share (%), by Country 2024 & 2032
- Figure 22: North America Function-as-a-Service Industry Volume Share (%), by Country 2024 & 2032
- Figure 23: MEA Function-as-a-Service Industry Revenue (Million), by Country 2024 & 2032
- Figure 24: MEA Function-as-a-Service Industry Volume (K Unit), by Country 2024 & 2032
- Figure 25: MEA Function-as-a-Service Industry Revenue Share (%), by Country 2024 & 2032
- Figure 26: MEA Function-as-a-Service Industry Volume Share (%), by Country 2024 & 2032
- Figure 27: North America Function-as-a-Service Industry Revenue (Million), by Type of Cloud Deployment 2024 & 2032
- Figure 28: North America Function-as-a-Service Industry Volume (K Unit), by Type of Cloud Deployment 2024 & 2032
- Figure 29: North America Function-as-a-Service Industry Revenue Share (%), by Type of Cloud Deployment 2024 & 2032
- Figure 30: North America Function-as-a-Service Industry Volume Share (%), by Type of Cloud Deployment 2024 & 2032
- Figure 31: North America Function-as-a-Service Industry Revenue (Million), by Organization Size 2024 & 2032
- Figure 32: North America Function-as-a-Service Industry Volume (K Unit), by Organization Size 2024 & 2032
- Figure 33: North America Function-as-a-Service Industry Revenue Share (%), by Organization Size 2024 & 2032
- Figure 34: North America Function-as-a-Service Industry Volume Share (%), by Organization Size 2024 & 2032
- Figure 35: North America Function-as-a-Service Industry Revenue (Million), by End-User 2024 & 2032
- Figure 36: North America Function-as-a-Service Industry Volume (K Unit), by End-User 2024 & 2032
- Figure 37: North America Function-as-a-Service Industry Revenue Share (%), by End-User 2024 & 2032
- Figure 38: North America Function-as-a-Service Industry Volume Share (%), by End-User 2024 & 2032
- Figure 39: North America Function-as-a-Service Industry Revenue (Million), by Country 2024 & 2032
- Figure 40: North America Function-as-a-Service Industry Volume (K Unit), by Country 2024 & 2032
- Figure 41: North America Function-as-a-Service Industry Revenue Share (%), by Country 2024 & 2032
- Figure 42: North America Function-as-a-Service Industry Volume Share (%), by Country 2024 & 2032
- Figure 43: Europe Function-as-a-Service Industry Revenue (Million), by Type of Cloud Deployment 2024 & 2032
- Figure 44: Europe Function-as-a-Service Industry Volume (K Unit), by Type of Cloud Deployment 2024 & 2032
- Figure 45: Europe Function-as-a-Service Industry Revenue Share (%), by Type of Cloud Deployment 2024 & 2032
- Figure 46: Europe Function-as-a-Service Industry Volume Share (%), by Type of Cloud Deployment 2024 & 2032
- Figure 47: Europe Function-as-a-Service Industry Revenue (Million), by Organization Size 2024 & 2032
- Figure 48: Europe Function-as-a-Service Industry Volume (K Unit), by Organization Size 2024 & 2032
- Figure 49: Europe Function-as-a-Service Industry Revenue Share (%), by Organization Size 2024 & 2032
- Figure 50: Europe Function-as-a-Service Industry Volume Share (%), by Organization Size 2024 & 2032
- Figure 51: Europe Function-as-a-Service Industry Revenue (Million), by End-User 2024 & 2032
- Figure 52: Europe Function-as-a-Service Industry Volume (K Unit), by End-User 2024 & 2032
- Figure 53: Europe Function-as-a-Service Industry Revenue Share (%), by End-User 2024 & 2032
- Figure 54: Europe Function-as-a-Service Industry Volume Share (%), by End-User 2024 & 2032
- Figure 55: Europe Function-as-a-Service Industry Revenue (Million), by Country 2024 & 2032
- Figure 56: Europe Function-as-a-Service Industry Volume (K Unit), by Country 2024 & 2032
- Figure 57: Europe Function-as-a-Service Industry Revenue Share (%), by Country 2024 & 2032
- Figure 58: Europe Function-as-a-Service Industry Volume Share (%), by Country 2024 & 2032
- Figure 59: Asia Pacific Function-as-a-Service Industry Revenue (Million), by Type of Cloud Deployment 2024 & 2032
- Figure 60: Asia Pacific Function-as-a-Service Industry Volume (K Unit), by Type of Cloud Deployment 2024 & 2032
- Figure 61: Asia Pacific Function-as-a-Service Industry Revenue Share (%), by Type of Cloud Deployment 2024 & 2032
- Figure 62: Asia Pacific Function-as-a-Service Industry Volume Share (%), by Type of Cloud Deployment 2024 & 2032
- Figure 63: Asia Pacific Function-as-a-Service Industry Revenue (Million), by Organization Size 2024 & 2032
- Figure 64: Asia Pacific Function-as-a-Service Industry Volume (K Unit), by Organization Size 2024 & 2032
- Figure 65: Asia Pacific Function-as-a-Service Industry Revenue Share (%), by Organization Size 2024 & 2032
- Figure 66: Asia Pacific Function-as-a-Service Industry Volume Share (%), by Organization Size 2024 & 2032
- Figure 67: Asia Pacific Function-as-a-Service Industry Revenue (Million), by End-User 2024 & 2032
- Figure 68: Asia Pacific Function-as-a-Service Industry Volume (K Unit), by End-User 2024 & 2032
- Figure 69: Asia Pacific Function-as-a-Service Industry Revenue Share (%), by End-User 2024 & 2032
- Figure 70: Asia Pacific Function-as-a-Service Industry Volume Share (%), by End-User 2024 & 2032
- Figure 71: Asia Pacific Function-as-a-Service Industry Revenue (Million), by Country 2024 & 2032
- Figure 72: Asia Pacific Function-as-a-Service Industry Volume (K Unit), by Country 2024 & 2032
- Figure 73: Asia Pacific Function-as-a-Service Industry Revenue Share (%), by Country 2024 & 2032
- Figure 74: Asia Pacific Function-as-a-Service Industry Volume Share (%), by Country 2024 & 2032
- Figure 75: Rest of the World Function-as-a-Service Industry Revenue (Million), by Type of Cloud Deployment 2024 & 2032
- Figure 76: Rest of the World Function-as-a-Service Industry Volume (K Unit), by Type of Cloud Deployment 2024 & 2032
- Figure 77: Rest of the World Function-as-a-Service Industry Revenue Share (%), by Type of Cloud Deployment 2024 & 2032
- Figure 78: Rest of the World Function-as-a-Service Industry Volume Share (%), by Type of Cloud Deployment 2024 & 2032
- Figure 79: Rest of the World Function-as-a-Service Industry Revenue (Million), by Organization Size 2024 & 2032
- Figure 80: Rest of the World Function-as-a-Service Industry Volume (K Unit), by Organization Size 2024 & 2032
- Figure 81: Rest of the World Function-as-a-Service Industry Revenue Share (%), by Organization Size 2024 & 2032
- Figure 82: Rest of the World Function-as-a-Service Industry Volume Share (%), by Organization Size 2024 & 2032
- Figure 83: Rest of the World Function-as-a-Service Industry Revenue (Million), by End-User 2024 & 2032
- Figure 84: Rest of the World Function-as-a-Service Industry Volume (K Unit), by End-User 2024 & 2032
- Figure 85: Rest of the World Function-as-a-Service Industry Revenue Share (%), by End-User 2024 & 2032
- Figure 86: Rest of the World Function-as-a-Service Industry Volume Share (%), by End-User 2024 & 2032
- Figure 87: Rest of the World Function-as-a-Service Industry Revenue (Million), by Country 2024 & 2032
- Figure 88: Rest of the World Function-as-a-Service Industry Volume (K Unit), by Country 2024 & 2032
- Figure 89: Rest of the World Function-as-a-Service Industry Revenue Share (%), by Country 2024 & 2032
- Figure 90: Rest of the World Function-as-a-Service Industry Volume Share (%), by Country 2024 & 2032
List of Tables
- Table 1: Global Function-as-a-Service Industry Revenue Million Forecast, by Region 2019 & 2032
- Table 2: Global Function-as-a-Service Industry Volume K Unit Forecast, by Region 2019 & 2032
- Table 3: Global Function-as-a-Service Industry Revenue Million Forecast, by Type of Cloud Deployment 2019 & 2032
- Table 4: Global Function-as-a-Service Industry Volume K Unit Forecast, by Type of Cloud Deployment 2019 & 2032
- Table 5: Global Function-as-a-Service Industry Revenue Million Forecast, by Organization Size 2019 & 2032
- Table 6: Global Function-as-a-Service Industry Volume K Unit Forecast, by Organization Size 2019 & 2032
- Table 7: Global Function-as-a-Service Industry Revenue Million Forecast, by End-User 2019 & 2032
- Table 8: Global Function-as-a-Service Industry Volume K Unit Forecast, by End-User 2019 & 2032
- Table 9: Global Function-as-a-Service Industry Revenue Million Forecast, by Region 2019 & 2032
- Table 10: Global Function-as-a-Service Industry Volume K Unit Forecast, by Region 2019 & 2032
- Table 11: Global Function-as-a-Service Industry Revenue Million Forecast, by Country 2019 & 2032
- Table 12: Global Function-as-a-Service Industry Volume K Unit Forecast, by Country 2019 & 2032
- Table 13: United States Function-as-a-Service Industry Revenue (Million) Forecast, by Application 2019 & 2032
- Table 14: United States Function-as-a-Service Industry Volume (K Unit) Forecast, by Application 2019 & 2032
- Table 15: Canada Function-as-a-Service Industry Revenue (Million) Forecast, by Application 2019 & 2032
- Table 16: Canada Function-as-a-Service Industry Volume (K Unit) Forecast, by Application 2019 & 2032
- Table 17: Mexico Function-as-a-Service Industry Revenue (Million) Forecast, by Application 2019 & 2032
- Table 18: Mexico Function-as-a-Service Industry Volume (K Unit) Forecast, by Application 2019 & 2032
- Table 19: Global Function-as-a-Service Industry Revenue Million Forecast, by Country 2019 & 2032
- Table 20: Global Function-as-a-Service Industry Volume K Unit Forecast, by Country 2019 & 2032
- Table 21: Germany Function-as-a-Service Industry Revenue (Million) Forecast, by Application 2019 & 2032
- Table 22: Germany Function-as-a-Service Industry Volume (K Unit) Forecast, by Application 2019 & 2032
- Table 23: United Kingdom Function-as-a-Service Industry Revenue (Million) Forecast, by Application 2019 & 2032
- Table 24: United Kingdom Function-as-a-Service Industry Volume (K Unit) Forecast, by Application 2019 & 2032
- Table 25: France Function-as-a-Service Industry Revenue (Million) Forecast, by Application 2019 & 2032
- Table 26: France Function-as-a-Service Industry Volume (K Unit) Forecast, by Application 2019 & 2032
- Table 27: Spain Function-as-a-Service Industry Revenue (Million) Forecast, by Application 2019 & 2032
- Table 28: Spain Function-as-a-Service Industry Volume (K Unit) Forecast, by Application 2019 & 2032
- Table 29: Italy Function-as-a-Service Industry Revenue (Million) Forecast, by Application 2019 & 2032
- Table 30: Italy Function-as-a-Service Industry Volume (K Unit) Forecast, by Application 2019 & 2032
- Table 31: Spain Function-as-a-Service Industry Revenue (Million) Forecast, by Application 2019 & 2032
- Table 32: Spain Function-as-a-Service Industry Volume (K Unit) Forecast, by Application 2019 & 2032
- Table 33: Belgium Function-as-a-Service Industry Revenue (Million) Forecast, by Application 2019 & 2032
- Table 34: Belgium Function-as-a-Service Industry Volume (K Unit) Forecast, by Application 2019 & 2032
- Table 35: Netherland Function-as-a-Service Industry Revenue (Million) Forecast, by Application 2019 & 2032
- Table 36: Netherland Function-as-a-Service Industry Volume (K Unit) Forecast, by Application 2019 & 2032
- Table 37: Nordics Function-as-a-Service Industry Revenue (Million) Forecast, by Application 2019 & 2032
- Table 38: Nordics Function-as-a-Service Industry Volume (K Unit) Forecast, by Application 2019 & 2032
- Table 39: Rest of Europe Function-as-a-Service Industry Revenue (Million) Forecast, by Application 2019 & 2032
- Table 40: Rest of Europe Function-as-a-Service Industry Volume (K Unit) Forecast, by Application 2019 & 2032
- Table 41: Global Function-as-a-Service Industry Revenue Million Forecast, by Country 2019 & 2032
- Table 42: Global Function-as-a-Service Industry Volume K Unit Forecast, by Country 2019 & 2032
- Table 43: China Function-as-a-Service Industry Revenue (Million) Forecast, by Application 2019 & 2032
- Table 44: China Function-as-a-Service Industry Volume (K Unit) Forecast, by Application 2019 & 2032
- Table 45: Japan Function-as-a-Service Industry Revenue (Million) Forecast, by Application 2019 & 2032
- Table 46: Japan Function-as-a-Service Industry Volume (K Unit) Forecast, by Application 2019 & 2032
- Table 47: India Function-as-a-Service Industry Revenue (Million) Forecast, by Application 2019 & 2032
- Table 48: India Function-as-a-Service Industry Volume (K Unit) Forecast, by Application 2019 & 2032
- Table 49: South Korea Function-as-a-Service Industry Revenue (Million) Forecast, by Application 2019 & 2032
- Table 50: South Korea Function-as-a-Service Industry Volume (K Unit) Forecast, by Application 2019 & 2032
- Table 51: Southeast Asia Function-as-a-Service Industry Revenue (Million) Forecast, by Application 2019 & 2032
- Table 52: Southeast Asia Function-as-a-Service Industry Volume (K Unit) Forecast, by Application 2019 & 2032
- Table 53: Australia Function-as-a-Service Industry Revenue (Million) Forecast, by Application 2019 & 2032
- Table 54: Australia Function-as-a-Service Industry Volume (K Unit) Forecast, by Application 2019 & 2032
- Table 55: Indonesia Function-as-a-Service Industry Revenue (Million) Forecast, by Application 2019 & 2032
- Table 56: Indonesia Function-as-a-Service Industry Volume (K Unit) Forecast, by Application 2019 & 2032
- Table 57: Phillipes Function-as-a-Service Industry Revenue (Million) Forecast, by Application 2019 & 2032
- Table 58: Phillipes Function-as-a-Service Industry Volume (K Unit) Forecast, by Application 2019 & 2032
- Table 59: Singapore Function-as-a-Service Industry Revenue (Million) Forecast, by Application 2019 & 2032
- Table 60: Singapore Function-as-a-Service Industry Volume (K Unit) Forecast, by Application 2019 & 2032
- Table 61: Thailandc Function-as-a-Service Industry Revenue (Million) Forecast, by Application 2019 & 2032
- Table 62: Thailandc Function-as-a-Service Industry Volume (K Unit) Forecast, by Application 2019 & 2032
- Table 63: Rest of Asia Pacific Function-as-a-Service Industry Revenue (Million) Forecast, by Application 2019 & 2032
- Table 64: Rest of Asia Pacific Function-as-a-Service Industry Volume (K Unit) Forecast, by Application 2019 & 2032
- Table 65: Global Function-as-a-Service Industry Revenue Million Forecast, by Country 2019 & 2032
- Table 66: Global Function-as-a-Service Industry Volume K Unit Forecast, by Country 2019 & 2032
- Table 67: Brazil Function-as-a-Service Industry Revenue (Million) Forecast, by Application 2019 & 2032
- Table 68: Brazil Function-as-a-Service Industry Volume (K Unit) Forecast, by Application 2019 & 2032
- Table 69: Argentina Function-as-a-Service Industry Revenue (Million) Forecast, by Application 2019 & 2032
- Table 70: Argentina Function-as-a-Service Industry Volume (K Unit) Forecast, by Application 2019 & 2032
- Table 71: Peru Function-as-a-Service Industry Revenue (Million) Forecast, by Application 2019 & 2032
- Table 72: Peru Function-as-a-Service Industry Volume (K Unit) Forecast, by Application 2019 & 2032
- Table 73: Chile Function-as-a-Service Industry Revenue (Million) Forecast, by Application 2019 & 2032
- Table 74: Chile Function-as-a-Service Industry Volume (K Unit) Forecast, by Application 2019 & 2032
- Table 75: Colombia Function-as-a-Service Industry Revenue (Million) Forecast, by Application 2019 & 2032
- Table 76: Colombia Function-as-a-Service Industry Volume (K Unit) Forecast, by Application 2019 & 2032
- Table 77: Ecuador Function-as-a-Service Industry Revenue (Million) Forecast, by Application 2019 & 2032
- Table 78: Ecuador Function-as-a-Service Industry Volume (K Unit) Forecast, by Application 2019 & 2032
- Table 79: Venezuela Function-as-a-Service Industry Revenue (Million) Forecast, by Application 2019 & 2032
- Table 80: Venezuela Function-as-a-Service Industry Volume (K Unit) Forecast, by Application 2019 & 2032
- Table 81: Rest of South America Function-as-a-Service Industry Revenue (Million) Forecast, by Application 2019 & 2032
- Table 82: Rest of South America Function-as-a-Service Industry Volume (K Unit) Forecast, by Application 2019 & 2032
- Table 83: Global Function-as-a-Service Industry Revenue Million Forecast, by Country 2019 & 2032
- Table 84: Global Function-as-a-Service Industry Volume K Unit Forecast, by Country 2019 & 2032
- Table 85: United States Function-as-a-Service Industry Revenue (Million) Forecast, by Application 2019 & 2032
- Table 86: United States Function-as-a-Service Industry Volume (K Unit) Forecast, by Application 2019 & 2032
- Table 87: Canada Function-as-a-Service Industry Revenue (Million) Forecast, by Application 2019 & 2032
- Table 88: Canada Function-as-a-Service Industry Volume (K Unit) Forecast, by Application 2019 & 2032
- Table 89: Mexico Function-as-a-Service Industry Revenue (Million) Forecast, by Application 2019 & 2032
- Table 90: Mexico Function-as-a-Service Industry Volume (K Unit) Forecast, by Application 2019 & 2032
- Table 91: Global Function-as-a-Service Industry Revenue Million Forecast, by Country 2019 & 2032
- Table 92: Global Function-as-a-Service Industry Volume K Unit Forecast, by Country 2019 & 2032
- Table 93: United Arab Emirates Function-as-a-Service Industry Revenue (Million) Forecast, by Application 2019 & 2032
- Table 94: United Arab Emirates Function-as-a-Service Industry Volume (K Unit) Forecast, by Application 2019 & 2032
- Table 95: Saudi Arabia Function-as-a-Service Industry Revenue (Million) Forecast, by Application 2019 & 2032
- Table 96: Saudi Arabia Function-as-a-Service Industry Volume (K Unit) Forecast, by Application 2019 & 2032
- Table 97: South Africa Function-as-a-Service Industry Revenue (Million) Forecast, by Application 2019 & 2032
- Table 98: South Africa Function-as-a-Service Industry Volume (K Unit) Forecast, by Application 2019 & 2032
- Table 99: Rest of Middle East and Africa Function-as-a-Service Industry Revenue (Million) Forecast, by Application 2019 & 2032
- Table 100: Rest of Middle East and Africa Function-as-a-Service Industry Volume (K Unit) Forecast, by Application 2019 & 2032
- Table 101: Global Function-as-a-Service Industry Revenue Million Forecast, by Type of Cloud Deployment 2019 & 2032
- Table 102: Global Function-as-a-Service Industry Volume K Unit Forecast, by Type of Cloud Deployment 2019 & 2032
- Table 103: Global Function-as-a-Service Industry Revenue Million Forecast, by Organization Size 2019 & 2032
- Table 104: Global Function-as-a-Service Industry Volume K Unit Forecast, by Organization Size 2019 & 2032
- Table 105: Global Function-as-a-Service Industry Revenue Million Forecast, by End-User 2019 & 2032
- Table 106: Global Function-as-a-Service Industry Volume K Unit Forecast, by End-User 2019 & 2032
- Table 107: Global Function-as-a-Service Industry Revenue Million Forecast, by Country 2019 & 2032
- Table 108: Global Function-as-a-Service Industry Volume K Unit Forecast, by Country 2019 & 2032
- Table 109: Global Function-as-a-Service Industry Revenue Million Forecast, by Type of Cloud Deployment 2019 & 2032
- Table 110: Global Function-as-a-Service Industry Volume K Unit Forecast, by Type of Cloud Deployment 2019 & 2032
- Table 111: Global Function-as-a-Service Industry Revenue Million Forecast, by Organization Size 2019 & 2032
- Table 112: Global Function-as-a-Service Industry Volume K Unit Forecast, by Organization Size 2019 & 2032
- Table 113: Global Function-as-a-Service Industry Revenue Million Forecast, by End-User 2019 & 2032
- Table 114: Global Function-as-a-Service Industry Volume K Unit Forecast, by End-User 2019 & 2032
- Table 115: Global Function-as-a-Service Industry Revenue Million Forecast, by Country 2019 & 2032
- Table 116: Global Function-as-a-Service Industry Volume K Unit Forecast, by Country 2019 & 2032
- Table 117: Global Function-as-a-Service Industry Revenue Million Forecast, by Type of Cloud Deployment 2019 & 2032
- Table 118: Global Function-as-a-Service Industry Volume K Unit Forecast, by Type of Cloud Deployment 2019 & 2032
- Table 119: Global Function-as-a-Service Industry Revenue Million Forecast, by Organization Size 2019 & 2032
- Table 120: Global Function-as-a-Service Industry Volume K Unit Forecast, by Organization Size 2019 & 2032
- Table 121: Global Function-as-a-Service Industry Revenue Million Forecast, by End-User 2019 & 2032
- Table 122: Global Function-as-a-Service Industry Volume K Unit Forecast, by End-User 2019 & 2032
- Table 123: Global Function-as-a-Service Industry Revenue Million Forecast, by Country 2019 & 2032
- Table 124: Global Function-as-a-Service Industry Volume K Unit Forecast, by Country 2019 & 2032
- Table 125: Global Function-as-a-Service Industry Revenue Million Forecast, by Type of Cloud Deployment 2019 & 2032
- Table 126: Global Function-as-a-Service Industry Volume K Unit Forecast, by Type of Cloud Deployment 2019 & 2032
- Table 127: Global Function-as-a-Service Industry Revenue Million Forecast, by Organization Size 2019 & 2032
- Table 128: Global Function-as-a-Service Industry Volume K Unit Forecast, by Organization Size 2019 & 2032
- Table 129: Global Function-as-a-Service Industry Revenue Million Forecast, by End-User 2019 & 2032
- Table 130: Global Function-as-a-Service Industry Volume K Unit Forecast, by End-User 2019 & 2032
- Table 131: Global Function-as-a-Service Industry Revenue Million Forecast, by Country 2019 & 2032
- Table 132: Global Function-as-a-Service Industry Volume K Unit Forecast, by Country 2019 & 2032
Frequently Asked Questions
1. What is the projected Compound Annual Growth Rate (CAGR) of the Function-as-a-Service Industry?
The projected CAGR is approximately 20.36%.
2. Which companies are prominent players in the Function-as-a-Service Industry?
Key companies in the market include Tibco Software Inc, Infosys Limited, IBM Corporation, Fiorano Software and Affiliates, Microsoft Corporation, Amazon Web Services Inc, Oracle Corporation, Rogue Wave Software Inc, Google Inc, Dynatrace LLC, SAP SE.
3. What are the main segments of the Function-as-a-Service Industry?
The market segments include Type of Cloud Deployment, Organization Size, End-User.
4. Can you provide details about the market size?
The market size is estimated to be USD 17.70 Million as of 2022.
5. What are some drivers contributing to market growth?
Growing shift towards serverless computing; Increasing focus towards agility of infrastructure and cost reduction.
6. What are the notable trends driving market growth?
Hybrid Cloud to Drive the Growth of the Market for Security and Privacy Concerned End Users.
7. Are there any restraints impacting market growth?
Incompatibility of some applications with cloud environment.
8. Can you provide examples of recent developments in the market?
December 2022: To optimize economic value for cloud-powered organizations worldwide, Tech Mahindra, a leading provider of digital transformation, consultancy, and business re-engineering services and solutions, launched Cloud BlazeTech, an integrated, industry-neutral platform. To accelerate business digital transformation, the firm will continue to invest in cloud services & ties with hyperscalers.
9. What pricing options are available for accessing the report?
Pricing options include single-user, multi-user, and enterprise licenses priced at USD 4750, USD 5250, and USD 8750 respectively.
10. Is the market size provided in terms of value or volume?
The market size is provided in terms of value, measured in Million and volume, measured in K Unit.
11. Are there any specific market keywords associated with the report?
Yes, the market keyword associated with the report is "Function-as-a-Service Industry," which aids in identifying and referencing the specific market segment covered.
12. How do I determine which pricing option suits my needs best?
The pricing options vary based on user requirements and access needs. Individual users may opt for single-user licenses, while businesses requiring broader access may choose multi-user or enterprise licenses for cost-effective access to the report.
13. Are there any additional resources or data provided in the Function-as-a-Service Industry report?
While the report offers comprehensive insights, it's advisable to review the specific contents or supplementary materials provided to ascertain if additional resources or data are available.
14. How can I stay updated on further developments or reports in the Function-as-a-Service Industry?
To stay informed about further developments, trends, and reports in the Function-as-a-Service Industry, consider subscribing to industry newsletters, following relevant companies and organizations, or regularly checking reputable industry news sources and publications.
Methodology
Step 1 - Identification of Relevant Samples Size from Population Database


Step 2 - Approaches for Defining Global Market Size (Value, Volume* & Price*)

Note*: In applicable scenarios
Step 3 - Data Sources
Primary Research
- Web Analytics
- Survey Reports
- Research Institute
- Latest Research Reports
- Opinion Leaders
Secondary Research
- Annual Reports
- White Paper
- Latest Press Release
- Industry Association
- Paid Database
- Investor Presentations

Step 4 - Data Triangulation
Involves using different sources of information in order to increase the validity of a study
These sources are likely to be stakeholders in a program - participants, other researchers, program staff, other community members, and so on.
Then we put all data in single framework & apply various statistical tools to find out the dynamic on the market.
During the analysis stage, feedback from the stakeholder groups would be compared to determine areas of agreement as well as areas of divergence


