
Key Insights
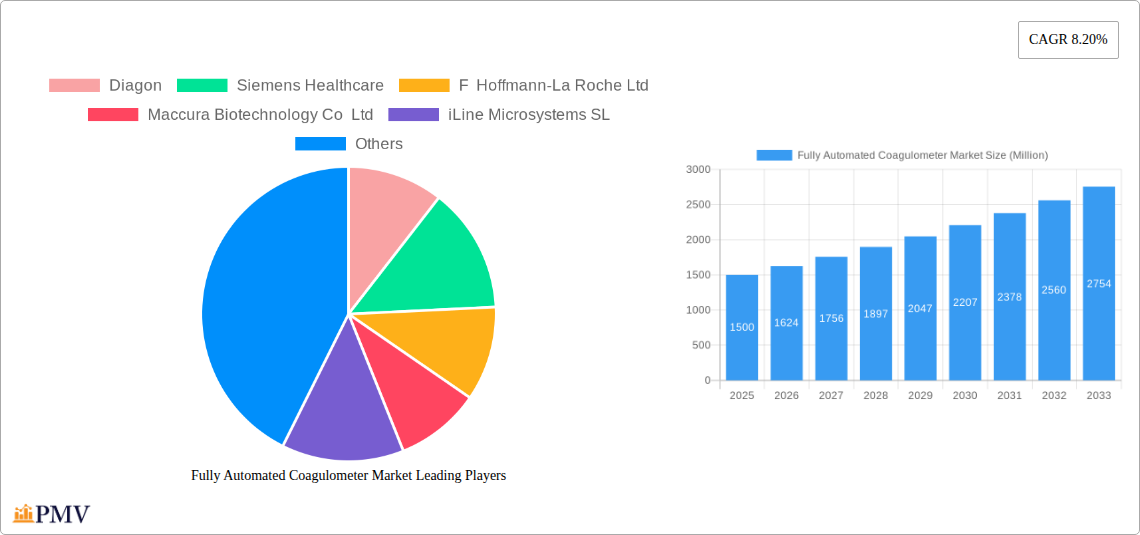
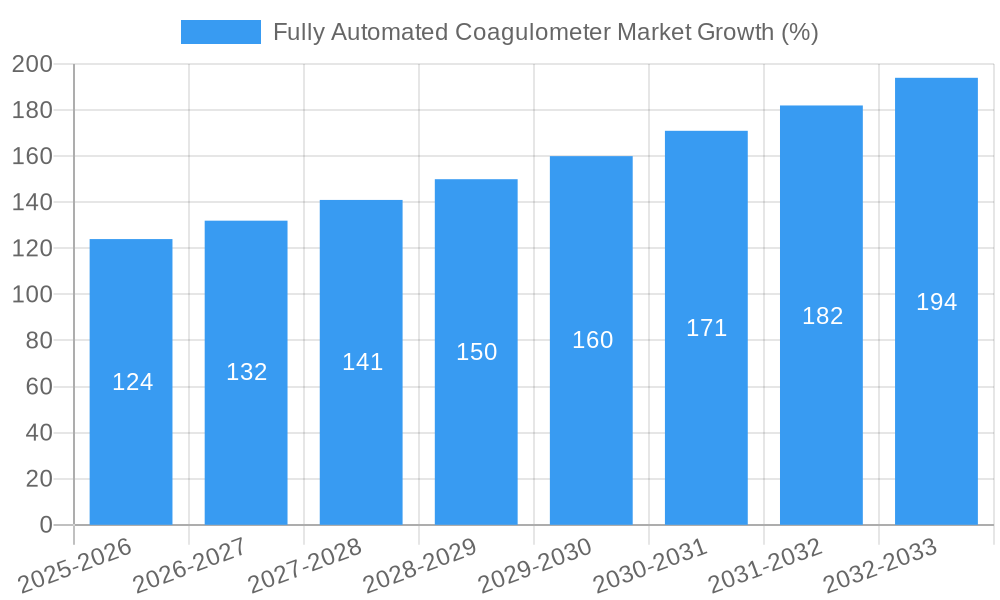
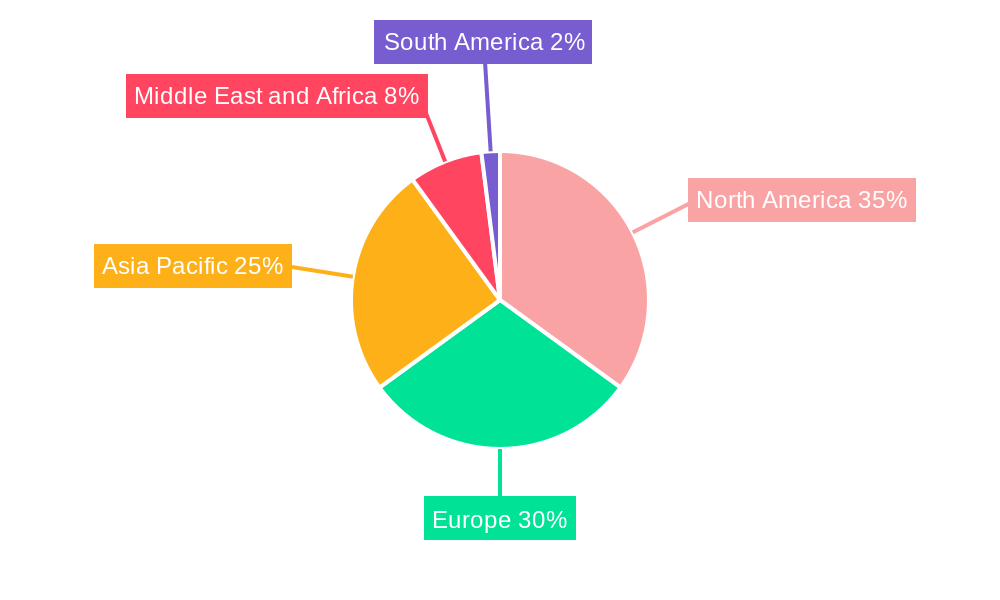
The fully automated coagulometer market is experiencing robust growth, driven by the increasing prevalence of chronic diseases requiring coagulation monitoring, the rising demand for faster and more accurate diagnostic results, and the growing adoption of point-of-care testing. The market's expansion is further fueled by technological advancements leading to more sophisticated and user-friendly instruments with enhanced analytical capabilities. Key segments within this market include coagulation systems, consumables (reagents and controls), and accessories. Hospitals and diagnostic laboratories constitute the largest end-user segments, reflecting the critical role of coagulation testing in both inpatient and outpatient care. While the market exhibits significant growth potential across regions, North America and Europe currently hold a larger market share due to established healthcare infrastructure and higher per capita healthcare spending. However, the Asia-Pacific region is poised for substantial growth, driven by rising disposable incomes, increasing healthcare awareness, and expanding healthcare facilities. Competitive dynamics are shaped by the presence of both established players like Siemens Healthcare and Roche, and emerging companies offering innovative solutions and cost-effective alternatives. The market's overall trajectory indicates sustained growth throughout the forecast period (2025-2033). Factors such as stringent regulatory approvals, high initial investment costs, and the potential for skilled labor shortages represent potential restraints.
This market is expected to continue its upward trajectory, driven by factors such as the increasing prevalence of cardiovascular diseases and other conditions necessitating coagulation testing. The integration of advanced technologies like artificial intelligence (AI) and machine learning (ML) in coagulometers is likely to improve diagnostic accuracy and efficiency further accelerating market growth. The demand for home-based testing and telemedicine is also creating opportunities for miniaturized and portable automated coagulometers. Competitive pressures are likely to persist, with established players focusing on strategic partnerships and product innovation to maintain market share, while emerging players seek to gain traction with cost-effective solutions and specialized applications. Sustained investment in R&D is essential to meet the evolving needs of the healthcare industry and to address the technological challenges and regulatory complexities associated with advanced coagulation testing devices.
Fully Automated Coagulometer Market: A Comprehensive Market Analysis (2019-2033)
This in-depth report provides a comprehensive analysis of the Fully Automated Coagulometer Market, offering valuable insights into market dynamics, competitive landscape, and future growth potential. Covering the period from 2019 to 2033, with a base year of 2025 and a forecast period of 2025-2033, this report is an essential resource for industry professionals, investors, and anyone seeking to understand this evolving market. The market is segmented by product type (Coagulation System, Consumables, Accessories) and end-user (Hospitals, Diagnostic Laboratories, Other End Users). The report features key players such as Diagon, Siemens Healthcare, F Hoffmann-La Roche Ltd, Maccura Biotechnology Co Ltd, iLine Microsystems SL, Horiba, HemoSonics LLC, Erba Group, Haemonetics Corporation, and Werfen.
Fully Automated Coagulometer Market Market Structure & Competitive Dynamics
The Fully Automated Coagulometer market exhibits a moderately concentrated structure, with a few major players holding significant market share. The competitive landscape is characterized by ongoing innovation, strategic partnerships, and mergers & acquisitions (M&A) activities. Regulatory frameworks, particularly those governing in-vitro diagnostics (IVDs), significantly influence market dynamics. The market also experiences competition from substitute technologies, although these are often less efficient or accurate. End-user trends, particularly the increasing adoption of point-of-care testing and automation in hospitals and diagnostic laboratories, are driving market growth.
- Market Concentration: The top 5 players account for approximately xx% of the global market share in 2024 (estimated).
- Innovation Ecosystems: Significant investment in R&D drives advancements in coagulation technology, miniaturization, and automation.
- Regulatory Frameworks: Stringent regulatory compliance requirements (e.g., FDA, CE marking) impact market entry and product development.
- M&A Activity: The market has witnessed several M&A transactions in recent years, such as Grifols' divestment of its hemostasis business for USD 25.0 Million in October 2021. This activity indicates consolidation and strategic expansion within the market. The average M&A deal value in the past five years was approximately USD xx Million.
Fully Automated Coagulometer Market Industry Trends & Insights
The Fully Automated Coagulometer market is projected to experience substantial growth, with a Compound Annual Growth Rate (CAGR) of xx% during the forecast period (2025-2033). This growth is primarily driven by factors such as the increasing prevalence of cardiovascular diseases, rising demand for accurate and rapid coagulation testing, technological advancements in automated systems, and the growing preference for point-of-care testing. The market penetration of fully automated coagulometers in developing economies is also expected to increase significantly. The market is also witnessing disruptions due to technological advancements like the introduction of novel POC devices and improved connectivity features, enhancing the efficiency and accuracy of diagnostic testing. Market competitiveness continues to intensify with ongoing product innovation and strategic alliances among market players.
Dominant Markets & Segments in Fully Automated Coagulometer Market
The North American region is expected to dominate the Fully Automated Coagulometer market throughout the forecast period, driven by factors such as advanced healthcare infrastructure, high adoption rates of advanced technologies, and favorable regulatory environment.
Leading Segment (Product Type): Coagulation Systems hold the largest market share, followed by consumables and then accessories. This is due to high demand for the core testing equipment.
Leading Segment (End User): Hospitals represent the largest end-user segment due to their high volume of coagulation tests and investment capacity.
Key Drivers (North America):
- Robust healthcare infrastructure and funding
- High prevalence of cardiovascular diseases
- Stringent regulatory frameworks driving quality improvement
Key Drivers (Other Regions): Growth in other regions will be fueled by increasing healthcare spending, improving healthcare infrastructure, and rising awareness of coagulation disorders.
Fully Automated Coagulometer Market Product Innovations
Recent innovations in fully automated coagulometers focus on enhancing speed, accuracy, and ease of use. Miniaturization, improved connectivity for data management, and integration with laboratory information systems (LIS) are key technological advancements driving market growth. Manufacturers are focusing on developing POC devices to address the demand for rapid diagnostic testing outside centralized laboratories. This enables faster diagnosis and improved patient care.
Report Segmentation & Scope
This report segments the Fully Automated Coagulometer market by product type (Coagulation Systems, Consumables, Accessories) and end-user (Hospitals, Diagnostic Laboratories, Other End Users).
- Coagulation Systems: This segment is expected to experience significant growth due to increasing demand for advanced, automated testing platforms. The market is characterized by a competitive landscape with several established players.
- Consumables: This segment includes reagents and other consumables essential for running coagulation tests. Growth is linked to the growth in the use of coagulation systems.
- Accessories: This segment involves components like calibrators and controls. Market growth parallels that of the overall coagulometer market.
- Hospitals: This is the dominant end-user segment due to high-volume testing.
- Diagnostic Laboratories: These laboratories rely heavily on automated coagulometers for efficiency and accuracy.
- Other End Users: This includes smaller clinics and other healthcare settings.
Key Drivers of Fully Automated Coagulometer Market Growth
Several key factors drive the growth of the fully automated coagulometer market: increasing prevalence of cardiovascular diseases and related conditions necessitating frequent coagulation testing; advancements in technology leading to faster, more accurate results; improved healthcare infrastructure supporting greater adoption rates; favorable regulatory environments encouraging market expansion; and rising healthcare expenditure globally.
Challenges in the Fully Automated Coagulometer Market Sector
Challenges facing the market include high initial costs associated with automated systems, regulatory hurdles for new product approvals, potential supply chain disruptions impacting consumables availability, and intense competition among established players. These factors can constrain market growth, particularly in resource-limited settings. Furthermore, the need for highly skilled personnel to operate and maintain these systems presents an operational challenge.
Leading Players in the Fully Automated Coagulometer Market Market
- Diagon
- Siemens Healthcare
- F Hoffmann-La Roche Ltd
- Maccura Biotechnology Co Ltd
- iLine Microsystems SL
- Horiba
- HemoSonics LLC
- Erba Group
- Haemonetics Corporation
- Werfen
Key Developments in Fully Automated Coagulometer Market Sector
- May 2021: Perosphere Technologies Inc. announced the CE-IVD Marking of its Point-of-Care (POC) Coagulometer System, expanding market access in Europe. This significantly impacts market dynamics by introducing a more accessible testing solution.
- October 2021: Grifols' divestment of its hemostasis business for USD 25.0 Million signals market consolidation and potential shifts in competitive landscape. This represents a significant strategic move impacting the market share of involved players.
Strategic Fully Automated Coagulometer Market Market Outlook
The Fully Automated Coagulometer market presents significant growth opportunities driven by technological advancements, increasing healthcare investments, and unmet needs in point-of-care diagnostics. Strategic partnerships, focus on developing cost-effective solutions, and expansion into emerging markets represent key avenues for future success. The market is expected to witness the emergence of innovative solutions offering improved efficiency and integration with broader healthcare systems.
Fully Automated Coagulometer Market Segmentation
-
1. Product Type
- 1.1. Coagulation System
- 1.2. Consumables
- 1.3. Accessories
-
2. End User
- 2.1. Hospitals
- 2.2. Diagnostic Laboratories
- 2.3. Other End Users
Fully Automated Coagulometer Market Segmentation By Geography
-
1. North America
- 1.1. United States
- 1.2. Canada
- 1.3. Mexico
-
2. Europe
- 2.1. Germany
- 2.2. United Kingdom
- 2.3. France
- 2.4. Italy
- 2.5. Spain
- 2.6. Rest of Europe
-
3. Asia Pacific
- 3.1. China
- 3.2. Japan
- 3.3. India
- 3.4. Australia
- 3.5. South Korea
- 3.6. Rest of Asia Pacific
-
4. Middle East and Africa
- 4.1. GCC
- 4.2. South Africa
- 4.3. Rest of Middle East and Africa
-
5. South America
- 5.1. Brazil
- 5.2. Argentina
- 5.3. Rest of South America
Fully Automated Coagulometer Market REPORT HIGHLIGHTS
| Aspects | Details |
|---|---|
| Study Period | 2019-2033 |
| Base Year | 2024 |
| Estimated Year | 2025 |
| Forecast Period | 2025-2033 |
| Historical Period | 2019-2024 |
| Growth Rate | CAGR of 8.20% from 2019-2033 |
| Segmentation |
|
Table of Contents
- 1. Introduction
- 1.1. Research Scope
- 1.2. Market Segmentation
- 1.3. Research Methodology
- 1.4. Definitions and Assumptions
- 2. Executive Summary
- 2.1. Introduction
- 3. Market Dynamics
- 3.1. Introduction
- 3.2. Market Drivers
- 3.2.1. Growing Burden of Blood Related Diseases; Emerging Trends in Product
- 3.3. Market Restrains
- 3.3.1. High Cost of Test
- 3.4. Market Trends
- 3.4.1. Hospital Segment Expected to Witness Considerable Growth Over the Forecast Period
- 4. Market Factor Analysis
- 4.1. Porters Five Forces
- 4.2. Supply/Value Chain
- 4.3. PESTEL analysis
- 4.4. Market Entropy
- 4.5. Patent/Trademark Analysis
- 5. Global Fully Automated Coagulometer Market Analysis, Insights and Forecast, 2019-2031
- 5.1. Market Analysis, Insights and Forecast - by Product Type
- 5.1.1. Coagulation System
- 5.1.2. Consumables
- 5.1.3. Accessories
- 5.2. Market Analysis, Insights and Forecast - by End User
- 5.2.1. Hospitals
- 5.2.2. Diagnostic Laboratories
- 5.2.3. Other End Users
- 5.3. Market Analysis, Insights and Forecast - by Region
- 5.3.1. North America
- 5.3.2. Europe
- 5.3.3. Asia Pacific
- 5.3.4. Middle East and Africa
- 5.3.5. South America
- 5.1. Market Analysis, Insights and Forecast - by Product Type
- 6. North America Fully Automated Coagulometer Market Analysis, Insights and Forecast, 2019-2031
- 6.1. Market Analysis, Insights and Forecast - by Product Type
- 6.1.1. Coagulation System
- 6.1.2. Consumables
- 6.1.3. Accessories
- 6.2. Market Analysis, Insights and Forecast - by End User
- 6.2.1. Hospitals
- 6.2.2. Diagnostic Laboratories
- 6.2.3. Other End Users
- 6.1. Market Analysis, Insights and Forecast - by Product Type
- 7. Europe Fully Automated Coagulometer Market Analysis, Insights and Forecast, 2019-2031
- 7.1. Market Analysis, Insights and Forecast - by Product Type
- 7.1.1. Coagulation System
- 7.1.2. Consumables
- 7.1.3. Accessories
- 7.2. Market Analysis, Insights and Forecast - by End User
- 7.2.1. Hospitals
- 7.2.2. Diagnostic Laboratories
- 7.2.3. Other End Users
- 7.1. Market Analysis, Insights and Forecast - by Product Type
- 8. Asia Pacific Fully Automated Coagulometer Market Analysis, Insights and Forecast, 2019-2031
- 8.1. Market Analysis, Insights and Forecast - by Product Type
- 8.1.1. Coagulation System
- 8.1.2. Consumables
- 8.1.3. Accessories
- 8.2. Market Analysis, Insights and Forecast - by End User
- 8.2.1. Hospitals
- 8.2.2. Diagnostic Laboratories
- 8.2.3. Other End Users
- 8.1. Market Analysis, Insights and Forecast - by Product Type
- 9. Middle East and Africa Fully Automated Coagulometer Market Analysis, Insights and Forecast, 2019-2031
- 9.1. Market Analysis, Insights and Forecast - by Product Type
- 9.1.1. Coagulation System
- 9.1.2. Consumables
- 9.1.3. Accessories
- 9.2. Market Analysis, Insights and Forecast - by End User
- 9.2.1. Hospitals
- 9.2.2. Diagnostic Laboratories
- 9.2.3. Other End Users
- 9.1. Market Analysis, Insights and Forecast - by Product Type
- 10. South America Fully Automated Coagulometer Market Analysis, Insights and Forecast, 2019-2031
- 10.1. Market Analysis, Insights and Forecast - by Product Type
- 10.1.1. Coagulation System
- 10.1.2. Consumables
- 10.1.3. Accessories
- 10.2. Market Analysis, Insights and Forecast - by End User
- 10.2.1. Hospitals
- 10.2.2. Diagnostic Laboratories
- 10.2.3. Other End Users
- 10.1. Market Analysis, Insights and Forecast - by Product Type
- 11. North America Fully Automated Coagulometer Market Analysis, Insights and Forecast, 2019-2031
- 11.1. Market Analysis, Insights and Forecast - By Country/Sub-region
- 11.1.1. undefined
- 12. Europe Fully Automated Coagulometer Market Analysis, Insights and Forecast, 2019-2031
- 12.1. Market Analysis, Insights and Forecast - By Country/Sub-region
- 12.1.1. undefined
- 13. Asia Pacific Fully Automated Coagulometer Market Analysis, Insights and Forecast, 2019-2031
- 13.1. Market Analysis, Insights and Forecast - By Country/Sub-region
- 13.1.1. undefined
- 14. Middle East and Africa Fully Automated Coagulometer Market Analysis, Insights and Forecast, 2019-2031
- 14.1. Market Analysis, Insights and Forecast - By Country/Sub-region
- 14.1.1. undefined
- 15. South America Fully Automated Coagulometer Market Analysis, Insights and Forecast, 2019-2031
- 15.1. Market Analysis, Insights and Forecast - By Country/Sub-region
- 15.1.1. undefined
- 16. Competitive Analysis
- 16.1. Global Market Share Analysis 2024
- 16.2. Company Profiles
- 16.2.1 Diagon
- 16.2.1.1. Overview
- 16.2.1.2. Products
- 16.2.1.3. SWOT Analysis
- 16.2.1.4. Recent Developments
- 16.2.1.5. Financials (Based on Availability)
- 16.2.2 Siemens Healthcare
- 16.2.2.1. Overview
- 16.2.2.2. Products
- 16.2.2.3. SWOT Analysis
- 16.2.2.4. Recent Developments
- 16.2.2.5. Financials (Based on Availability)
- 16.2.3 F Hoffmann-La Roche Ltd
- 16.2.3.1. Overview
- 16.2.3.2. Products
- 16.2.3.3. SWOT Analysis
- 16.2.3.4. Recent Developments
- 16.2.3.5. Financials (Based on Availability)
- 16.2.4 Maccura Biotechnology Co Ltd
- 16.2.4.1. Overview
- 16.2.4.2. Products
- 16.2.4.3. SWOT Analysis
- 16.2.4.4. Recent Developments
- 16.2.4.5. Financials (Based on Availability)
- 16.2.5 iLine Microsystems SL
- 16.2.5.1. Overview
- 16.2.5.2. Products
- 16.2.5.3. SWOT Analysis
- 16.2.5.4. Recent Developments
- 16.2.5.5. Financials (Based on Availability)
- 16.2.6 Horiba
- 16.2.6.1. Overview
- 16.2.6.2. Products
- 16.2.6.3. SWOT Analysis
- 16.2.6.4. Recent Developments
- 16.2.6.5. Financials (Based on Availability)
- 16.2.7 HemoSonics LLC
- 16.2.7.1. Overview
- 16.2.7.2. Products
- 16.2.7.3. SWOT Analysis
- 16.2.7.4. Recent Developments
- 16.2.7.5. Financials (Based on Availability)
- 16.2.8 Erba Group
- 16.2.8.1. Overview
- 16.2.8.2. Products
- 16.2.8.3. SWOT Analysis
- 16.2.8.4. Recent Developments
- 16.2.8.5. Financials (Based on Availability)
- 16.2.9 Haemonetics Corporation
- 16.2.9.1. Overview
- 16.2.9.2. Products
- 16.2.9.3. SWOT Analysis
- 16.2.9.4. Recent Developments
- 16.2.9.5. Financials (Based on Availability)
- 16.2.10 Werfen
- 16.2.10.1. Overview
- 16.2.10.2. Products
- 16.2.10.3. SWOT Analysis
- 16.2.10.4. Recent Developments
- 16.2.10.5. Financials (Based on Availability)
- 16.2.1 Diagon
List of Figures
- Figure 1: Global Fully Automated Coagulometer Market Revenue Breakdown (Million, %) by Region 2024 & 2032
- Figure 2: Global Fully Automated Coagulometer Market Volume Breakdown (K Unit, %) by Region 2024 & 2032
- Figure 3: North America Fully Automated Coagulometer Market Revenue (Million), by Country 2024 & 2032
- Figure 4: North America Fully Automated Coagulometer Market Volume (K Unit), by Country 2024 & 2032
- Figure 5: North America Fully Automated Coagulometer Market Revenue Share (%), by Country 2024 & 2032
- Figure 6: North America Fully Automated Coagulometer Market Volume Share (%), by Country 2024 & 2032
- Figure 7: Europe Fully Automated Coagulometer Market Revenue (Million), by Country 2024 & 2032
- Figure 8: Europe Fully Automated Coagulometer Market Volume (K Unit), by Country 2024 & 2032
- Figure 9: Europe Fully Automated Coagulometer Market Revenue Share (%), by Country 2024 & 2032
- Figure 10: Europe Fully Automated Coagulometer Market Volume Share (%), by Country 2024 & 2032
- Figure 11: Asia Pacific Fully Automated Coagulometer Market Revenue (Million), by Country 2024 & 2032
- Figure 12: Asia Pacific Fully Automated Coagulometer Market Volume (K Unit), by Country 2024 & 2032
- Figure 13: Asia Pacific Fully Automated Coagulometer Market Revenue Share (%), by Country 2024 & 2032
- Figure 14: Asia Pacific Fully Automated Coagulometer Market Volume Share (%), by Country 2024 & 2032
- Figure 15: Middle East and Africa Fully Automated Coagulometer Market Revenue (Million), by Country 2024 & 2032
- Figure 16: Middle East and Africa Fully Automated Coagulometer Market Volume (K Unit), by Country 2024 & 2032
- Figure 17: Middle East and Africa Fully Automated Coagulometer Market Revenue Share (%), by Country 2024 & 2032
- Figure 18: Middle East and Africa Fully Automated Coagulometer Market Volume Share (%), by Country 2024 & 2032
- Figure 19: South America Fully Automated Coagulometer Market Revenue (Million), by Country 2024 & 2032
- Figure 20: South America Fully Automated Coagulometer Market Volume (K Unit), by Country 2024 & 2032
- Figure 21: South America Fully Automated Coagulometer Market Revenue Share (%), by Country 2024 & 2032
- Figure 22: South America Fully Automated Coagulometer Market Volume Share (%), by Country 2024 & 2032
- Figure 23: North America Fully Automated Coagulometer Market Revenue (Million), by Product Type 2024 & 2032
- Figure 24: North America Fully Automated Coagulometer Market Volume (K Unit), by Product Type 2024 & 2032
- Figure 25: North America Fully Automated Coagulometer Market Revenue Share (%), by Product Type 2024 & 2032
- Figure 26: North America Fully Automated Coagulometer Market Volume Share (%), by Product Type 2024 & 2032
- Figure 27: North America Fully Automated Coagulometer Market Revenue (Million), by End User 2024 & 2032
- Figure 28: North America Fully Automated Coagulometer Market Volume (K Unit), by End User 2024 & 2032
- Figure 29: North America Fully Automated Coagulometer Market Revenue Share (%), by End User 2024 & 2032
- Figure 30: North America Fully Automated Coagulometer Market Volume Share (%), by End User 2024 & 2032
- Figure 31: North America Fully Automated Coagulometer Market Revenue (Million), by Country 2024 & 2032
- Figure 32: North America Fully Automated Coagulometer Market Volume (K Unit), by Country 2024 & 2032
- Figure 33: North America Fully Automated Coagulometer Market Revenue Share (%), by Country 2024 & 2032
- Figure 34: North America Fully Automated Coagulometer Market Volume Share (%), by Country 2024 & 2032
- Figure 35: Europe Fully Automated Coagulometer Market Revenue (Million), by Product Type 2024 & 2032
- Figure 36: Europe Fully Automated Coagulometer Market Volume (K Unit), by Product Type 2024 & 2032
- Figure 37: Europe Fully Automated Coagulometer Market Revenue Share (%), by Product Type 2024 & 2032
- Figure 38: Europe Fully Automated Coagulometer Market Volume Share (%), by Product Type 2024 & 2032
- Figure 39: Europe Fully Automated Coagulometer Market Revenue (Million), by End User 2024 & 2032
- Figure 40: Europe Fully Automated Coagulometer Market Volume (K Unit), by End User 2024 & 2032
- Figure 41: Europe Fully Automated Coagulometer Market Revenue Share (%), by End User 2024 & 2032
- Figure 42: Europe Fully Automated Coagulometer Market Volume Share (%), by End User 2024 & 2032
- Figure 43: Europe Fully Automated Coagulometer Market Revenue (Million), by Country 2024 & 2032
- Figure 44: Europe Fully Automated Coagulometer Market Volume (K Unit), by Country 2024 & 2032
- Figure 45: Europe Fully Automated Coagulometer Market Revenue Share (%), by Country 2024 & 2032
- Figure 46: Europe Fully Automated Coagulometer Market Volume Share (%), by Country 2024 & 2032
- Figure 47: Asia Pacific Fully Automated Coagulometer Market Revenue (Million), by Product Type 2024 & 2032
- Figure 48: Asia Pacific Fully Automated Coagulometer Market Volume (K Unit), by Product Type 2024 & 2032
- Figure 49: Asia Pacific Fully Automated Coagulometer Market Revenue Share (%), by Product Type 2024 & 2032
- Figure 50: Asia Pacific Fully Automated Coagulometer Market Volume Share (%), by Product Type 2024 & 2032
- Figure 51: Asia Pacific Fully Automated Coagulometer Market Revenue (Million), by End User 2024 & 2032
- Figure 52: Asia Pacific Fully Automated Coagulometer Market Volume (K Unit), by End User 2024 & 2032
- Figure 53: Asia Pacific Fully Automated Coagulometer Market Revenue Share (%), by End User 2024 & 2032
- Figure 54: Asia Pacific Fully Automated Coagulometer Market Volume Share (%), by End User 2024 & 2032
- Figure 55: Asia Pacific Fully Automated Coagulometer Market Revenue (Million), by Country 2024 & 2032
- Figure 56: Asia Pacific Fully Automated Coagulometer Market Volume (K Unit), by Country 2024 & 2032
- Figure 57: Asia Pacific Fully Automated Coagulometer Market Revenue Share (%), by Country 2024 & 2032
- Figure 58: Asia Pacific Fully Automated Coagulometer Market Volume Share (%), by Country 2024 & 2032
- Figure 59: Middle East and Africa Fully Automated Coagulometer Market Revenue (Million), by Product Type 2024 & 2032
- Figure 60: Middle East and Africa Fully Automated Coagulometer Market Volume (K Unit), by Product Type 2024 & 2032
- Figure 61: Middle East and Africa Fully Automated Coagulometer Market Revenue Share (%), by Product Type 2024 & 2032
- Figure 62: Middle East and Africa Fully Automated Coagulometer Market Volume Share (%), by Product Type 2024 & 2032
- Figure 63: Middle East and Africa Fully Automated Coagulometer Market Revenue (Million), by End User 2024 & 2032
- Figure 64: Middle East and Africa Fully Automated Coagulometer Market Volume (K Unit), by End User 2024 & 2032
- Figure 65: Middle East and Africa Fully Automated Coagulometer Market Revenue Share (%), by End User 2024 & 2032
- Figure 66: Middle East and Africa Fully Automated Coagulometer Market Volume Share (%), by End User 2024 & 2032
- Figure 67: Middle East and Africa Fully Automated Coagulometer Market Revenue (Million), by Country 2024 & 2032
- Figure 68: Middle East and Africa Fully Automated Coagulometer Market Volume (K Unit), by Country 2024 & 2032
- Figure 69: Middle East and Africa Fully Automated Coagulometer Market Revenue Share (%), by Country 2024 & 2032
- Figure 70: Middle East and Africa Fully Automated Coagulometer Market Volume Share (%), by Country 2024 & 2032
- Figure 71: South America Fully Automated Coagulometer Market Revenue (Million), by Product Type 2024 & 2032
- Figure 72: South America Fully Automated Coagulometer Market Volume (K Unit), by Product Type 2024 & 2032
- Figure 73: South America Fully Automated Coagulometer Market Revenue Share (%), by Product Type 2024 & 2032
- Figure 74: South America Fully Automated Coagulometer Market Volume Share (%), by Product Type 2024 & 2032
- Figure 75: South America Fully Automated Coagulometer Market Revenue (Million), by End User 2024 & 2032
- Figure 76: South America Fully Automated Coagulometer Market Volume (K Unit), by End User 2024 & 2032
- Figure 77: South America Fully Automated Coagulometer Market Revenue Share (%), by End User 2024 & 2032
- Figure 78: South America Fully Automated Coagulometer Market Volume Share (%), by End User 2024 & 2032
- Figure 79: South America Fully Automated Coagulometer Market Revenue (Million), by Country 2024 & 2032
- Figure 80: South America Fully Automated Coagulometer Market Volume (K Unit), by Country 2024 & 2032
- Figure 81: South America Fully Automated Coagulometer Market Revenue Share (%), by Country 2024 & 2032
- Figure 82: South America Fully Automated Coagulometer Market Volume Share (%), by Country 2024 & 2032
List of Tables
- Table 1: Global Fully Automated Coagulometer Market Revenue Million Forecast, by Region 2019 & 2032
- Table 2: Global Fully Automated Coagulometer Market Volume K Unit Forecast, by Region 2019 & 2032
- Table 3: Global Fully Automated Coagulometer Market Revenue Million Forecast, by Product Type 2019 & 2032
- Table 4: Global Fully Automated Coagulometer Market Volume K Unit Forecast, by Product Type 2019 & 2032
- Table 5: Global Fully Automated Coagulometer Market Revenue Million Forecast, by End User 2019 & 2032
- Table 6: Global Fully Automated Coagulometer Market Volume K Unit Forecast, by End User 2019 & 2032
- Table 7: Global Fully Automated Coagulometer Market Revenue Million Forecast, by Region 2019 & 2032
- Table 8: Global Fully Automated Coagulometer Market Volume K Unit Forecast, by Region 2019 & 2032
- Table 9: Global Fully Automated Coagulometer Market Revenue Million Forecast, by Country 2019 & 2032
- Table 10: Global Fully Automated Coagulometer Market Volume K Unit Forecast, by Country 2019 & 2032
- Table 11: Global Fully Automated Coagulometer Market Revenue Million Forecast, by Country 2019 & 2032
- Table 12: Global Fully Automated Coagulometer Market Volume K Unit Forecast, by Country 2019 & 2032
- Table 13: Global Fully Automated Coagulometer Market Revenue Million Forecast, by Country 2019 & 2032
- Table 14: Global Fully Automated Coagulometer Market Volume K Unit Forecast, by Country 2019 & 2032
- Table 15: Global Fully Automated Coagulometer Market Revenue Million Forecast, by Country 2019 & 2032
- Table 16: Global Fully Automated Coagulometer Market Volume K Unit Forecast, by Country 2019 & 2032
- Table 17: Global Fully Automated Coagulometer Market Revenue Million Forecast, by Country 2019 & 2032
- Table 18: Global Fully Automated Coagulometer Market Volume K Unit Forecast, by Country 2019 & 2032
- Table 19: Global Fully Automated Coagulometer Market Revenue Million Forecast, by Product Type 2019 & 2032
- Table 20: Global Fully Automated Coagulometer Market Volume K Unit Forecast, by Product Type 2019 & 2032
- Table 21: Global Fully Automated Coagulometer Market Revenue Million Forecast, by End User 2019 & 2032
- Table 22: Global Fully Automated Coagulometer Market Volume K Unit Forecast, by End User 2019 & 2032
- Table 23: Global Fully Automated Coagulometer Market Revenue Million Forecast, by Country 2019 & 2032
- Table 24: Global Fully Automated Coagulometer Market Volume K Unit Forecast, by Country 2019 & 2032
- Table 25: United States Fully Automated Coagulometer Market Revenue (Million) Forecast, by Application 2019 & 2032
- Table 26: United States Fully Automated Coagulometer Market Volume (K Unit) Forecast, by Application 2019 & 2032
- Table 27: Canada Fully Automated Coagulometer Market Revenue (Million) Forecast, by Application 2019 & 2032
- Table 28: Canada Fully Automated Coagulometer Market Volume (K Unit) Forecast, by Application 2019 & 2032
- Table 29: Mexico Fully Automated Coagulometer Market Revenue (Million) Forecast, by Application 2019 & 2032
- Table 30: Mexico Fully Automated Coagulometer Market Volume (K Unit) Forecast, by Application 2019 & 2032
- Table 31: Global Fully Automated Coagulometer Market Revenue Million Forecast, by Product Type 2019 & 2032
- Table 32: Global Fully Automated Coagulometer Market Volume K Unit Forecast, by Product Type 2019 & 2032
- Table 33: Global Fully Automated Coagulometer Market Revenue Million Forecast, by End User 2019 & 2032
- Table 34: Global Fully Automated Coagulometer Market Volume K Unit Forecast, by End User 2019 & 2032
- Table 35: Global Fully Automated Coagulometer Market Revenue Million Forecast, by Country 2019 & 2032
- Table 36: Global Fully Automated Coagulometer Market Volume K Unit Forecast, by Country 2019 & 2032
- Table 37: Germany Fully Automated Coagulometer Market Revenue (Million) Forecast, by Application 2019 & 2032
- Table 38: Germany Fully Automated Coagulometer Market Volume (K Unit) Forecast, by Application 2019 & 2032
- Table 39: United Kingdom Fully Automated Coagulometer Market Revenue (Million) Forecast, by Application 2019 & 2032
- Table 40: United Kingdom Fully Automated Coagulometer Market Volume (K Unit) Forecast, by Application 2019 & 2032
- Table 41: France Fully Automated Coagulometer Market Revenue (Million) Forecast, by Application 2019 & 2032
- Table 42: France Fully Automated Coagulometer Market Volume (K Unit) Forecast, by Application 2019 & 2032
- Table 43: Italy Fully Automated Coagulometer Market Revenue (Million) Forecast, by Application 2019 & 2032
- Table 44: Italy Fully Automated Coagulometer Market Volume (K Unit) Forecast, by Application 2019 & 2032
- Table 45: Spain Fully Automated Coagulometer Market Revenue (Million) Forecast, by Application 2019 & 2032
- Table 46: Spain Fully Automated Coagulometer Market Volume (K Unit) Forecast, by Application 2019 & 2032
- Table 47: Rest of Europe Fully Automated Coagulometer Market Revenue (Million) Forecast, by Application 2019 & 2032
- Table 48: Rest of Europe Fully Automated Coagulometer Market Volume (K Unit) Forecast, by Application 2019 & 2032
- Table 49: Global Fully Automated Coagulometer Market Revenue Million Forecast, by Product Type 2019 & 2032
- Table 50: Global Fully Automated Coagulometer Market Volume K Unit Forecast, by Product Type 2019 & 2032
- Table 51: Global Fully Automated Coagulometer Market Revenue Million Forecast, by End User 2019 & 2032
- Table 52: Global Fully Automated Coagulometer Market Volume K Unit Forecast, by End User 2019 & 2032
- Table 53: Global Fully Automated Coagulometer Market Revenue Million Forecast, by Country 2019 & 2032
- Table 54: Global Fully Automated Coagulometer Market Volume K Unit Forecast, by Country 2019 & 2032
- Table 55: China Fully Automated Coagulometer Market Revenue (Million) Forecast, by Application 2019 & 2032
- Table 56: China Fully Automated Coagulometer Market Volume (K Unit) Forecast, by Application 2019 & 2032
- Table 57: Japan Fully Automated Coagulometer Market Revenue (Million) Forecast, by Application 2019 & 2032
- Table 58: Japan Fully Automated Coagulometer Market Volume (K Unit) Forecast, by Application 2019 & 2032
- Table 59: India Fully Automated Coagulometer Market Revenue (Million) Forecast, by Application 2019 & 2032
- Table 60: India Fully Automated Coagulometer Market Volume (K Unit) Forecast, by Application 2019 & 2032
- Table 61: Australia Fully Automated Coagulometer Market Revenue (Million) Forecast, by Application 2019 & 2032
- Table 62: Australia Fully Automated Coagulometer Market Volume (K Unit) Forecast, by Application 2019 & 2032
- Table 63: South Korea Fully Automated Coagulometer Market Revenue (Million) Forecast, by Application 2019 & 2032
- Table 64: South Korea Fully Automated Coagulometer Market Volume (K Unit) Forecast, by Application 2019 & 2032
- Table 65: Rest of Asia Pacific Fully Automated Coagulometer Market Revenue (Million) Forecast, by Application 2019 & 2032
- Table 66: Rest of Asia Pacific Fully Automated Coagulometer Market Volume (K Unit) Forecast, by Application 2019 & 2032
- Table 67: Global Fully Automated Coagulometer Market Revenue Million Forecast, by Product Type 2019 & 2032
- Table 68: Global Fully Automated Coagulometer Market Volume K Unit Forecast, by Product Type 2019 & 2032
- Table 69: Global Fully Automated Coagulometer Market Revenue Million Forecast, by End User 2019 & 2032
- Table 70: Global Fully Automated Coagulometer Market Volume K Unit Forecast, by End User 2019 & 2032
- Table 71: Global Fully Automated Coagulometer Market Revenue Million Forecast, by Country 2019 & 2032
- Table 72: Global Fully Automated Coagulometer Market Volume K Unit Forecast, by Country 2019 & 2032
- Table 73: GCC Fully Automated Coagulometer Market Revenue (Million) Forecast, by Application 2019 & 2032
- Table 74: GCC Fully Automated Coagulometer Market Volume (K Unit) Forecast, by Application 2019 & 2032
- Table 75: South Africa Fully Automated Coagulometer Market Revenue (Million) Forecast, by Application 2019 & 2032
- Table 76: South Africa Fully Automated Coagulometer Market Volume (K Unit) Forecast, by Application 2019 & 2032
- Table 77: Rest of Middle East and Africa Fully Automated Coagulometer Market Revenue (Million) Forecast, by Application 2019 & 2032
- Table 78: Rest of Middle East and Africa Fully Automated Coagulometer Market Volume (K Unit) Forecast, by Application 2019 & 2032
- Table 79: Global Fully Automated Coagulometer Market Revenue Million Forecast, by Product Type 2019 & 2032
- Table 80: Global Fully Automated Coagulometer Market Volume K Unit Forecast, by Product Type 2019 & 2032
- Table 81: Global Fully Automated Coagulometer Market Revenue Million Forecast, by End User 2019 & 2032
- Table 82: Global Fully Automated Coagulometer Market Volume K Unit Forecast, by End User 2019 & 2032
- Table 83: Global Fully Automated Coagulometer Market Revenue Million Forecast, by Country 2019 & 2032
- Table 84: Global Fully Automated Coagulometer Market Volume K Unit Forecast, by Country 2019 & 2032
- Table 85: Brazil Fully Automated Coagulometer Market Revenue (Million) Forecast, by Application 2019 & 2032
- Table 86: Brazil Fully Automated Coagulometer Market Volume (K Unit) Forecast, by Application 2019 & 2032
- Table 87: Argentina Fully Automated Coagulometer Market Revenue (Million) Forecast, by Application 2019 & 2032
- Table 88: Argentina Fully Automated Coagulometer Market Volume (K Unit) Forecast, by Application 2019 & 2032
- Table 89: Rest of South America Fully Automated Coagulometer Market Revenue (Million) Forecast, by Application 2019 & 2032
- Table 90: Rest of South America Fully Automated Coagulometer Market Volume (K Unit) Forecast, by Application 2019 & 2032
Frequently Asked Questions
1. What is the projected Compound Annual Growth Rate (CAGR) of the Fully Automated Coagulometer Market?
The projected CAGR is approximately 8.20%.
2. Which companies are prominent players in the Fully Automated Coagulometer Market?
Key companies in the market include Diagon, Siemens Healthcare, F Hoffmann-La Roche Ltd, Maccura Biotechnology Co Ltd, iLine Microsystems SL, Horiba, HemoSonics LLC, Erba Group, Haemonetics Corporation, Werfen.
3. What are the main segments of the Fully Automated Coagulometer Market?
The market segments include Product Type, End User.
4. Can you provide details about the market size?
The market size is estimated to be USD XX Million as of 2022.
5. What are some drivers contributing to market growth?
Growing Burden of Blood Related Diseases; Emerging Trends in Product.
6. What are the notable trends driving market growth?
Hospital Segment Expected to Witness Considerable Growth Over the Forecast Period.
7. Are there any restraints impacting market growth?
High Cost of Test.
8. Can you provide examples of recent developments in the market?
October 2021: Grifols agreed to sell its hemostasis business for approximately USD 25.0 million in cash as part of its previously announced divestment process of non-strategic assets.
9. What pricing options are available for accessing the report?
Pricing options include single-user, multi-user, and enterprise licenses priced at USD 4750, USD 5250, and USD 8750 respectively.
10. Is the market size provided in terms of value or volume?
The market size is provided in terms of value, measured in Million and volume, measured in K Unit.
11. Are there any specific market keywords associated with the report?
Yes, the market keyword associated with the report is "Fully Automated Coagulometer Market," which aids in identifying and referencing the specific market segment covered.
12. How do I determine which pricing option suits my needs best?
The pricing options vary based on user requirements and access needs. Individual users may opt for single-user licenses, while businesses requiring broader access may choose multi-user or enterprise licenses for cost-effective access to the report.
13. Are there any additional resources or data provided in the Fully Automated Coagulometer Market report?
While the report offers comprehensive insights, it's advisable to review the specific contents or supplementary materials provided to ascertain if additional resources or data are available.
14. How can I stay updated on further developments or reports in the Fully Automated Coagulometer Market?
To stay informed about further developments, trends, and reports in the Fully Automated Coagulometer Market, consider subscribing to industry newsletters, following relevant companies and organizations, or regularly checking reputable industry news sources and publications.
Methodology
Step 1 - Identification of Relevant Samples Size from Population Database


Step 2 - Approaches for Defining Global Market Size (Value, Volume* & Price*)

Note*: In applicable scenarios
Step 3 - Data Sources
Primary Research
- Web Analytics
- Survey Reports
- Research Institute
- Latest Research Reports
- Opinion Leaders
Secondary Research
- Annual Reports
- White Paper
- Latest Press Release
- Industry Association
- Paid Database
- Investor Presentations

Step 4 - Data Triangulation
Involves using different sources of information in order to increase the validity of a study
These sources are likely to be stakeholders in a program - participants, other researchers, program staff, other community members, and so on.
Then we put all data in single framework & apply various statistical tools to find out the dynamic on the market.
During the analysis stage, feedback from the stakeholder groups would be compared to determine areas of agreement as well as areas of divergence


