
Key Insights
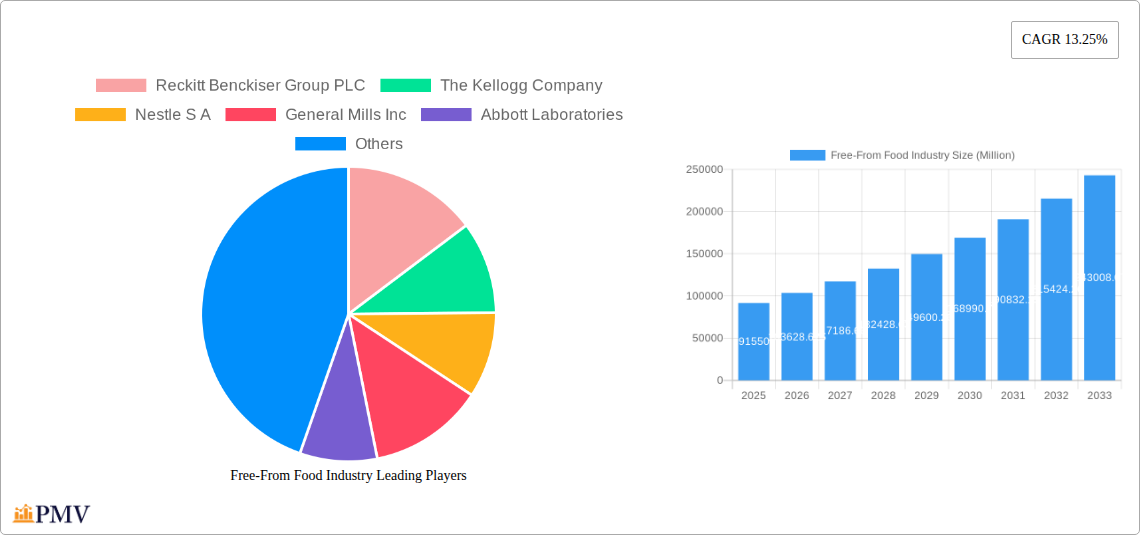
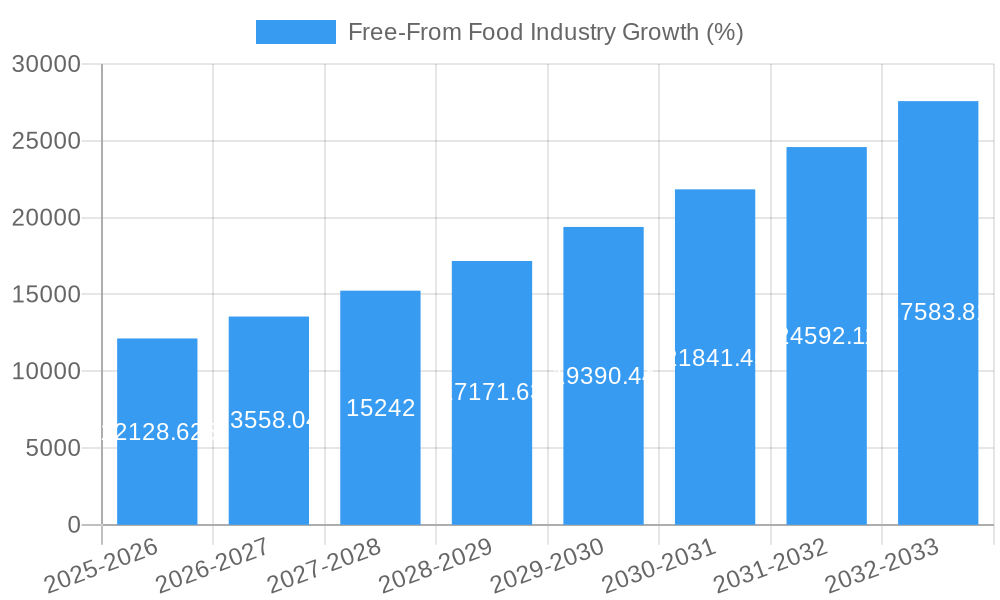
The free-from food market, valued at $91.55 billion in 2025, is experiencing robust growth, projected to expand at a compound annual growth rate (CAGR) of 13.25% from 2025 to 2033. This surge is driven by several key factors. Increasing prevalence of food allergies and intolerances, coupled with rising consumer awareness of health and wellness, fuels demand for products free from gluten, dairy, and meat. The growing popularity of vegan and vegetarian diets further contributes to market expansion. This trend is evident across various segments, including baby food, dairy-free alternatives like plant-based milks and yogurts, meat substitutes such as tofu and plant-based burgers, and free-from beverages. Supermarkets and hypermarkets remain the dominant distribution channel, although online retail is witnessing significant growth, driven by convenience and increased accessibility. The market is segmented by end product (baby food, dairy-free foods, meat substitutes, beverages, other), distribution channel (supermarkets, online retail, convenience stores, other), and type (gluten-free, dairy-free, meat-free, other). Major players like Reckitt Benckiser, Kellogg's, Nestlé, and Beyond Meat are strategically positioning themselves to capitalize on this expanding market. Geographical distribution shows strong performance across North America and Europe, with Asia Pacific also emerging as a significant growth region due to increasing disposable incomes and changing dietary preferences.
Continued expansion is anticipated due to ongoing product innovation, with manufacturers focusing on improving taste, texture, and nutritional value of free-from products to enhance consumer acceptance. However, challenges remain, including the higher production costs of free-from ingredients which can lead to premium pricing, potentially limiting accessibility for some consumers. Furthermore, maintaining consistent supply chains and ensuring product quality are vital for sustained market growth. The future success of companies in this sector hinges on their ability to innovate, meet consumer demands for diverse and appealing products, and effectively manage cost structures to ensure wider market penetration. The free-from food market presents a significant opportunity for established players and new entrants alike, but navigating the unique challenges and adapting to evolving consumer preferences will be crucial for long-term success.
Free-From Food Industry Market Report: 2019-2033
This comprehensive report provides a detailed analysis of the Free-From Food Industry, covering market size, segmentation, growth drivers, challenges, and competitive landscape. The study period spans from 2019 to 2033, with 2025 serving as the base and estimated year. The forecast period is 2025-2033, and the historical period is 2019-2024. The report incorporates data from key players such as Reckitt Benckiser Group PLC, The Kellogg Company, Nestlé S.A., General Mills Inc., Abbott Laboratories, Dr. Schar AG / SPA, Danone SA, Blue Diamond Growers, Beyond Meat, and Oatly Group AB, among others. The market is valued at xx Million in the estimated year 2025 and is projected to reach xx Million by 2033.
Free-From Food Industry Market Structure & Competitive Dynamics
The free-from food market is characterized by a dynamic competitive landscape with a mix of large multinational corporations and smaller specialized players. Market concentration is moderate, with a few key players holding significant market share, but a large number of smaller companies competing in niche segments. The industry exhibits a strong innovation ecosystem, driven by consumer demand for healthier and more diverse food choices. Regulatory frameworks, varying by region, significantly impact product development and market access. Product substitutes, such as conventional foods, compete for market share, necessitating continuous innovation and differentiation strategies. Consumer trends, such as increasing awareness of allergies and intolerances, along with the growing adoption of plant-based diets, are major drivers of market growth. M&A activities have been relatively frequent, with larger companies acquiring smaller, specialized players to expand their product portfolios and market reach. For example, recent M&A deals in the sector have involved (xx Million total value estimated):
- Acquisition of smaller organic food companies by larger players.
- Strategic partnerships for distribution and product development.
Market share data for leading players will vary depending on segment. Analysis within the report details this.
Free-From Food Industry Industry Trends & Insights
The free-from food industry is experiencing robust growth, fueled by several key trends. The Compound Annual Growth Rate (CAGR) for the forecast period (2025-2033) is estimated at xx%, driven by rising consumer awareness of food allergies and intolerances, increasing health consciousness, and the growing popularity of plant-based diets. Technological advancements in food processing and ingredient development are enabling the creation of innovative products that closely mimic the taste and texture of conventional foods. Market penetration of free-from products is increasing significantly across various regions, with particularly strong growth observed in developed markets. The shift in consumer preferences towards healthier and more sustainable food options is a major driver. Competitive dynamics involve price wars and heavy reliance on marketing and branding. Consumer preference shifts towards products addressing multiple free-from needs simultaneously are apparent. This includes the rise in demand for "multi-free" products that cater to several dietary restrictions at once (e.g., gluten-free, dairy-free, and soy-free options). The industry is also facing challenges related to ingredient sourcing, pricing pressures, and maintaining product quality and consistency.
Dominant Markets & Segments in Free-From Food Industry
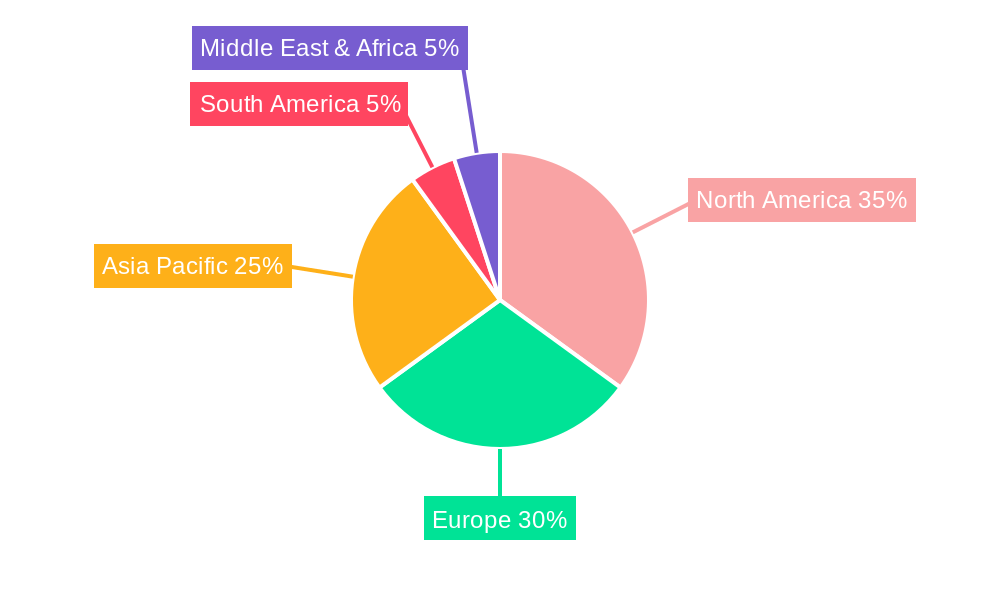
The North American market currently holds a dominant position in the global free-from food industry, driven by high consumer awareness and purchasing power, followed by Europe and Asia-Pacific. Within the segment breakdown:
End Product: Dairy-free foods represent the largest segment, driven by the rising popularity of plant-based milks and yogurt alternatives. Meat substitutes are experiencing rapid growth, while baby food is a steadily expanding segment.
Distribution Channel: Supermarkets/hypermarkets remain the dominant distribution channel, although online retail stores are witnessing substantial growth, boosted by increased e-commerce penetration.
Type: Gluten-free and dairy-free products currently hold the largest market share, yet other free-from options, are gaining traction.
- Key Drivers: Increased disposable income in developed countries, improved healthcare infrastructure, evolving dietary habits, and stringent government regulations for food labeling and safety are leading factors. In developing economies, increased awareness and rising disposable incomes will drive significant future growth. Government initiatives to support the free-from food industry (e.g., subsidies, tax breaks) will also impact market dominance in specific regions.
Free-From Food Industry Product Innovations
Recent product innovations focus on improving taste, texture, and nutritional value of free-from foods. Companies are utilizing advanced technologies like 3D printing and precision fermentation to create novel products that better mimic conventional foods. The market is seeing increased offerings of multi-free products, addressing several dietary restrictions simultaneously. This trend represents a key competitive advantage, creating wider consumer appeal. Products with improved shelf life and reduced processing costs are also vital to market success.
Report Segmentation & Scope
This report segments the free-from food market by End Product (Baby Food, Dairy-free Foods, Meat Substitutes, Beverages, Other End Products), Distribution Channel (Supermarkets/Hypermarkets, Online Retail Stores, Convenience Stores, Other Distribution Channels), and Type (Gluten-free, Dairy-Free, Meat-Free, Other Types). Each segment is analyzed in detail, including growth projections, market size, and competitive dynamics. Market sizes for each segment are provided for the base year, estimated year, and forecast period, together with detailed competitive analysis, showing the key players and their market share.
Key Drivers of Free-From Food Industry Growth
Several factors are driving the growth of the free-from food industry. Technological advancements in food processing and ingredient development are enabling the creation of better-tasting and more nutritious products. Rising consumer awareness of allergies and intolerances, coupled with increased health consciousness, is another major driver. Furthermore, supportive government regulations and policies, such as stricter labeling requirements and incentives for innovation, are fostering market expansion. The rising popularity of plant-based diets globally provides significant momentum.
Challenges in the Free-From Food Industry Sector
The free-from food industry faces several challenges, including high ingredient costs, stringent regulatory hurdles, and maintaining consistent product quality and supply chain complexities. Competition from conventional food products and the need for continuous innovation to meet evolving consumer preferences pose significant challenges. Supply chain disruptions and price fluctuations of key raw materials impact profitability and product availability. Meeting the needs of increasingly demanding consumers with diverse and often niche requirements also presents a significant hurdle.
Leading Players in the Free-From Food Industry Market
- Reckitt Benckiser Group PLC
- The Kellogg Company
- Nestle S.A.
- General Mills Inc.
- Abbott Laboratories
- Dr. Schar AG / SPA
- Danone SA
- Blue Diamond Growers
- Beyond Meat
- Oatly Group AB
- List Not Exhaustive
Key Developments in Free-From Food Industry Sector
November 2022: Beyond Meat launched plant-based chicken products, including Beyond Chicken Nuggets and Beyond Popcorn Chicken, expanding its product portfolio and competing directly with traditional poultry companies. This launch significantly increased market competition and expanded consumer choices within the meat substitute segment.
May 2022: Danone expanded its Canadian dairy-free portfolio with Silk Nextmilk, strengthening its presence in the rapidly growing dairy-free market and furthering its strategy in the Canadian market. This underscores the ongoing trend towards plant-based alternatives and the competitiveness within the dairy-free beverage segment.
January 2022: Mondelez International launched a Philadelphia vegan cream cheese alternative, demonstrating the growth of plant-based options within established food categories and expanding the reach of dairy-free products into a traditional market. This underlines the increasing consumer demand for plant-based alternatives in even established food categories.
Strategic Free-From Food Industry Market Outlook
The free-from food industry is poised for continued strong growth, driven by several factors including the rise of plant-based diets, growing health consciousness, and increased awareness of allergies and intolerances. Strategic opportunities exist for companies to develop innovative products that cater to niche market segments, leverage technological advancements in food processing, and establish efficient supply chains. Expanding into new geographic markets with high growth potential, like developing economies, presents attractive prospects. Focus on sustainability and ethical sourcing will be important for securing market share.
Free-From Food Industry Segmentation
-
1. Type
- 1.1. Gluten-free
- 1.2. Dairy-Free
- 1.3. Meat-Free
- 1.4. Other Types
-
2. End Product
- 2.1. Baby Food
- 2.2. Dairy-free Foods
- 2.3. Meat Substitutes
- 2.4. Beverages
- 2.5. Other End Products
-
3. Distribution Channel
- 3.1. Supermarkets/Hypermarkets
- 3.2. Online Retail Stores
- 3.3. Convenience Stores
- 3.4. Other Distribution Channels
Free-From Food Industry Segmentation By Geography
-
1. North America
- 1.1. United States
- 1.2. Canada
- 1.3. Mexico
- 1.4. Rest of North America
-
2. Europe
- 2.1. United Kingdom
- 2.2. France
- 2.3. Germany
- 2.4. Italy
- 2.5. Spain
- 2.6. Russia
- 2.7. Rest of Europe
-
3. Asia Pacific
- 3.1. China
- 3.2. Japan
- 3.3. Australia
- 3.4. India
- 3.5. Rest of Asia Pacific
-
4. South America
- 4.1. Brazil
- 4.2. Argentina
- 4.3. Rest of South America
- 5. Middle East
-
6. United Arab Emirates
- 6.1. South Africa
- 6.2. Rest of Middle East
Free-From Food Industry REPORT HIGHLIGHTS
| Aspects | Details |
|---|---|
| Study Period | 2019-2033 |
| Base Year | 2024 |
| Estimated Year | 2025 |
| Forecast Period | 2025-2033 |
| Historical Period | 2019-2024 |
| Growth Rate | CAGR of 13.25% from 2019-2033 |
| Segmentation |
|
Table of Contents
- 1. Introduction
- 1.1. Research Scope
- 1.2. Market Segmentation
- 1.3. Research Methodology
- 1.4. Definitions and Assumptions
- 2. Executive Summary
- 2.1. Introduction
- 3. Market Dynamics
- 3.1. Introduction
- 3.2. Market Drivers
- 3.2.1. Increasing Health Concerns are Supporting the Market's Growth; Growing Consumer Preference for Convenience Seafood
- 3.3. Market Restrains
- 3.3.1. Rising Concern About Quality and Safety Standards of Canned Tuna
- 3.4. Market Trends
- 3.4.1. Clean Label Product Development and Associated Labeling Compliance
- 4. Market Factor Analysis
- 4.1. Porters Five Forces
- 4.2. Supply/Value Chain
- 4.3. PESTEL analysis
- 4.4. Market Entropy
- 4.5. Patent/Trademark Analysis
- 5. Global Free-From Food Industry Analysis, Insights and Forecast, 2019-2031
- 5.1. Market Analysis, Insights and Forecast - by Type
- 5.1.1. Gluten-free
- 5.1.2. Dairy-Free
- 5.1.3. Meat-Free
- 5.1.4. Other Types
- 5.2. Market Analysis, Insights and Forecast - by End Product
- 5.2.1. Baby Food
- 5.2.2. Dairy-free Foods
- 5.2.3. Meat Substitutes
- 5.2.4. Beverages
- 5.2.5. Other End Products
- 5.3. Market Analysis, Insights and Forecast - by Distribution Channel
- 5.3.1. Supermarkets/Hypermarkets
- 5.3.2. Online Retail Stores
- 5.3.3. Convenience Stores
- 5.3.4. Other Distribution Channels
- 5.4. Market Analysis, Insights and Forecast - by Region
- 5.4.1. North America
- 5.4.2. Europe
- 5.4.3. Asia Pacific
- 5.4.4. South America
- 5.4.5. Middle East
- 5.4.6. United Arab Emirates
- 5.1. Market Analysis, Insights and Forecast - by Type
- 6. North America Free-From Food Industry Analysis, Insights and Forecast, 2019-2031
- 6.1. Market Analysis, Insights and Forecast - by Type
- 6.1.1. Gluten-free
- 6.1.2. Dairy-Free
- 6.1.3. Meat-Free
- 6.1.4. Other Types
- 6.2. Market Analysis, Insights and Forecast - by End Product
- 6.2.1. Baby Food
- 6.2.2. Dairy-free Foods
- 6.2.3. Meat Substitutes
- 6.2.4. Beverages
- 6.2.5. Other End Products
- 6.3. Market Analysis, Insights and Forecast - by Distribution Channel
- 6.3.1. Supermarkets/Hypermarkets
- 6.3.2. Online Retail Stores
- 6.3.3. Convenience Stores
- 6.3.4. Other Distribution Channels
- 6.1. Market Analysis, Insights and Forecast - by Type
- 7. Europe Free-From Food Industry Analysis, Insights and Forecast, 2019-2031
- 7.1. Market Analysis, Insights and Forecast - by Type
- 7.1.1. Gluten-free
- 7.1.2. Dairy-Free
- 7.1.3. Meat-Free
- 7.1.4. Other Types
- 7.2. Market Analysis, Insights and Forecast - by End Product
- 7.2.1. Baby Food
- 7.2.2. Dairy-free Foods
- 7.2.3. Meat Substitutes
- 7.2.4. Beverages
- 7.2.5. Other End Products
- 7.3. Market Analysis, Insights and Forecast - by Distribution Channel
- 7.3.1. Supermarkets/Hypermarkets
- 7.3.2. Online Retail Stores
- 7.3.3. Convenience Stores
- 7.3.4. Other Distribution Channels
- 7.1. Market Analysis, Insights and Forecast - by Type
- 8. Asia Pacific Free-From Food Industry Analysis, Insights and Forecast, 2019-2031
- 8.1. Market Analysis, Insights and Forecast - by Type
- 8.1.1. Gluten-free
- 8.1.2. Dairy-Free
- 8.1.3. Meat-Free
- 8.1.4. Other Types
- 8.2. Market Analysis, Insights and Forecast - by End Product
- 8.2.1. Baby Food
- 8.2.2. Dairy-free Foods
- 8.2.3. Meat Substitutes
- 8.2.4. Beverages
- 8.2.5. Other End Products
- 8.3. Market Analysis, Insights and Forecast - by Distribution Channel
- 8.3.1. Supermarkets/Hypermarkets
- 8.3.2. Online Retail Stores
- 8.3.3. Convenience Stores
- 8.3.4. Other Distribution Channels
- 8.1. Market Analysis, Insights and Forecast - by Type
- 9. South America Free-From Food Industry Analysis, Insights and Forecast, 2019-2031
- 9.1. Market Analysis, Insights and Forecast - by Type
- 9.1.1. Gluten-free
- 9.1.2. Dairy-Free
- 9.1.3. Meat-Free
- 9.1.4. Other Types
- 9.2. Market Analysis, Insights and Forecast - by End Product
- 9.2.1. Baby Food
- 9.2.2. Dairy-free Foods
- 9.2.3. Meat Substitutes
- 9.2.4. Beverages
- 9.2.5. Other End Products
- 9.3. Market Analysis, Insights and Forecast - by Distribution Channel
- 9.3.1. Supermarkets/Hypermarkets
- 9.3.2. Online Retail Stores
- 9.3.3. Convenience Stores
- 9.3.4. Other Distribution Channels
- 9.1. Market Analysis, Insights and Forecast - by Type
- 10. Middle East Free-From Food Industry Analysis, Insights and Forecast, 2019-2031
- 10.1. Market Analysis, Insights and Forecast - by Type
- 10.1.1. Gluten-free
- 10.1.2. Dairy-Free
- 10.1.3. Meat-Free
- 10.1.4. Other Types
- 10.2. Market Analysis, Insights and Forecast - by End Product
- 10.2.1. Baby Food
- 10.2.2. Dairy-free Foods
- 10.2.3. Meat Substitutes
- 10.2.4. Beverages
- 10.2.5. Other End Products
- 10.3. Market Analysis, Insights and Forecast - by Distribution Channel
- 10.3.1. Supermarkets/Hypermarkets
- 10.3.2. Online Retail Stores
- 10.3.3. Convenience Stores
- 10.3.4. Other Distribution Channels
- 10.1. Market Analysis, Insights and Forecast - by Type
- 11. United Arab Emirates Free-From Food Industry Analysis, Insights and Forecast, 2019-2031
- 11.1. Market Analysis, Insights and Forecast - by Type
- 11.1.1. Gluten-free
- 11.1.2. Dairy-Free
- 11.1.3. Meat-Free
- 11.1.4. Other Types
- 11.2. Market Analysis, Insights and Forecast - by End Product
- 11.2.1. Baby Food
- 11.2.2. Dairy-free Foods
- 11.2.3. Meat Substitutes
- 11.2.4. Beverages
- 11.2.5. Other End Products
- 11.3. Market Analysis, Insights and Forecast - by Distribution Channel
- 11.3.1. Supermarkets/Hypermarkets
- 11.3.2. Online Retail Stores
- 11.3.3. Convenience Stores
- 11.3.4. Other Distribution Channels
- 11.1. Market Analysis, Insights and Forecast - by Type
- 12. North America Free-From Food Industry Analysis, Insights and Forecast, 2019-2031
- 12.1. Market Analysis, Insights and Forecast - By Country/Sub-region
- 12.1.1 United States
- 12.1.2 Canada
- 12.1.3 Mexico
- 12.1.4 Rest of North America
- 13. Europe Free-From Food Industry Analysis, Insights and Forecast, 2019-2031
- 13.1. Market Analysis, Insights and Forecast - By Country/Sub-region
- 13.1.1 United Kingdom
- 13.1.2 France
- 13.1.3 Germany
- 13.1.4 Italy
- 13.1.5 Spain
- 13.1.6 Russia
- 13.1.7 Rest of Europe
- 14. Asia Pacific Free-From Food Industry Analysis, Insights and Forecast, 2019-2031
- 14.1. Market Analysis, Insights and Forecast - By Country/Sub-region
- 14.1.1 China
- 14.1.2 Japan
- 14.1.3 Australia
- 14.1.4 India
- 14.1.5 Rest of Asia Pacific
- 15. South America Free-From Food Industry Analysis, Insights and Forecast, 2019-2031
- 15.1. Market Analysis, Insights and Forecast - By Country/Sub-region
- 15.1.1 Brazil
- 15.1.2 Argentina
- 15.1.3 Rest of South America
- 16. Middle East Free-From Food Industry Analysis, Insights and Forecast, 2019-2031
- 16.1. Market Analysis, Insights and Forecast - By Country/Sub-region
- 16.1.1.
- 17. United Arab Emirates Free-From Food Industry Analysis, Insights and Forecast, 2019-2031
- 17.1. Market Analysis, Insights and Forecast - By Country/Sub-region
- 17.1.1 South Africa
- 17.1.2 Rest of Middle East
- 18. Competitive Analysis
- 18.1. Global Market Share Analysis 2024
- 18.2. Company Profiles
- 18.2.1 Reckitt Benckiser Group PLC
- 18.2.1.1. Overview
- 18.2.1.2. Products
- 18.2.1.3. SWOT Analysis
- 18.2.1.4. Recent Developments
- 18.2.1.5. Financials (Based on Availability)
- 18.2.2 The Kellogg Company
- 18.2.2.1. Overview
- 18.2.2.2. Products
- 18.2.2.3. SWOT Analysis
- 18.2.2.4. Recent Developments
- 18.2.2.5. Financials (Based on Availability)
- 18.2.3 Nestle S A
- 18.2.3.1. Overview
- 18.2.3.2. Products
- 18.2.3.3. SWOT Analysis
- 18.2.3.4. Recent Developments
- 18.2.3.5. Financials (Based on Availability)
- 18.2.4 General Mills Inc
- 18.2.4.1. Overview
- 18.2.4.2. Products
- 18.2.4.3. SWOT Analysis
- 18.2.4.4. Recent Developments
- 18.2.4.5. Financials (Based on Availability)
- 18.2.5 Abbott Laboratories
- 18.2.5.1. Overview
- 18.2.5.2. Products
- 18.2.5.3. SWOT Analysis
- 18.2.5.4. Recent Developments
- 18.2.5.5. Financials (Based on Availability)
- 18.2.6 Dr Schar AG / SPA
- 18.2.6.1. Overview
- 18.2.6.2. Products
- 18.2.6.3. SWOT Analysis
- 18.2.6.4. Recent Developments
- 18.2.6.5. Financials (Based on Availability)
- 18.2.7 Danone SA
- 18.2.7.1. Overview
- 18.2.7.2. Products
- 18.2.7.3. SWOT Analysis
- 18.2.7.4. Recent Developments
- 18.2.7.5. Financials (Based on Availability)
- 18.2.8 Blue Diamond Growers
- 18.2.8.1. Overview
- 18.2.8.2. Products
- 18.2.8.3. SWOT Analysis
- 18.2.8.4. Recent Developments
- 18.2.8.5. Financials (Based on Availability)
- 18.2.9 Beyond Meat
- 18.2.9.1. Overview
- 18.2.9.2. Products
- 18.2.9.3. SWOT Analysis
- 18.2.9.4. Recent Developments
- 18.2.9.5. Financials (Based on Availability)
- 18.2.10 Oatly Group AB*List Not Exhaustive
- 18.2.10.1. Overview
- 18.2.10.2. Products
- 18.2.10.3. SWOT Analysis
- 18.2.10.4. Recent Developments
- 18.2.10.5. Financials (Based on Availability)
- 18.2.1 Reckitt Benckiser Group PLC
List of Figures
- Figure 1: Global Free-From Food Industry Revenue Breakdown (Million, %) by Region 2024 & 2032
- Figure 2: North America Free-From Food Industry Revenue (Million), by Country 2024 & 2032
- Figure 3: North America Free-From Food Industry Revenue Share (%), by Country 2024 & 2032
- Figure 4: Europe Free-From Food Industry Revenue (Million), by Country 2024 & 2032
- Figure 5: Europe Free-From Food Industry Revenue Share (%), by Country 2024 & 2032
- Figure 6: Asia Pacific Free-From Food Industry Revenue (Million), by Country 2024 & 2032
- Figure 7: Asia Pacific Free-From Food Industry Revenue Share (%), by Country 2024 & 2032
- Figure 8: South America Free-From Food Industry Revenue (Million), by Country 2024 & 2032
- Figure 9: South America Free-From Food Industry Revenue Share (%), by Country 2024 & 2032
- Figure 10: Middle East Free-From Food Industry Revenue (Million), by Country 2024 & 2032
- Figure 11: Middle East Free-From Food Industry Revenue Share (%), by Country 2024 & 2032
- Figure 12: United Arab Emirates Free-From Food Industry Revenue (Million), by Country 2024 & 2032
- Figure 13: United Arab Emirates Free-From Food Industry Revenue Share (%), by Country 2024 & 2032
- Figure 14: North America Free-From Food Industry Revenue (Million), by Type 2024 & 2032
- Figure 15: North America Free-From Food Industry Revenue Share (%), by Type 2024 & 2032
- Figure 16: North America Free-From Food Industry Revenue (Million), by End Product 2024 & 2032
- Figure 17: North America Free-From Food Industry Revenue Share (%), by End Product 2024 & 2032
- Figure 18: North America Free-From Food Industry Revenue (Million), by Distribution Channel 2024 & 2032
- Figure 19: North America Free-From Food Industry Revenue Share (%), by Distribution Channel 2024 & 2032
- Figure 20: North America Free-From Food Industry Revenue (Million), by Country 2024 & 2032
- Figure 21: North America Free-From Food Industry Revenue Share (%), by Country 2024 & 2032
- Figure 22: Europe Free-From Food Industry Revenue (Million), by Type 2024 & 2032
- Figure 23: Europe Free-From Food Industry Revenue Share (%), by Type 2024 & 2032
- Figure 24: Europe Free-From Food Industry Revenue (Million), by End Product 2024 & 2032
- Figure 25: Europe Free-From Food Industry Revenue Share (%), by End Product 2024 & 2032
- Figure 26: Europe Free-From Food Industry Revenue (Million), by Distribution Channel 2024 & 2032
- Figure 27: Europe Free-From Food Industry Revenue Share (%), by Distribution Channel 2024 & 2032
- Figure 28: Europe Free-From Food Industry Revenue (Million), by Country 2024 & 2032
- Figure 29: Europe Free-From Food Industry Revenue Share (%), by Country 2024 & 2032
- Figure 30: Asia Pacific Free-From Food Industry Revenue (Million), by Type 2024 & 2032
- Figure 31: Asia Pacific Free-From Food Industry Revenue Share (%), by Type 2024 & 2032
- Figure 32: Asia Pacific Free-From Food Industry Revenue (Million), by End Product 2024 & 2032
- Figure 33: Asia Pacific Free-From Food Industry Revenue Share (%), by End Product 2024 & 2032
- Figure 34: Asia Pacific Free-From Food Industry Revenue (Million), by Distribution Channel 2024 & 2032
- Figure 35: Asia Pacific Free-From Food Industry Revenue Share (%), by Distribution Channel 2024 & 2032
- Figure 36: Asia Pacific Free-From Food Industry Revenue (Million), by Country 2024 & 2032
- Figure 37: Asia Pacific Free-From Food Industry Revenue Share (%), by Country 2024 & 2032
- Figure 38: South America Free-From Food Industry Revenue (Million), by Type 2024 & 2032
- Figure 39: South America Free-From Food Industry Revenue Share (%), by Type 2024 & 2032
- Figure 40: South America Free-From Food Industry Revenue (Million), by End Product 2024 & 2032
- Figure 41: South America Free-From Food Industry Revenue Share (%), by End Product 2024 & 2032
- Figure 42: South America Free-From Food Industry Revenue (Million), by Distribution Channel 2024 & 2032
- Figure 43: South America Free-From Food Industry Revenue Share (%), by Distribution Channel 2024 & 2032
- Figure 44: South America Free-From Food Industry Revenue (Million), by Country 2024 & 2032
- Figure 45: South America Free-From Food Industry Revenue Share (%), by Country 2024 & 2032
- Figure 46: Middle East Free-From Food Industry Revenue (Million), by Type 2024 & 2032
- Figure 47: Middle East Free-From Food Industry Revenue Share (%), by Type 2024 & 2032
- Figure 48: Middle East Free-From Food Industry Revenue (Million), by End Product 2024 & 2032
- Figure 49: Middle East Free-From Food Industry Revenue Share (%), by End Product 2024 & 2032
- Figure 50: Middle East Free-From Food Industry Revenue (Million), by Distribution Channel 2024 & 2032
- Figure 51: Middle East Free-From Food Industry Revenue Share (%), by Distribution Channel 2024 & 2032
- Figure 52: Middle East Free-From Food Industry Revenue (Million), by Country 2024 & 2032
- Figure 53: Middle East Free-From Food Industry Revenue Share (%), by Country 2024 & 2032
- Figure 54: United Arab Emirates Free-From Food Industry Revenue (Million), by Type 2024 & 2032
- Figure 55: United Arab Emirates Free-From Food Industry Revenue Share (%), by Type 2024 & 2032
- Figure 56: United Arab Emirates Free-From Food Industry Revenue (Million), by End Product 2024 & 2032
- Figure 57: United Arab Emirates Free-From Food Industry Revenue Share (%), by End Product 2024 & 2032
- Figure 58: United Arab Emirates Free-From Food Industry Revenue (Million), by Distribution Channel 2024 & 2032
- Figure 59: United Arab Emirates Free-From Food Industry Revenue Share (%), by Distribution Channel 2024 & 2032
- Figure 60: United Arab Emirates Free-From Food Industry Revenue (Million), by Country 2024 & 2032
- Figure 61: United Arab Emirates Free-From Food Industry Revenue Share (%), by Country 2024 & 2032
List of Tables
- Table 1: Global Free-From Food Industry Revenue Million Forecast, by Region 2019 & 2032
- Table 2: Global Free-From Food Industry Revenue Million Forecast, by Type 2019 & 2032
- Table 3: Global Free-From Food Industry Revenue Million Forecast, by End Product 2019 & 2032
- Table 4: Global Free-From Food Industry Revenue Million Forecast, by Distribution Channel 2019 & 2032
- Table 5: Global Free-From Food Industry Revenue Million Forecast, by Region 2019 & 2032
- Table 6: Global Free-From Food Industry Revenue Million Forecast, by Country 2019 & 2032
- Table 7: United States Free-From Food Industry Revenue (Million) Forecast, by Application 2019 & 2032
- Table 8: Canada Free-From Food Industry Revenue (Million) Forecast, by Application 2019 & 2032
- Table 9: Mexico Free-From Food Industry Revenue (Million) Forecast, by Application 2019 & 2032
- Table 10: Rest of North America Free-From Food Industry Revenue (Million) Forecast, by Application 2019 & 2032
- Table 11: Global Free-From Food Industry Revenue Million Forecast, by Country 2019 & 2032
- Table 12: United Kingdom Free-From Food Industry Revenue (Million) Forecast, by Application 2019 & 2032
- Table 13: France Free-From Food Industry Revenue (Million) Forecast, by Application 2019 & 2032
- Table 14: Germany Free-From Food Industry Revenue (Million) Forecast, by Application 2019 & 2032
- Table 15: Italy Free-From Food Industry Revenue (Million) Forecast, by Application 2019 & 2032
- Table 16: Spain Free-From Food Industry Revenue (Million) Forecast, by Application 2019 & 2032
- Table 17: Russia Free-From Food Industry Revenue (Million) Forecast, by Application 2019 & 2032
- Table 18: Rest of Europe Free-From Food Industry Revenue (Million) Forecast, by Application 2019 & 2032
- Table 19: Global Free-From Food Industry Revenue Million Forecast, by Country 2019 & 2032
- Table 20: China Free-From Food Industry Revenue (Million) Forecast, by Application 2019 & 2032
- Table 21: Japan Free-From Food Industry Revenue (Million) Forecast, by Application 2019 & 2032
- Table 22: Australia Free-From Food Industry Revenue (Million) Forecast, by Application 2019 & 2032
- Table 23: India Free-From Food Industry Revenue (Million) Forecast, by Application 2019 & 2032
- Table 24: Rest of Asia Pacific Free-From Food Industry Revenue (Million) Forecast, by Application 2019 & 2032
- Table 25: Global Free-From Food Industry Revenue Million Forecast, by Country 2019 & 2032
- Table 26: Brazil Free-From Food Industry Revenue (Million) Forecast, by Application 2019 & 2032
- Table 27: Argentina Free-From Food Industry Revenue (Million) Forecast, by Application 2019 & 2032
- Table 28: Rest of South America Free-From Food Industry Revenue (Million) Forecast, by Application 2019 & 2032
- Table 29: Global Free-From Food Industry Revenue Million Forecast, by Country 2019 & 2032
- Table 30: Free-From Food Industry Revenue (Million) Forecast, by Application 2019 & 2032
- Table 31: Global Free-From Food Industry Revenue Million Forecast, by Country 2019 & 2032
- Table 32: South Africa Free-From Food Industry Revenue (Million) Forecast, by Application 2019 & 2032
- Table 33: Rest of Middle East Free-From Food Industry Revenue (Million) Forecast, by Application 2019 & 2032
- Table 34: Global Free-From Food Industry Revenue Million Forecast, by Type 2019 & 2032
- Table 35: Global Free-From Food Industry Revenue Million Forecast, by End Product 2019 & 2032
- Table 36: Global Free-From Food Industry Revenue Million Forecast, by Distribution Channel 2019 & 2032
- Table 37: Global Free-From Food Industry Revenue Million Forecast, by Country 2019 & 2032
- Table 38: United States Free-From Food Industry Revenue (Million) Forecast, by Application 2019 & 2032
- Table 39: Canada Free-From Food Industry Revenue (Million) Forecast, by Application 2019 & 2032
- Table 40: Mexico Free-From Food Industry Revenue (Million) Forecast, by Application 2019 & 2032
- Table 41: Rest of North America Free-From Food Industry Revenue (Million) Forecast, by Application 2019 & 2032
- Table 42: Global Free-From Food Industry Revenue Million Forecast, by Type 2019 & 2032
- Table 43: Global Free-From Food Industry Revenue Million Forecast, by End Product 2019 & 2032
- Table 44: Global Free-From Food Industry Revenue Million Forecast, by Distribution Channel 2019 & 2032
- Table 45: Global Free-From Food Industry Revenue Million Forecast, by Country 2019 & 2032
- Table 46: United Kingdom Free-From Food Industry Revenue (Million) Forecast, by Application 2019 & 2032
- Table 47: France Free-From Food Industry Revenue (Million) Forecast, by Application 2019 & 2032
- Table 48: Germany Free-From Food Industry Revenue (Million) Forecast, by Application 2019 & 2032
- Table 49: Italy Free-From Food Industry Revenue (Million) Forecast, by Application 2019 & 2032
- Table 50: Spain Free-From Food Industry Revenue (Million) Forecast, by Application 2019 & 2032
- Table 51: Russia Free-From Food Industry Revenue (Million) Forecast, by Application 2019 & 2032
- Table 52: Rest of Europe Free-From Food Industry Revenue (Million) Forecast, by Application 2019 & 2032
- Table 53: Global Free-From Food Industry Revenue Million Forecast, by Type 2019 & 2032
- Table 54: Global Free-From Food Industry Revenue Million Forecast, by End Product 2019 & 2032
- Table 55: Global Free-From Food Industry Revenue Million Forecast, by Distribution Channel 2019 & 2032
- Table 56: Global Free-From Food Industry Revenue Million Forecast, by Country 2019 & 2032
- Table 57: China Free-From Food Industry Revenue (Million) Forecast, by Application 2019 & 2032
- Table 58: Japan Free-From Food Industry Revenue (Million) Forecast, by Application 2019 & 2032
- Table 59: Australia Free-From Food Industry Revenue (Million) Forecast, by Application 2019 & 2032
- Table 60: India Free-From Food Industry Revenue (Million) Forecast, by Application 2019 & 2032
- Table 61: Rest of Asia Pacific Free-From Food Industry Revenue (Million) Forecast, by Application 2019 & 2032
- Table 62: Global Free-From Food Industry Revenue Million Forecast, by Type 2019 & 2032
- Table 63: Global Free-From Food Industry Revenue Million Forecast, by End Product 2019 & 2032
- Table 64: Global Free-From Food Industry Revenue Million Forecast, by Distribution Channel 2019 & 2032
- Table 65: Global Free-From Food Industry Revenue Million Forecast, by Country 2019 & 2032
- Table 66: Brazil Free-From Food Industry Revenue (Million) Forecast, by Application 2019 & 2032
- Table 67: Argentina Free-From Food Industry Revenue (Million) Forecast, by Application 2019 & 2032
- Table 68: Rest of South America Free-From Food Industry Revenue (Million) Forecast, by Application 2019 & 2032
- Table 69: Global Free-From Food Industry Revenue Million Forecast, by Type 2019 & 2032
- Table 70: Global Free-From Food Industry Revenue Million Forecast, by End Product 2019 & 2032
- Table 71: Global Free-From Food Industry Revenue Million Forecast, by Distribution Channel 2019 & 2032
- Table 72: Global Free-From Food Industry Revenue Million Forecast, by Country 2019 & 2032
- Table 73: Global Free-From Food Industry Revenue Million Forecast, by Type 2019 & 2032
- Table 74: Global Free-From Food Industry Revenue Million Forecast, by End Product 2019 & 2032
- Table 75: Global Free-From Food Industry Revenue Million Forecast, by Distribution Channel 2019 & 2032
- Table 76: Global Free-From Food Industry Revenue Million Forecast, by Country 2019 & 2032
- Table 77: South Africa Free-From Food Industry Revenue (Million) Forecast, by Application 2019 & 2032
- Table 78: Rest of Middle East Free-From Food Industry Revenue (Million) Forecast, by Application 2019 & 2032
Frequently Asked Questions
1. What is the projected Compound Annual Growth Rate (CAGR) of the Free-From Food Industry?
The projected CAGR is approximately 13.25%.
2. Which companies are prominent players in the Free-From Food Industry?
Key companies in the market include Reckitt Benckiser Group PLC, The Kellogg Company, Nestle S A, General Mills Inc, Abbott Laboratories, Dr Schar AG / SPA, Danone SA, Blue Diamond Growers, Beyond Meat, Oatly Group AB*List Not Exhaustive.
3. What are the main segments of the Free-From Food Industry?
The market segments include Type, End Product, Distribution Channel.
4. Can you provide details about the market size?
The market size is estimated to be USD 91.55 Million as of 2022.
5. What are some drivers contributing to market growth?
Increasing Health Concerns are Supporting the Market's Growth; Growing Consumer Preference for Convenience Seafood.
6. What are the notable trends driving market growth?
Clean Label Product Development and Associated Labeling Compliance.
7. Are there any restraints impacting market growth?
Rising Concern About Quality and Safety Standards of Canned Tuna.
8. Can you provide examples of recent developments in the market?
November 2022: Beyond Meat launched plant-based chicken products, including Beyond Chicken Nuggets and Beyond Popcorn Chicken. The company claims that the product contains 14 g of plant-based protein derived from a blend of pea and faba beans, 0% cholesterol, 50% less saturated fat, and no added soy, hormones, or antibiotics. The product was made available at more than 5,000 Kroger and Walmart stores in the United States.
9. What pricing options are available for accessing the report?
Pricing options include single-user, multi-user, and enterprise licenses priced at USD 4750, USD 5250, and USD 8750 respectively.
10. Is the market size provided in terms of value or volume?
The market size is provided in terms of value, measured in Million.
11. Are there any specific market keywords associated with the report?
Yes, the market keyword associated with the report is "Free-From Food Industry," which aids in identifying and referencing the specific market segment covered.
12. How do I determine which pricing option suits my needs best?
The pricing options vary based on user requirements and access needs. Individual users may opt for single-user licenses, while businesses requiring broader access may choose multi-user or enterprise licenses for cost-effective access to the report.
13. Are there any additional resources or data provided in the Free-From Food Industry report?
While the report offers comprehensive insights, it's advisable to review the specific contents or supplementary materials provided to ascertain if additional resources or data are available.
14. How can I stay updated on further developments or reports in the Free-From Food Industry?
To stay informed about further developments, trends, and reports in the Free-From Food Industry, consider subscribing to industry newsletters, following relevant companies and organizations, or regularly checking reputable industry news sources and publications.
Methodology
Step 1 - Identification of Relevant Samples Size from Population Database


Step 2 - Approaches for Defining Global Market Size (Value, Volume* & Price*)

Note*: In applicable scenarios
Step 3 - Data Sources
Primary Research
- Web Analytics
- Survey Reports
- Research Institute
- Latest Research Reports
- Opinion Leaders
Secondary Research
- Annual Reports
- White Paper
- Latest Press Release
- Industry Association
- Paid Database
- Investor Presentations

Step 4 - Data Triangulation
Involves using different sources of information in order to increase the validity of a study
These sources are likely to be stakeholders in a program - participants, other researchers, program staff, other community members, and so on.
Then we put all data in single framework & apply various statistical tools to find out the dynamic on the market.
During the analysis stage, feedback from the stakeholder groups would be compared to determine areas of agreement as well as areas of divergence


