
Key Insights
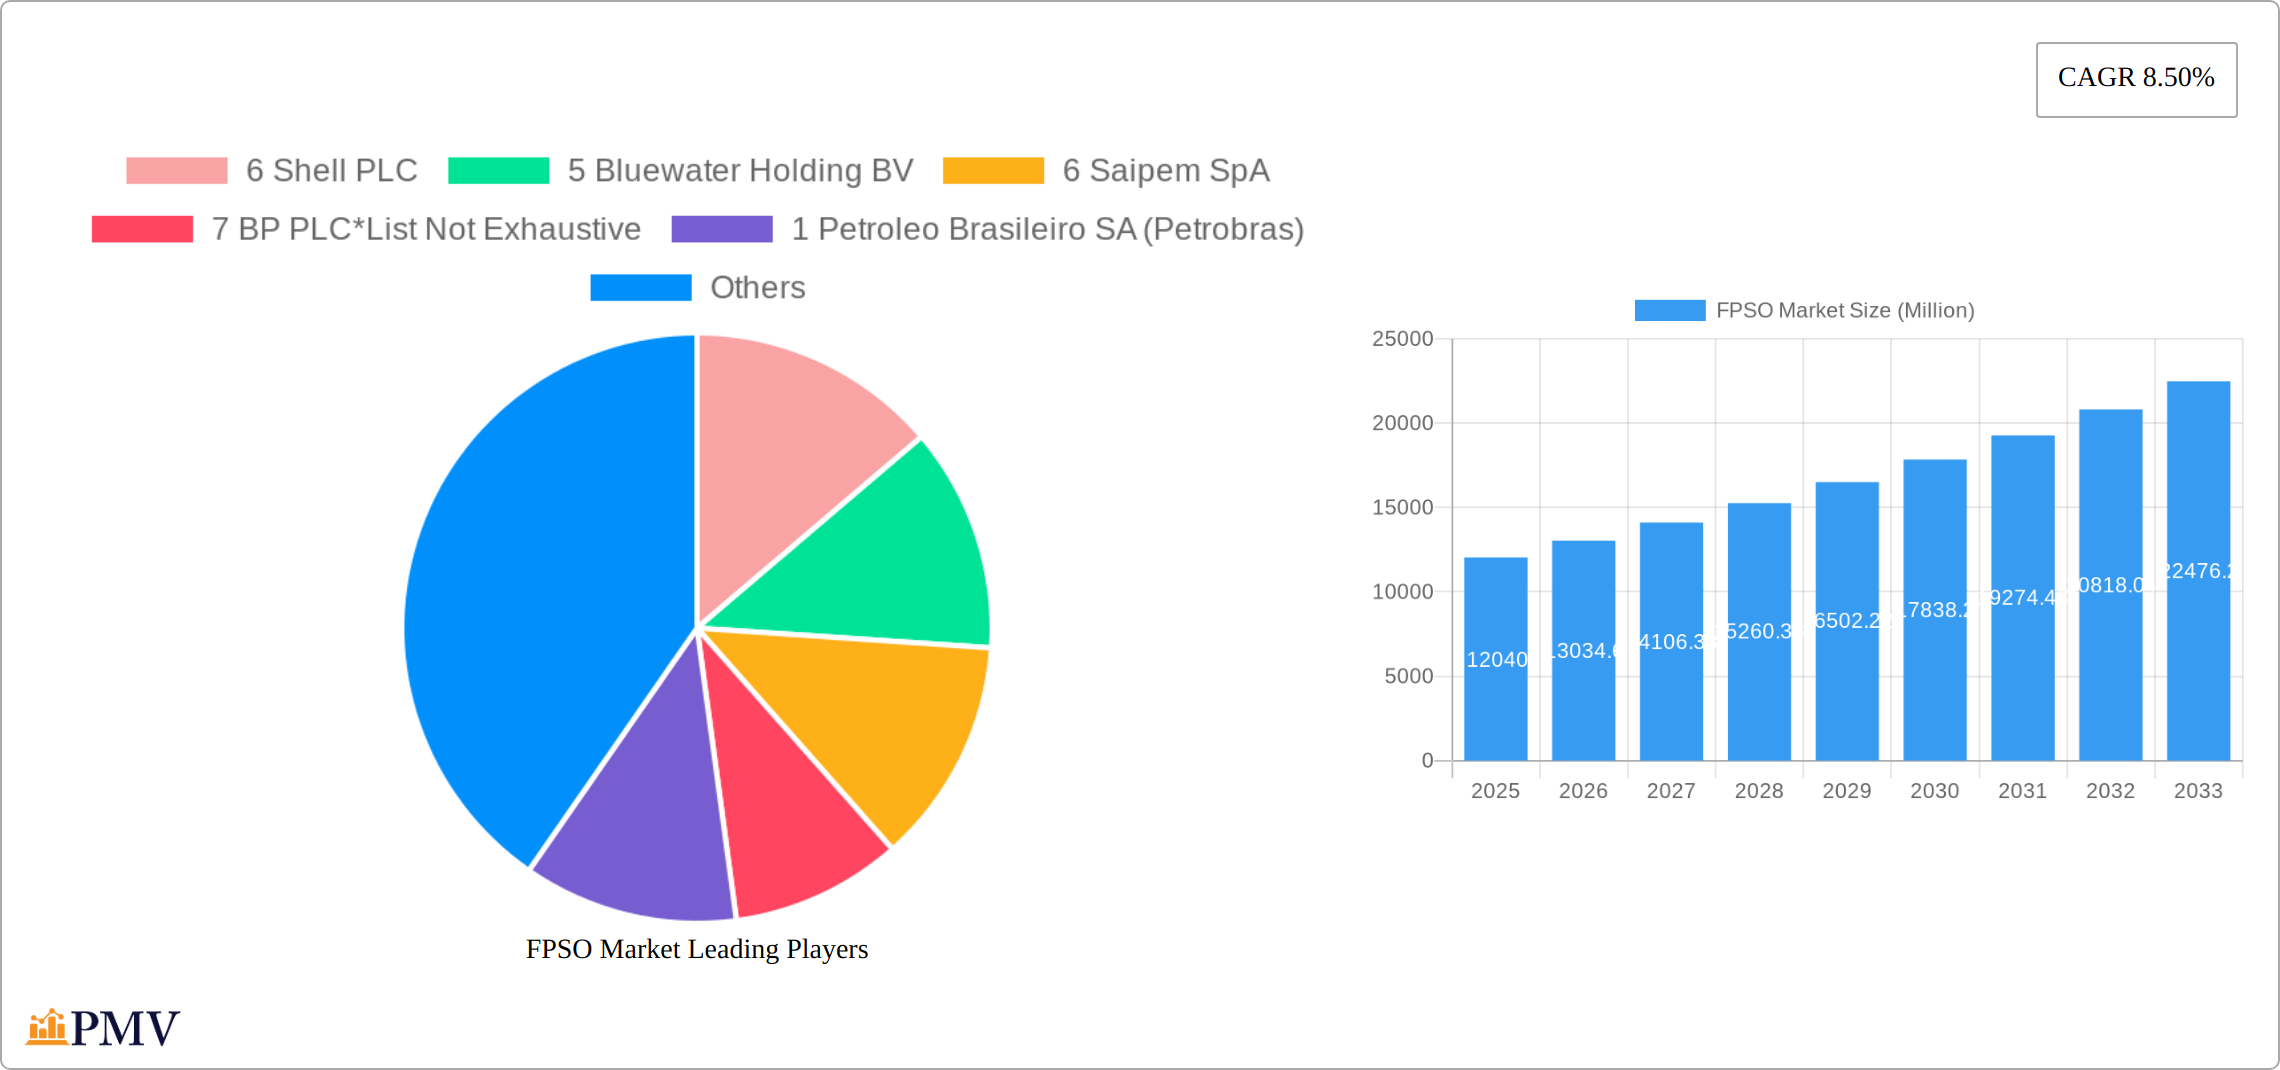
The Floating Production, Storage, and Offloading (FPSO) market is experiencing robust growth, projected to reach $12.04 billion in 2025 and maintain a Compound Annual Growth Rate (CAGR) of 8.50% from 2025 to 2033. This expansion is fueled by several key drivers. The increasing demand for offshore oil and gas exploration and production in deep and ultra-deep waters necessitates the use of FPSOs, which offer efficient and cost-effective solutions for resource extraction in challenging environments. Furthermore, the ongoing shift towards offshore energy development, particularly in regions with significant reserves such as the Asia-Pacific and South America, is boosting market demand. Technological advancements, such as improved subsea processing capabilities and enhanced vessel designs, are also contributing to the market's growth by enabling more efficient and environmentally friendly operations. Finally, the growing preference for operator-owned FPSOs over contractor-owned units reflects a shift toward greater control and optimization of production processes by oil and gas companies.
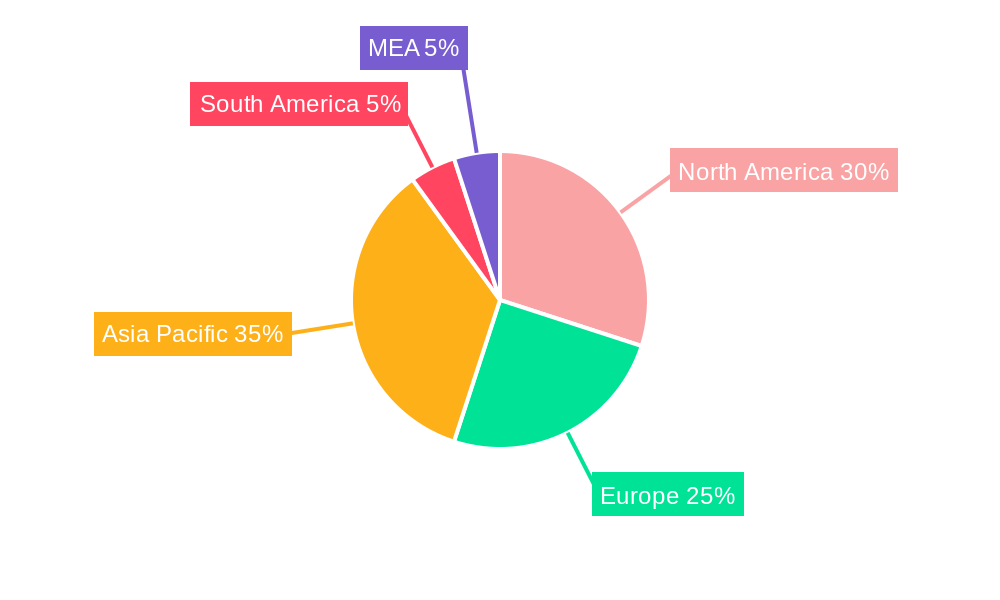
However, market growth is not without its challenges. Regulatory hurdles and environmental concerns, especially related to emissions and potential environmental impact, are imposing restraints. The high capital expenditure required for the construction and operation of FPSOs can also deter some investors. Despite these challenges, the significant potential of untapped offshore resources and the ongoing technological advancements are expected to outweigh these limitations, ensuring sustained market growth over the forecast period. The segmentation of the market by water depth (shallow, deep, ultra-deep) and ownership (operator-owned, contractor-owned) provides valuable insights into market dynamics, highlighting the increasing focus on deepwater operations and operator ownership for better control and optimized production. Key players like Shell PLC, BP PLC, Saipem SpA, and SBM Offshore NV are strategically positioned to capitalize on these trends. The regional distribution of the market, with significant presence in North America, Europe, and Asia-Pacific, indicates diversified growth opportunities across various geographical locations.
This in-depth report provides a comprehensive analysis of the global FPSO (Floating Production, Storage, and Offloading) market, offering valuable insights for industry stakeholders, investors, and researchers. Covering the period 2019-2033, with a focus on 2025, this report meticulously examines market dynamics, competitive landscapes, and future growth prospects. The analysis encompasses detailed segmentations by water depth (shallow, deep, ultra-deep), ownership (operator-owned, contractor-owned), and key regional markets. With a robust data foundation and expert analysis, this report is essential for understanding the complexities and opportunities within the FPSO market.
FPSO Market Structure & Competitive Dynamics
The FPSO market exhibits a moderately concentrated structure, with several major players holding significant market share. The competitive landscape is characterized by intense rivalry, driven by technological advancements, cost optimization strategies, and contract acquisitions. Market concentration is further influenced by the high capital expenditure associated with FPSO projects and the limited number of companies possessing the specialized expertise required. Innovation plays a crucial role, with companies investing in new technologies to enhance efficiency, reduce operational costs, and improve environmental performance. Regulatory frameworks governing offshore operations vary across regions, impacting market access and operational costs. Although there aren't direct substitutes for FPSOs in deepwater oil and gas extraction, alternative technologies like subsea processing systems are increasingly viable for specific applications. End-user preferences are shifting toward larger, more technologically advanced FPSOs capable of handling complex field developments. M&A activities are frequent, driven by companies seeking to expand their market share and consolidate their technological capabilities. For instance, significant M&A deals in recent years have involved companies like SBM Offshore, Modec, and others, with deal values often exceeding xx Million. The market share of the top 5 players is estimated at xx%.
FPSO Market Industry Trends & Insights
The global FPSO market is experiencing robust growth, fueled by the increasing demand for offshore oil and gas resources, particularly in deepwater and ultra-deepwater regions. Technological advancements are unlocking previously inaccessible reserves, further driving market expansion. The Compound Annual Growth Rate (CAGR) for the forecast period (2025-2033) is projected at [Insert Projected CAGR]% representing substantial market growth. This expansion is being propelled by several key factors:
- Exploration of Deepwater Reserves: The significant reserves located in deepwater environments necessitate the use of FPSOs, driving demand.
- Technological Advancements: Innovations in subsea technologies, automation, digitalization, and artificial intelligence are enhancing efficiency, safety, and operational capabilities of FPSOs. [Insert Percentage]% of new FPSO units are anticipated to incorporate advanced automation systems by 2033.
- Evolving Operator Preferences: Operators are increasingly prioritizing FPSOs with higher processing capacity, improved environmental performance (reduced carbon footprint), and enhanced safety features. This reflects the growing importance of sustainability and stringent regulatory compliance.
- Competitive Landscape: Market competition is intense, with companies vying for market share based on pricing strategies, technological superiority, and efficient project execution. This dynamic environment fosters innovation and drives efficiency improvements.
Dominant Markets & Segments in FPSO Market
The deepwater and ultra-deepwater segments are the dominant forces in the FPSO market, primarily due to the vast hydrocarbon reserves situated in these challenging environments. Key regions driving this segment include Brazil, West Africa, and Southeast Asia, which possess significant deepwater oil and gas resources and supportive governmental policies.
- Key Drivers of Deepwater/Ultra-deepwater dominance:
- Abundant undiscovered hydrocarbon reserves.
- Favorable government incentives and policies promoting offshore exploration and production.
- Continuous investment in advanced drilling and subsea technologies, enabling access to these resources.
In terms of ownership, operator-owned FPSOs constitute a larger market share compared to contractor-owned units. This trend is attributed to operators seeking enhanced control over operations, maintenance, and long-term asset management, leading to potentially higher returns on investment and improved integration with overall field development strategies.
- Key Drivers of Operator-owned dominance:
- Greater control over operational strategies and cost management.
- Potential for increased returns on investment through direct asset ownership.
- Seamless integration with broader field development plans and operational synergies.
FPSO Market Product Innovations
Recent advancements in FPSO technology focus on enhanced processing capacity, improved environmental performance through reduced emissions, and increased automation for enhanced safety and efficiency. The integration of digital technologies, including AI and machine learning, is enhancing predictive maintenance and optimizing operational parameters. These innovative features are improving the market fit of FPSOs by enabling efficient exploitation of challenging offshore fields and meeting stringent environmental regulations.
Report Segmentation & Scope
The report segments the FPSO market by water depth (Shallow Water, Deep Water, Ultra-deep Water) and ownership (Operator-owned, Contractor-owned).
Water Depth: Each segment exhibits varying growth rates, with deep and ultra-deepwater segments experiencing faster growth due to higher oil and gas reserves, despite higher investment costs. Market sizes are significantly larger for deep and ultra-deepwater segments.
Ownership: Operator-owned FPSOs currently hold a larger market share, but contractor-owned models are expected to grow due to financial advantages for operators. Competitive dynamics vary between segments, influenced by the technological and operational complexities associated with each segment.
Key Drivers of FPSO Market Growth
Several factors are driving FPSO market growth. Firstly, the increasing global demand for oil and gas, coupled with the depletion of onshore reserves, is propelling exploration and production activities in offshore regions. Secondly, advancements in subsea technologies and FPSO designs are enabling access to deeper waters and more challenging environments. Thirdly, supportive government policies and regulatory frameworks in many countries are incentivizing investment in offshore energy projects. Finally, technological advancements, including automation and digitalization, are improving the efficiency and economics of FPSO operations.
Challenges in the FPSO Market Sector
Despite the positive growth trajectory, the FPSO market faces significant challenges. These include:
- Stringent Environmental Regulations: The increasing focus on reducing carbon emissions and complying with stricter environmental regulations presents operational and financial hurdles for FPSO operators. Meeting these standards necessitates significant investments in technology and operational changes.
- Supply Chain Volatility: Disruptions to the global supply chain and fluctuating raw material prices significantly impact project costs and timelines, leading to potential delays and budget overruns.
- Intense Competition and High Capital Expenditure: The competitive landscape is characterized by intense competition among FPSO contractors, coupled with high capital expenditure requirements for project development. These factors create substantial market entry barriers and contribute to project risks.
Leading Players in the FPSO Market Market
- Shell PLC
- Bluewater Holding BV
- Saipem SpA
- BP PLC
- Petroleo Brasileiro SA (Petrobras)
- Teekay Offshore Partners LP
- Chevron Corporation
- TotalEnergies SE
- Petrofac Limited
- ExxonMobil Corp
- Modec Inc
- BW Offshore Limited
- SBM Offshore NV
- CNOOC Ltd
Key Developments in FPSO Market Sector
- May 2023: SBM Offshore and Esso Exploration & Production Guyana signed a 10-year Operations and Maintenance Enabling Agreement for four FPSOs (Liza Destiny, Liza Unity, Prosperity, and ONE GUYANA), significantly bolstering SBM Offshore's operational footprint and long-term revenue streams.
- April 2023: Shell's resumption of gas production at the Pierce field following FPSO Haewene Brim upgrades demonstrates successful adaptation to evolving market demands and showcases the flexibility of FPSO technology.
- April 2023: KBR's USD 9.4 Billion contract win for Equinor's Bay du Nord project highlights the considerable investment in new FPSO projects and underscores the continued importance of FPSO technology in the offshore oil and gas industry.
Strategic FPSO Market Outlook
The future of the FPSO market is promising, driven by continued exploration and production activities in deepwater regions, technological innovation, and supportive government policies. Strategic opportunities exist for companies that can develop cost-effective, environmentally friendly, and technologically advanced FPSO solutions. The market will witness further consolidation through M&A activity, with companies focusing on enhancing their technological capabilities and expanding their geographical reach. This consolidation will likely drive efficiency gains and improve project execution capabilities within the sector.
FPSO Market Segmentation
-
1. Ownership
- 1.1. Operator-owned
- 1.2. Contractor-owned
-
2. Water Depth
- 2.1. Shallow Water
- 2.2. Deep Water
- 2.3. Ultra-deep Water
FPSO Market Segmentation By Geography
-
1. North America
- 1.1. United States
- 1.2. Canada
- 1.3. Mexico
- 1.4. Rest of North America
-
2. Europe
- 2.1. Norway
- 2.2. United Kingdom
- 2.3. Russia
- 2.4. Netherland
- 2.5. France
- 2.6. Italy
- 2.7. NORDIC
- 2.8. Germany
- 2.9. Spain
- 2.10. Rest of Europe
-
3. Asia Pacific
- 3.1. China
- 3.2. India
- 3.3. Australia
- 3.4. Indonesia
- 3.5. Malaysia
- 3.6. Thailand
- 3.7. Japan
- 3.8. Vietnam
- 3.9. Rest of Asia Pacific
-
4. South America
- 4.1. Brazil
- 4.2. Argentina
- 4.3. Venezuela
- 4.4. Colombia
- 4.5. Rest of South America
-
5. Middle East and Africa
- 5.1. Saudi Arabia
- 5.2. United Arab Emirates
- 5.3. Nigeria
- 5.4. Algeria
- 5.5. Qatar
- 5.6. South Africa
- 5.7. Egypt
- 5.8. Rest of Middle East and Africa
FPSO Market REPORT HIGHLIGHTS
| Aspects | Details |
|---|---|
| Study Period | 2019-2033 |
| Base Year | 2024 |
| Estimated Year | 2025 |
| Forecast Period | 2025-2033 |
| Historical Period | 2019-2024 |
| Growth Rate | CAGR of 8.50% from 2019-2033 |
| Segmentation |
|
Table of Contents
- 1. Introduction
- 1.1. Research Scope
- 1.2. Market Segmentation
- 1.3. Research Methodology
- 1.4. Definitions and Assumptions
- 2. Executive Summary
- 2.1. Introduction
- 3. Market Dynamics
- 3.1. Introduction
- 3.2. Market Drivers
- 3.2.1. 4.; Increasing Offshore Oil and Gas Exploration and Production Activities4.; Growing Demand for Energy
- 3.3. Market Restrains
- 3.3.1. 4.; High Upfront Costs
- 3.4. Market Trends
- 3.4.1. Contractor-owned FPSO Expected to Dominate the Market
- 4. Market Factor Analysis
- 4.1. Porters Five Forces
- 4.2. Supply/Value Chain
- 4.3. PESTEL analysis
- 4.4. Market Entropy
- 4.5. Patent/Trademark Analysis
- 5. Global FPSO Market Analysis, Insights and Forecast, 2019-2031
- 5.1. Market Analysis, Insights and Forecast - by Ownership
- 5.1.1. Operator-owned
- 5.1.2. Contractor-owned
- 5.2. Market Analysis, Insights and Forecast - by Water Depth
- 5.2.1. Shallow Water
- 5.2.2. Deep Water
- 5.2.3. Ultra-deep Water
- 5.3. Market Analysis, Insights and Forecast - by Region
- 5.3.1. North America
- 5.3.2. Europe
- 5.3.3. Asia Pacific
- 5.3.4. South America
- 5.3.5. Middle East and Africa
- 5.1. Market Analysis, Insights and Forecast - by Ownership
- 6. North America FPSO Market Analysis, Insights and Forecast, 2019-2031
- 6.1. Market Analysis, Insights and Forecast - by Ownership
- 6.1.1. Operator-owned
- 6.1.2. Contractor-owned
- 6.2. Market Analysis, Insights and Forecast - by Water Depth
- 6.2.1. Shallow Water
- 6.2.2. Deep Water
- 6.2.3. Ultra-deep Water
- 6.1. Market Analysis, Insights and Forecast - by Ownership
- 7. Europe FPSO Market Analysis, Insights and Forecast, 2019-2031
- 7.1. Market Analysis, Insights and Forecast - by Ownership
- 7.1.1. Operator-owned
- 7.1.2. Contractor-owned
- 7.2. Market Analysis, Insights and Forecast - by Water Depth
- 7.2.1. Shallow Water
- 7.2.2. Deep Water
- 7.2.3. Ultra-deep Water
- 7.1. Market Analysis, Insights and Forecast - by Ownership
- 8. Asia Pacific FPSO Market Analysis, Insights and Forecast, 2019-2031
- 8.1. Market Analysis, Insights and Forecast - by Ownership
- 8.1.1. Operator-owned
- 8.1.2. Contractor-owned
- 8.2. Market Analysis, Insights and Forecast - by Water Depth
- 8.2.1. Shallow Water
- 8.2.2. Deep Water
- 8.2.3. Ultra-deep Water
- 8.1. Market Analysis, Insights and Forecast - by Ownership
- 9. South America FPSO Market Analysis, Insights and Forecast, 2019-2031
- 9.1. Market Analysis, Insights and Forecast - by Ownership
- 9.1.1. Operator-owned
- 9.1.2. Contractor-owned
- 9.2. Market Analysis, Insights and Forecast - by Water Depth
- 9.2.1. Shallow Water
- 9.2.2. Deep Water
- 9.2.3. Ultra-deep Water
- 9.1. Market Analysis, Insights and Forecast - by Ownership
- 10. Middle East and Africa FPSO Market Analysis, Insights and Forecast, 2019-2031
- 10.1. Market Analysis, Insights and Forecast - by Ownership
- 10.1.1. Operator-owned
- 10.1.2. Contractor-owned
- 10.2. Market Analysis, Insights and Forecast - by Water Depth
- 10.2.1. Shallow Water
- 10.2.2. Deep Water
- 10.2.3. Ultra-deep Water
- 10.1. Market Analysis, Insights and Forecast - by Ownership
- 11. North America FPSO Market Analysis, Insights and Forecast, 2019-2031
- 11.1. Market Analysis, Insights and Forecast - By Country/Sub-region
- 11.1.1 United States
- 11.1.2 Canada
- 11.1.3 Mexico
- 12. Europe FPSO Market Analysis, Insights and Forecast, 2019-2031
- 12.1. Market Analysis, Insights and Forecast - By Country/Sub-region
- 12.1.1 Germany
- 12.1.2 United Kingdom
- 12.1.3 France
- 12.1.4 Spain
- 12.1.5 Italy
- 12.1.6 Spain
- 12.1.7 Belgium
- 12.1.8 Netherland
- 12.1.9 Nordics
- 12.1.10 Rest of Europe
- 13. Asia Pacific FPSO Market Analysis, Insights and Forecast, 2019-2031
- 13.1. Market Analysis, Insights and Forecast - By Country/Sub-region
- 13.1.1 China
- 13.1.2 Japan
- 13.1.3 India
- 13.1.4 South Korea
- 13.1.5 Southeast Asia
- 13.1.6 Australia
- 13.1.7 Indonesia
- 13.1.8 Phillipes
- 13.1.9 Singapore
- 13.1.10 Thailandc
- 13.1.11 Rest of Asia Pacific
- 14. South America FPSO Market Analysis, Insights and Forecast, 2019-2031
- 14.1. Market Analysis, Insights and Forecast - By Country/Sub-region
- 14.1.1 Brazil
- 14.1.2 Argentina
- 14.1.3 Peru
- 14.1.4 Chile
- 14.1.5 Colombia
- 14.1.6 Ecuador
- 14.1.7 Venezuela
- 14.1.8 Rest of South America
- 15. North America FPSO Market Analysis, Insights and Forecast, 2019-2031
- 15.1. Market Analysis, Insights and Forecast - By Country/Sub-region
- 15.1.1 United States
- 15.1.2 Canada
- 15.1.3 Mexico
- 16. MEA FPSO Market Analysis, Insights and Forecast, 2019-2031
- 16.1. Market Analysis, Insights and Forecast - By Country/Sub-region
- 16.1.1 United Arab Emirates
- 16.1.2 Saudi Arabia
- 16.1.3 South Africa
- 16.1.4 Rest of Middle East and Africa
- 17. Competitive Analysis
- 17.1. Global Market Share Analysis 2024
- 17.2. Company Profiles
- 17.2.1 6 Shell PLC
- 17.2.1.1. Overview
- 17.2.1.2. Products
- 17.2.1.3. SWOT Analysis
- 17.2.1.4. Recent Developments
- 17.2.1.5. Financials (Based on Availability)
- 17.2.2 5 Bluewater Holding BV
- 17.2.2.1. Overview
- 17.2.2.2. Products
- 17.2.2.3. SWOT Analysis
- 17.2.2.4. Recent Developments
- 17.2.2.5. Financials (Based on Availability)
- 17.2.3 6 Saipem SpA
- 17.2.3.1. Overview
- 17.2.3.2. Products
- 17.2.3.3. SWOT Analysis
- 17.2.3.4. Recent Developments
- 17.2.3.5. Financials (Based on Availability)
- 17.2.4 7 BP PLC*List Not Exhaustive
- 17.2.4.1. Overview
- 17.2.4.2. Products
- 17.2.4.3. SWOT Analysis
- 17.2.4.4. Recent Developments
- 17.2.4.5. Financials (Based on Availability)
- 17.2.5 1 Petroleo Brasileiro SA (Petrobras)
- 17.2.5.1. Overview
- 17.2.5.2. Products
- 17.2.5.3. SWOT Analysis
- 17.2.5.4. Recent Developments
- 17.2.5.5. Financials (Based on Availability)
- 17.2.6 4 Teekay Offshore Partners LP
- 17.2.6.1. Overview
- 17.2.6.2. Products
- 17.2.6.3. SWOT Analysis
- 17.2.6.4. Recent Developments
- 17.2.6.5. Financials (Based on Availability)
- 17.2.7 5 Chevron Corporation
- 17.2.7.1. Overview
- 17.2.7.2. Products
- 17.2.7.3. SWOT Analysis
- 17.2.7.4. Recent Developments
- 17.2.7.5. Financials (Based on Availability)
- 17.2.8 3 TotalEnergies SE
- 17.2.8.1. Overview
- 17.2.8.2. Products
- 17.2.8.3. SWOT Analysis
- 17.2.8.4. Recent Developments
- 17.2.8.5. Financials (Based on Availability)
- 17.2.9 7 Petrofac Limited
- 17.2.9.1. Overview
- 17.2.9.2. Products
- 17.2.9.3. SWOT Analysis
- 17.2.9.4. Recent Developments
- 17.2.9.5. Financials (Based on Availability)
- 17.2.10 4 ExxonMobil Corp
- 17.2.10.1. Overview
- 17.2.10.2. Products
- 17.2.10.3. SWOT Analysis
- 17.2.10.4. Recent Developments
- 17.2.10.5. Financials (Based on Availability)
- 17.2.11 1 Modec Inc
- 17.2.11.1. Overview
- 17.2.11.2. Products
- 17.2.11.3. SWOT Analysis
- 17.2.11.4. Recent Developments
- 17.2.11.5. Financials (Based on Availability)
- 17.2.12 3 BW Offshore Limited
- 17.2.12.1. Overview
- 17.2.12.2. Products
- 17.2.12.3. SWOT Analysis
- 17.2.12.4. Recent Developments
- 17.2.12.5. Financials (Based on Availability)
- 17.2.13 FPSO Operators
- 17.2.13.1. Overview
- 17.2.13.2. Products
- 17.2.13.3. SWOT Analysis
- 17.2.13.4. Recent Developments
- 17.2.13.5. Financials (Based on Availability)
- 17.2.14 2 SBM Offshore NV
- 17.2.14.1. Overview
- 17.2.14.2. Products
- 17.2.14.3. SWOT Analysis
- 17.2.14.4. Recent Developments
- 17.2.14.5. Financials (Based on Availability)
- 17.2.15 2 CNOOC Ltd
- 17.2.15.1. Overview
- 17.2.15.2. Products
- 17.2.15.3. SWOT Analysis
- 17.2.15.4. Recent Developments
- 17.2.15.5. Financials (Based on Availability)
- 17.2.16 FPSO Contractors
- 17.2.16.1. Overview
- 17.2.16.2. Products
- 17.2.16.3. SWOT Analysis
- 17.2.16.4. Recent Developments
- 17.2.16.5. Financials (Based on Availability)
- 17.2.1 6 Shell PLC
List of Figures
- Figure 1: Global FPSO Market Revenue Breakdown (Million, %) by Region 2024 & 2032
- Figure 2: North America FPSO Market Revenue (Million), by Country 2024 & 2032
- Figure 3: North America FPSO Market Revenue Share (%), by Country 2024 & 2032
- Figure 4: Europe FPSO Market Revenue (Million), by Country 2024 & 2032
- Figure 5: Europe FPSO Market Revenue Share (%), by Country 2024 & 2032
- Figure 6: Asia Pacific FPSO Market Revenue (Million), by Country 2024 & 2032
- Figure 7: Asia Pacific FPSO Market Revenue Share (%), by Country 2024 & 2032
- Figure 8: South America FPSO Market Revenue (Million), by Country 2024 & 2032
- Figure 9: South America FPSO Market Revenue Share (%), by Country 2024 & 2032
- Figure 10: North America FPSO Market Revenue (Million), by Country 2024 & 2032
- Figure 11: North America FPSO Market Revenue Share (%), by Country 2024 & 2032
- Figure 12: MEA FPSO Market Revenue (Million), by Country 2024 & 2032
- Figure 13: MEA FPSO Market Revenue Share (%), by Country 2024 & 2032
- Figure 14: North America FPSO Market Revenue (Million), by Ownership 2024 & 2032
- Figure 15: North America FPSO Market Revenue Share (%), by Ownership 2024 & 2032
- Figure 16: North America FPSO Market Revenue (Million), by Water Depth 2024 & 2032
- Figure 17: North America FPSO Market Revenue Share (%), by Water Depth 2024 & 2032
- Figure 18: North America FPSO Market Revenue (Million), by Country 2024 & 2032
- Figure 19: North America FPSO Market Revenue Share (%), by Country 2024 & 2032
- Figure 20: Europe FPSO Market Revenue (Million), by Ownership 2024 & 2032
- Figure 21: Europe FPSO Market Revenue Share (%), by Ownership 2024 & 2032
- Figure 22: Europe FPSO Market Revenue (Million), by Water Depth 2024 & 2032
- Figure 23: Europe FPSO Market Revenue Share (%), by Water Depth 2024 & 2032
- Figure 24: Europe FPSO Market Revenue (Million), by Country 2024 & 2032
- Figure 25: Europe FPSO Market Revenue Share (%), by Country 2024 & 2032
- Figure 26: Asia Pacific FPSO Market Revenue (Million), by Ownership 2024 & 2032
- Figure 27: Asia Pacific FPSO Market Revenue Share (%), by Ownership 2024 & 2032
- Figure 28: Asia Pacific FPSO Market Revenue (Million), by Water Depth 2024 & 2032
- Figure 29: Asia Pacific FPSO Market Revenue Share (%), by Water Depth 2024 & 2032
- Figure 30: Asia Pacific FPSO Market Revenue (Million), by Country 2024 & 2032
- Figure 31: Asia Pacific FPSO Market Revenue Share (%), by Country 2024 & 2032
- Figure 32: South America FPSO Market Revenue (Million), by Ownership 2024 & 2032
- Figure 33: South America FPSO Market Revenue Share (%), by Ownership 2024 & 2032
- Figure 34: South America FPSO Market Revenue (Million), by Water Depth 2024 & 2032
- Figure 35: South America FPSO Market Revenue Share (%), by Water Depth 2024 & 2032
- Figure 36: South America FPSO Market Revenue (Million), by Country 2024 & 2032
- Figure 37: South America FPSO Market Revenue Share (%), by Country 2024 & 2032
- Figure 38: Middle East and Africa FPSO Market Revenue (Million), by Ownership 2024 & 2032
- Figure 39: Middle East and Africa FPSO Market Revenue Share (%), by Ownership 2024 & 2032
- Figure 40: Middle East and Africa FPSO Market Revenue (Million), by Water Depth 2024 & 2032
- Figure 41: Middle East and Africa FPSO Market Revenue Share (%), by Water Depth 2024 & 2032
- Figure 42: Middle East and Africa FPSO Market Revenue (Million), by Country 2024 & 2032
- Figure 43: Middle East and Africa FPSO Market Revenue Share (%), by Country 2024 & 2032
List of Tables
- Table 1: Global FPSO Market Revenue Million Forecast, by Region 2019 & 2032
- Table 2: Global FPSO Market Revenue Million Forecast, by Ownership 2019 & 2032
- Table 3: Global FPSO Market Revenue Million Forecast, by Water Depth 2019 & 2032
- Table 4: Global FPSO Market Revenue Million Forecast, by Region 2019 & 2032
- Table 5: Global FPSO Market Revenue Million Forecast, by Country 2019 & 2032
- Table 6: United States FPSO Market Revenue (Million) Forecast, by Application 2019 & 2032
- Table 7: Canada FPSO Market Revenue (Million) Forecast, by Application 2019 & 2032
- Table 8: Mexico FPSO Market Revenue (Million) Forecast, by Application 2019 & 2032
- Table 9: Global FPSO Market Revenue Million Forecast, by Country 2019 & 2032
- Table 10: Germany FPSO Market Revenue (Million) Forecast, by Application 2019 & 2032
- Table 11: United Kingdom FPSO Market Revenue (Million) Forecast, by Application 2019 & 2032
- Table 12: France FPSO Market Revenue (Million) Forecast, by Application 2019 & 2032
- Table 13: Spain FPSO Market Revenue (Million) Forecast, by Application 2019 & 2032
- Table 14: Italy FPSO Market Revenue (Million) Forecast, by Application 2019 & 2032
- Table 15: Spain FPSO Market Revenue (Million) Forecast, by Application 2019 & 2032
- Table 16: Belgium FPSO Market Revenue (Million) Forecast, by Application 2019 & 2032
- Table 17: Netherland FPSO Market Revenue (Million) Forecast, by Application 2019 & 2032
- Table 18: Nordics FPSO Market Revenue (Million) Forecast, by Application 2019 & 2032
- Table 19: Rest of Europe FPSO Market Revenue (Million) Forecast, by Application 2019 & 2032
- Table 20: Global FPSO Market Revenue Million Forecast, by Country 2019 & 2032
- Table 21: China FPSO Market Revenue (Million) Forecast, by Application 2019 & 2032
- Table 22: Japan FPSO Market Revenue (Million) Forecast, by Application 2019 & 2032
- Table 23: India FPSO Market Revenue (Million) Forecast, by Application 2019 & 2032
- Table 24: South Korea FPSO Market Revenue (Million) Forecast, by Application 2019 & 2032
- Table 25: Southeast Asia FPSO Market Revenue (Million) Forecast, by Application 2019 & 2032
- Table 26: Australia FPSO Market Revenue (Million) Forecast, by Application 2019 & 2032
- Table 27: Indonesia FPSO Market Revenue (Million) Forecast, by Application 2019 & 2032
- Table 28: Phillipes FPSO Market Revenue (Million) Forecast, by Application 2019 & 2032
- Table 29: Singapore FPSO Market Revenue (Million) Forecast, by Application 2019 & 2032
- Table 30: Thailandc FPSO Market Revenue (Million) Forecast, by Application 2019 & 2032
- Table 31: Rest of Asia Pacific FPSO Market Revenue (Million) Forecast, by Application 2019 & 2032
- Table 32: Global FPSO Market Revenue Million Forecast, by Country 2019 & 2032
- Table 33: Brazil FPSO Market Revenue (Million) Forecast, by Application 2019 & 2032
- Table 34: Argentina FPSO Market Revenue (Million) Forecast, by Application 2019 & 2032
- Table 35: Peru FPSO Market Revenue (Million) Forecast, by Application 2019 & 2032
- Table 36: Chile FPSO Market Revenue (Million) Forecast, by Application 2019 & 2032
- Table 37: Colombia FPSO Market Revenue (Million) Forecast, by Application 2019 & 2032
- Table 38: Ecuador FPSO Market Revenue (Million) Forecast, by Application 2019 & 2032
- Table 39: Venezuela FPSO Market Revenue (Million) Forecast, by Application 2019 & 2032
- Table 40: Rest of South America FPSO Market Revenue (Million) Forecast, by Application 2019 & 2032
- Table 41: Global FPSO Market Revenue Million Forecast, by Country 2019 & 2032
- Table 42: United States FPSO Market Revenue (Million) Forecast, by Application 2019 & 2032
- Table 43: Canada FPSO Market Revenue (Million) Forecast, by Application 2019 & 2032
- Table 44: Mexico FPSO Market Revenue (Million) Forecast, by Application 2019 & 2032
- Table 45: Global FPSO Market Revenue Million Forecast, by Country 2019 & 2032
- Table 46: United Arab Emirates FPSO Market Revenue (Million) Forecast, by Application 2019 & 2032
- Table 47: Saudi Arabia FPSO Market Revenue (Million) Forecast, by Application 2019 & 2032
- Table 48: South Africa FPSO Market Revenue (Million) Forecast, by Application 2019 & 2032
- Table 49: Rest of Middle East and Africa FPSO Market Revenue (Million) Forecast, by Application 2019 & 2032
- Table 50: Global FPSO Market Revenue Million Forecast, by Ownership 2019 & 2032
- Table 51: Global FPSO Market Revenue Million Forecast, by Water Depth 2019 & 2032
- Table 52: Global FPSO Market Revenue Million Forecast, by Country 2019 & 2032
- Table 53: United States FPSO Market Revenue (Million) Forecast, by Application 2019 & 2032
- Table 54: Canada FPSO Market Revenue (Million) Forecast, by Application 2019 & 2032
- Table 55: Mexico FPSO Market Revenue (Million) Forecast, by Application 2019 & 2032
- Table 56: Rest of North America FPSO Market Revenue (Million) Forecast, by Application 2019 & 2032
- Table 57: Global FPSO Market Revenue Million Forecast, by Ownership 2019 & 2032
- Table 58: Global FPSO Market Revenue Million Forecast, by Water Depth 2019 & 2032
- Table 59: Global FPSO Market Revenue Million Forecast, by Country 2019 & 2032
- Table 60: Norway FPSO Market Revenue (Million) Forecast, by Application 2019 & 2032
- Table 61: United Kingdom FPSO Market Revenue (Million) Forecast, by Application 2019 & 2032
- Table 62: Russia FPSO Market Revenue (Million) Forecast, by Application 2019 & 2032
- Table 63: Netherland FPSO Market Revenue (Million) Forecast, by Application 2019 & 2032
- Table 64: France FPSO Market Revenue (Million) Forecast, by Application 2019 & 2032
- Table 65: Italy FPSO Market Revenue (Million) Forecast, by Application 2019 & 2032
- Table 66: NORDIC FPSO Market Revenue (Million) Forecast, by Application 2019 & 2032
- Table 67: Germany FPSO Market Revenue (Million) Forecast, by Application 2019 & 2032
- Table 68: Spain FPSO Market Revenue (Million) Forecast, by Application 2019 & 2032
- Table 69: Rest of Europe FPSO Market Revenue (Million) Forecast, by Application 2019 & 2032
- Table 70: Global FPSO Market Revenue Million Forecast, by Ownership 2019 & 2032
- Table 71: Global FPSO Market Revenue Million Forecast, by Water Depth 2019 & 2032
- Table 72: Global FPSO Market Revenue Million Forecast, by Country 2019 & 2032
- Table 73: China FPSO Market Revenue (Million) Forecast, by Application 2019 & 2032
- Table 74: India FPSO Market Revenue (Million) Forecast, by Application 2019 & 2032
- Table 75: Australia FPSO Market Revenue (Million) Forecast, by Application 2019 & 2032
- Table 76: Indonesia FPSO Market Revenue (Million) Forecast, by Application 2019 & 2032
- Table 77: Malaysia FPSO Market Revenue (Million) Forecast, by Application 2019 & 2032
- Table 78: Thailand FPSO Market Revenue (Million) Forecast, by Application 2019 & 2032
- Table 79: Japan FPSO Market Revenue (Million) Forecast, by Application 2019 & 2032
- Table 80: Vietnam FPSO Market Revenue (Million) Forecast, by Application 2019 & 2032
- Table 81: Rest of Asia Pacific FPSO Market Revenue (Million) Forecast, by Application 2019 & 2032
- Table 82: Global FPSO Market Revenue Million Forecast, by Ownership 2019 & 2032
- Table 83: Global FPSO Market Revenue Million Forecast, by Water Depth 2019 & 2032
- Table 84: Global FPSO Market Revenue Million Forecast, by Country 2019 & 2032
- Table 85: Brazil FPSO Market Revenue (Million) Forecast, by Application 2019 & 2032
- Table 86: Argentina FPSO Market Revenue (Million) Forecast, by Application 2019 & 2032
- Table 87: Venezuela FPSO Market Revenue (Million) Forecast, by Application 2019 & 2032
- Table 88: Colombia FPSO Market Revenue (Million) Forecast, by Application 2019 & 2032
- Table 89: Rest of South America FPSO Market Revenue (Million) Forecast, by Application 2019 & 2032
- Table 90: Global FPSO Market Revenue Million Forecast, by Ownership 2019 & 2032
- Table 91: Global FPSO Market Revenue Million Forecast, by Water Depth 2019 & 2032
- Table 92: Global FPSO Market Revenue Million Forecast, by Country 2019 & 2032
- Table 93: Saudi Arabia FPSO Market Revenue (Million) Forecast, by Application 2019 & 2032
- Table 94: United Arab Emirates FPSO Market Revenue (Million) Forecast, by Application 2019 & 2032
- Table 95: Nigeria FPSO Market Revenue (Million) Forecast, by Application 2019 & 2032
- Table 96: Algeria FPSO Market Revenue (Million) Forecast, by Application 2019 & 2032
- Table 97: Qatar FPSO Market Revenue (Million) Forecast, by Application 2019 & 2032
- Table 98: South Africa FPSO Market Revenue (Million) Forecast, by Application 2019 & 2032
- Table 99: Egypt FPSO Market Revenue (Million) Forecast, by Application 2019 & 2032
- Table 100: Rest of Middle East and Africa FPSO Market Revenue (Million) Forecast, by Application 2019 & 2032
Frequently Asked Questions
1. What is the projected Compound Annual Growth Rate (CAGR) of the FPSO Market?
The projected CAGR is approximately 8.50%.
2. Which companies are prominent players in the FPSO Market?
Key companies in the market include 6 Shell PLC, 5 Bluewater Holding BV, 6 Saipem SpA, 7 BP PLC*List Not Exhaustive, 1 Petroleo Brasileiro SA (Petrobras), 4 Teekay Offshore Partners LP, 5 Chevron Corporation, 3 TotalEnergies SE, 7 Petrofac Limited, 4 ExxonMobil Corp, 1 Modec Inc, 3 BW Offshore Limited, FPSO Operators, 2 SBM Offshore NV, 2 CNOOC Ltd, FPSO Contractors.
3. What are the main segments of the FPSO Market?
The market segments include Ownership, Water Depth.
4. Can you provide details about the market size?
The market size is estimated to be USD 12.04 Million as of 2022.
5. What are some drivers contributing to market growth?
4.; Increasing Offshore Oil and Gas Exploration and Production Activities4.; Growing Demand for Energy.
6. What are the notable trends driving market growth?
Contractor-owned FPSO Expected to Dominate the Market.
7. Are there any restraints impacting market growth?
4.; High Upfront Costs.
8. Can you provide examples of recent developments in the market?
May 2023: SBM Offshore and Esso Exploration & Production Guyana entered a 10-year Operations and Maintenance Enabling Agreement. The agreement entails SBM Offshore being responsible for the operations and maintenance of four FPSOs: Liza Destiny, Liza Unity, Prosperity, and ONE GUYANA.
9. What pricing options are available for accessing the report?
Pricing options include single-user, multi-user, and enterprise licenses priced at USD 4750, USD 5250, and USD 8750 respectively.
10. Is the market size provided in terms of value or volume?
The market size is provided in terms of value, measured in Million.
11. Are there any specific market keywords associated with the report?
Yes, the market keyword associated with the report is "FPSO Market," which aids in identifying and referencing the specific market segment covered.
12. How do I determine which pricing option suits my needs best?
The pricing options vary based on user requirements and access needs. Individual users may opt for single-user licenses, while businesses requiring broader access may choose multi-user or enterprise licenses for cost-effective access to the report.
13. Are there any additional resources or data provided in the FPSO Market report?
While the report offers comprehensive insights, it's advisable to review the specific contents or supplementary materials provided to ascertain if additional resources or data are available.
14. How can I stay updated on further developments or reports in the FPSO Market?
To stay informed about further developments, trends, and reports in the FPSO Market, consider subscribing to industry newsletters, following relevant companies and organizations, or regularly checking reputable industry news sources and publications.
Methodology
Step 1 - Identification of Relevant Samples Size from Population Database


Step 2 - Approaches for Defining Global Market Size (Value, Volume* & Price*)

Note*: In applicable scenarios
Step 3 - Data Sources
Primary Research
- Web Analytics
- Survey Reports
- Research Institute
- Latest Research Reports
- Opinion Leaders
Secondary Research
- Annual Reports
- White Paper
- Latest Press Release
- Industry Association
- Paid Database
- Investor Presentations

Step 4 - Data Triangulation
Involves using different sources of information in order to increase the validity of a study
These sources are likely to be stakeholders in a program - participants, other researchers, program staff, other community members, and so on.
Then we put all data in single framework & apply various statistical tools to find out the dynamic on the market.
During the analysis stage, feedback from the stakeholder groups would be compared to determine areas of agreement as well as areas of divergence


