
Key Insights
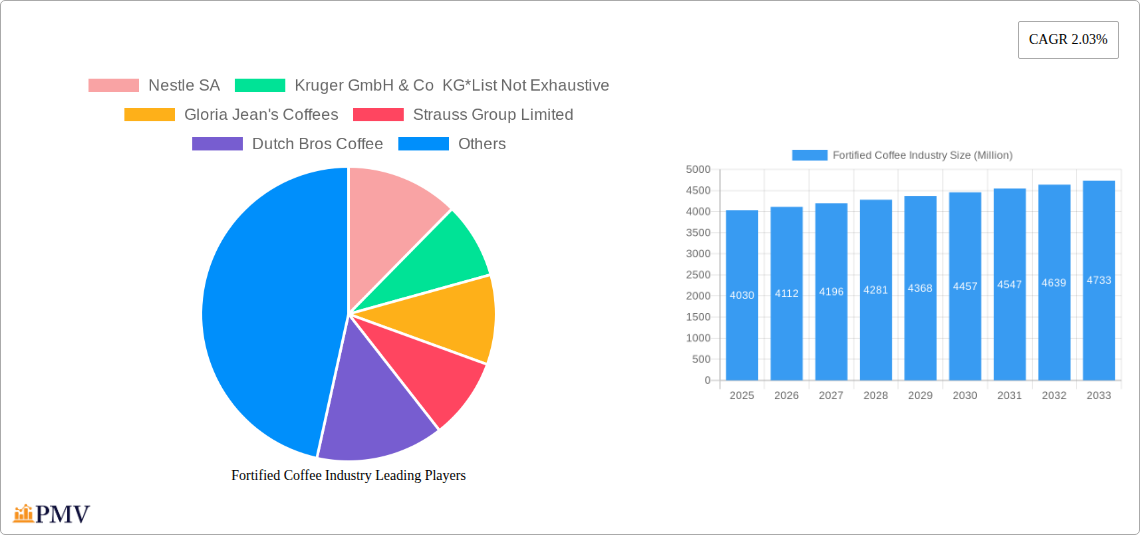
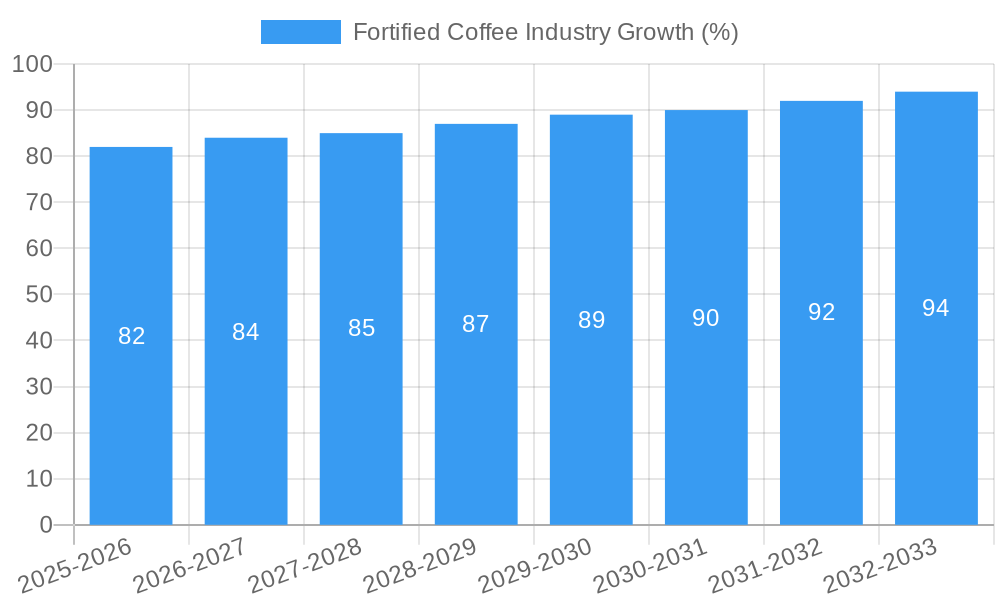
The fortified coffee market, valued at $4.03 billion in 2025, is projected to experience steady growth, driven by increasing consumer awareness of functional beverages and the desire for convenient ways to boost energy and nutrient intake. The market's Compound Annual Growth Rate (CAGR) of 2.03% from 2019-2033 reflects a consistent, albeit moderate, expansion. Key drivers include the rising prevalence of health-conscious consumers seeking enhanced nutritional benefits from their daily coffee ritual, the growing popularity of functional foods and beverages, and the expanding availability of fortified coffee options across various distribution channels. Growth is being fueled by product innovation, with manufacturers introducing new flavors, formats (such as ready-to-drink options), and blends enriched with vitamins, minerals, and adaptogens to cater to specific health needs and preferences. The market is segmented by product type (whole bean, ground, ready-to-drink), and distribution channels (supermarkets, cafes, convenience stores, online). While supermarkets and hypermarkets currently hold significant market share, online channels are demonstrating substantial growth potential, reflecting evolving consumer shopping habits. However, the market faces some restraints, primarily the potential for higher production costs associated with fortification and the need for effective marketing to communicate the added value proposition of fortified coffee to consumers. Competition among established players like Nestlé, Starbucks, and smaller niche brands is intense, demanding innovative product differentiation and targeted marketing campaigns.
The North American market, particularly the United States, is expected to remain a dominant force, driven by high coffee consumption rates and a strong health and wellness culture. However, significant growth opportunities exist in Asia-Pacific and other developing regions with burgeoning middle classes and increased disposable incomes. These regions present significant opportunities due to rising consumer awareness of functional foods and the increasing popularity of coffee culture. The projected growth indicates a significant market opportunity for producers, encouraging investment in research and development to deliver superior products that meet evolving consumer needs and preferences, specifically catering to those seeking functional benefits combined with a convenient and enjoyable coffee experience. The coming years are expected to witness further diversification of product offerings and increased competition, leading to a more dynamic and innovative fortified coffee market.
Fortified Coffee Industry: A Comprehensive Market Report (2019-2033)
This comprehensive report provides a detailed analysis of the Fortified Coffee industry, offering invaluable insights into market trends, competitive dynamics, and future growth prospects. The study period covers 2019-2033, with 2025 serving as the base and estimated year. The forecast period spans 2025-2033, encompassing historical data from 2019-2024. This report is essential for industry stakeholders, investors, and anyone seeking a deep understanding of this rapidly evolving market. The global market size is projected to reach xx Million by 2033, exhibiting a robust CAGR of xx%.
Fortified Coffee Industry Market Structure & Competitive Dynamics
The Fortified Coffee market exhibits a moderately concentrated structure, with key players like Nestle SA, Nestle SA, Kruger GmbH & Co KG, Gloria Jean's Coffees, Strauss Group Limited, Dutch Bros Coffee, Ingenuity Beverages, Starbucks Corporation, Eight O'Clock Coffee Company, Tata Coffee, Luigi Lavazza SpA, and Bulletproof 360 Inc. holding significant market share. However, the presence of numerous smaller players and emerging brands indicates a dynamic competitive landscape.
- Market Concentration: The top 5 players account for approximately xx% of the global market share in 2025.
- Innovation Ecosystems: Significant investments are being made in R&D, particularly in functional coffee blends with added health benefits, driving innovation and product diversification.
- Regulatory Frameworks: Regulations concerning labeling, health claims, and ingredient sourcing vary across regions, influencing market dynamics and competitive strategies.
- Product Substitutes: Other caffeinated beverages and energy drinks pose a competitive threat, demanding continuous innovation and differentiation in the fortified coffee market.
- End-User Trends: Growing health consciousness, increasing demand for convenient options, and a preference for functional beverages are shaping consumer preferences.
- M&A Activities: The market has witnessed several mergers and acquisitions in recent years, with deal values totaling approximately xx Million in the last five years. These activities primarily focus on expanding product portfolios and geographical reach.
Fortified Coffee Industry Industry Trends & Insights
The Fortified Coffee market is experiencing significant growth, driven by several key factors. The increasing health-conscious consumer base fuels the demand for functional beverages enriched with vitamins, minerals, and other beneficial ingredients. The rising disposable incomes, particularly in emerging economies, further contribute to market expansion. Technological advancements, such as improved extraction methods and innovative packaging solutions, enhance product quality and convenience.
The market’s compound annual growth rate (CAGR) from 2025 to 2033 is estimated at xx%, significantly driven by increasing health awareness among consumers, expanding product portfolios, and rising popularity of ready-to-drink (RTD) options. Market penetration remains relatively high in developed nations, but growth potential in developing countries is substantial. The competitive landscape is characterized by both established players and emerging innovative brands, leading to a constant evolution of product offerings and marketing strategies.
Dominant Markets & Segments in Fortified Coffee Industry
The North American region currently holds the largest market share, primarily due to high consumer spending power and the early adoption of functional and fortified food and beverage products. Within product types, RTD coffee is experiencing the fastest growth rate due to its convenience factor. Supermarkets/Hypermarkets remain the dominant distribution channel, but online stores and convenience stores are showing rapid expansion.
- Leading Region: North America
- Dominant Product Type: RTD Coffee (due to convenience)
- Key Distribution Channel: Supermarket/Hypermarket
Key Drivers for Regional Dominance:
- North America: High disposable incomes, health-conscious population, and well-established distribution networks.
- Europe: Growing demand for functional foods and beverages, coupled with increasing health awareness.
- Asia-Pacific: Rapid economic growth, rising middle class, and expanding retail infrastructure.
Fortified Coffee Industry Product Innovations
Recent product developments showcase the industry's focus on functionality and convenience. This includes the rise of mushroom-infused coffee, high-protein blends, and coffees fortified with vitamins and minerals. Companies leverage technological advancements in extraction and processing to enhance both taste and health benefits. The competitive advantage lies in creating unique product profiles that appeal to specific consumer needs, emphasizing natural ingredients and clean labels.
Report Segmentation & Scope
This report segments the Fortified Coffee market based on:
- Product Type: Whole Bean, Ground Coffee, RTD Coffee. RTD Coffee is projected to experience the highest growth due to its convenience.
- Distribution Channel: Supermarket/Hypermarket, Cafes and Foodservice, Convenience Stores, Online Stores, Other Distribution Channels. Online sales are rapidly expanding.
Each segment's growth projection, market size, and competitive landscape are analyzed in detail within the complete report.
Key Drivers of Fortified Coffee Industry Growth
Key factors driving market growth include:
- Health & Wellness Trend: Increasing consumer demand for functional foods and beverages rich in nutrients and antioxidants.
- Convenience: The popularity of RTD coffee caters to busy lifestyles.
- Technological Advancements: Improved extraction methods and packaging innovations enhance product quality.
- Rising Disposable Incomes: Increased spending power fuels demand, especially in emerging markets.
Challenges in the Fortified Coffee Industry Sector
The Fortified Coffee industry faces challenges such as:
- Regulatory Hurdles: Varying regulations across regions concerning labeling, health claims, and ingredients.
- Supply Chain Disruptions: Fluctuations in raw material prices and global supply chain complexities.
- Intense Competition: The market's dynamism necessitates continuous innovation and differentiation.
Leading Players in the Fortified Coffee Industry Market
- Nestle SA
- Kruger GmbH & Co KG
- Gloria Jean's Coffees
- Strauss Group Limited
- Dutch Bros Coffee
- Ingenuity Beverages
- Starbucks Corporation
- Eight O'Clock Coffee Company
- Tata Coffee
- Luigi Lavazza SpA
- Bulletproof 360 Inc
Key Developments in Fortified Coffee Industry Sector
- June 2021: Laird Superfood launched Soothe Coffee and Boost Coffee, expanding its functional coffee range.
- June 2022: Cecors, Inc. (PsyKey) introduced a premium functional mushroom-infused coffee line in the US market.
- August 2022: Herbalife Nutrition launched its High Protein Premix Coffee in Malaysia.
These developments highlight the ongoing innovation and expansion within the fortified coffee market.
Strategic Fortified Coffee Industry Market Outlook
The Fortified Coffee market presents significant growth potential, particularly in emerging markets and with innovative product development. Strategic opportunities lie in expanding into new geographical regions, developing unique product offerings catering to specific health needs, and leveraging digital marketing to reach a broader consumer base. The focus on sustainable sourcing and eco-friendly packaging will become increasingly important.
Fortified Coffee Industry Segmentation
-
1. Product Type
- 1.1. Whole Bean
- 1.2. Ground Coffee
- 1.3. RTD Coffee
-
2. Distribution Channel
- 2.1. Supermarket/Hypermarket
- 2.2. Cafes and Foodservice
- 2.3. Convenience Stores
- 2.4. Online Stores
- 2.5. Other Distribution Channels
Fortified Coffee Industry Segmentation By Geography
-
1. North America
- 1.1. United States
- 1.2. Canada
- 1.3. Mexico
- 1.4. Rest of North America
-
2. Europe
- 2.1. United Kingdom
- 2.2. Germany
- 2.3. France
- 2.4. Russia
- 2.5. Italy
- 2.6. Spain
- 2.7. Rest of Europe
-
3. Asia Pacific
- 3.1. India
- 3.2. China
- 3.3. Japan
- 3.4. Australia
- 3.5. Rest of Asia Pacific
-
4. South America
- 4.1. Brazil
- 4.2. Argentina
- 4.3. Rest of South America
-
5. Middle East and Africa
- 5.1. South Africa
- 5.2. Saudi Arabia
- 5.3. Rest of Middle East and Africa

Fortified Coffee Industry REPORT HIGHLIGHTS
| Aspects | Details |
|---|---|
| Study Period | 2019-2033 |
| Base Year | 2024 |
| Estimated Year | 2025 |
| Forecast Period | 2025-2033 |
| Historical Period | 2019-2024 |
| Growth Rate | CAGR of 2.03% from 2019-2033 |
| Segmentation |
|
Table of Contents
- 1. Introduction
- 1.1. Research Scope
- 1.2. Market Segmentation
- 1.3. Research Methodology
- 1.4. Definitions and Assumptions
- 2. Executive Summary
- 2.1. Introduction
- 3. Market Dynamics
- 3.1. Introduction
- 3.2. Market Drivers
- 3.2.1. Escalating Concern for Quality Drinking Water; Strategic Investment by the Key Players
- 3.3. Market Restrains
- 3.3.1. Need for Stringent Regulatory Landscape
- 3.4. Market Trends
- 3.4.1. Growing Demand for Healthy Hydration
- 4. Market Factor Analysis
- 4.1. Porters Five Forces
- 4.2. Supply/Value Chain
- 4.3. PESTEL analysis
- 4.4. Market Entropy
- 4.5. Patent/Trademark Analysis
- 5. Global Fortified Coffee Industry Analysis, Insights and Forecast, 2019-2031
- 5.1. Market Analysis, Insights and Forecast - by Product Type
- 5.1.1. Whole Bean
- 5.1.2. Ground Coffee
- 5.1.3. RTD Coffee
- 5.2. Market Analysis, Insights and Forecast - by Distribution Channel
- 5.2.1. Supermarket/Hypermarket
- 5.2.2. Cafes and Foodservice
- 5.2.3. Convenience Stores
- 5.2.4. Online Stores
- 5.2.5. Other Distribution Channels
- 5.3. Market Analysis, Insights and Forecast - by Region
- 5.3.1. North America
- 5.3.2. Europe
- 5.3.3. Asia Pacific
- 5.3.4. South America
- 5.3.5. Middle East and Africa
- 5.1. Market Analysis, Insights and Forecast - by Product Type
- 6. North America Fortified Coffee Industry Analysis, Insights and Forecast, 2019-2031
- 6.1. Market Analysis, Insights and Forecast - by Product Type
- 6.1.1. Whole Bean
- 6.1.2. Ground Coffee
- 6.1.3. RTD Coffee
- 6.2. Market Analysis, Insights and Forecast - by Distribution Channel
- 6.2.1. Supermarket/Hypermarket
- 6.2.2. Cafes and Foodservice
- 6.2.3. Convenience Stores
- 6.2.4. Online Stores
- 6.2.5. Other Distribution Channels
- 6.1. Market Analysis, Insights and Forecast - by Product Type
- 7. Europe Fortified Coffee Industry Analysis, Insights and Forecast, 2019-2031
- 7.1. Market Analysis, Insights and Forecast - by Product Type
- 7.1.1. Whole Bean
- 7.1.2. Ground Coffee
- 7.1.3. RTD Coffee
- 7.2. Market Analysis, Insights and Forecast - by Distribution Channel
- 7.2.1. Supermarket/Hypermarket
- 7.2.2. Cafes and Foodservice
- 7.2.3. Convenience Stores
- 7.2.4. Online Stores
- 7.2.5. Other Distribution Channels
- 7.1. Market Analysis, Insights and Forecast - by Product Type
- 8. Asia Pacific Fortified Coffee Industry Analysis, Insights and Forecast, 2019-2031
- 8.1. Market Analysis, Insights and Forecast - by Product Type
- 8.1.1. Whole Bean
- 8.1.2. Ground Coffee
- 8.1.3. RTD Coffee
- 8.2. Market Analysis, Insights and Forecast - by Distribution Channel
- 8.2.1. Supermarket/Hypermarket
- 8.2.2. Cafes and Foodservice
- 8.2.3. Convenience Stores
- 8.2.4. Online Stores
- 8.2.5. Other Distribution Channels
- 8.1. Market Analysis, Insights and Forecast - by Product Type
- 9. South America Fortified Coffee Industry Analysis, Insights and Forecast, 2019-2031
- 9.1. Market Analysis, Insights and Forecast - by Product Type
- 9.1.1. Whole Bean
- 9.1.2. Ground Coffee
- 9.1.3. RTD Coffee
- 9.2. Market Analysis, Insights and Forecast - by Distribution Channel
- 9.2.1. Supermarket/Hypermarket
- 9.2.2. Cafes and Foodservice
- 9.2.3. Convenience Stores
- 9.2.4. Online Stores
- 9.2.5. Other Distribution Channels
- 9.1. Market Analysis, Insights and Forecast - by Product Type
- 10. Middle East and Africa Fortified Coffee Industry Analysis, Insights and Forecast, 2019-2031
- 10.1. Market Analysis, Insights and Forecast - by Product Type
- 10.1.1. Whole Bean
- 10.1.2. Ground Coffee
- 10.1.3. RTD Coffee
- 10.2. Market Analysis, Insights and Forecast - by Distribution Channel
- 10.2.1. Supermarket/Hypermarket
- 10.2.2. Cafes and Foodservice
- 10.2.3. Convenience Stores
- 10.2.4. Online Stores
- 10.2.5. Other Distribution Channels
- 10.1. Market Analysis, Insights and Forecast - by Product Type
- 11. North America Fortified Coffee Industry Analysis, Insights and Forecast, 2019-2031
- 11.1. Market Analysis, Insights and Forecast - By Country/Sub-region
- 11.1.1 United States
- 11.1.2 Canada
- 11.1.3 Mexico
- 11.1.4 Rest of North America
- 12. Europe Fortified Coffee Industry Analysis, Insights and Forecast, 2019-2031
- 12.1. Market Analysis, Insights and Forecast - By Country/Sub-region
- 12.1.1 United Kingdom
- 12.1.2 Germany
- 12.1.3 France
- 12.1.4 Russia
- 12.1.5 Italy
- 12.1.6 Spain
- 12.1.7 Rest of Europe
- 13. Asia Pacific Fortified Coffee Industry Analysis, Insights and Forecast, 2019-2031
- 13.1. Market Analysis, Insights and Forecast - By Country/Sub-region
- 13.1.1 India
- 13.1.2 China
- 13.1.3 Japan
- 13.1.4 Australia
- 13.1.5 Rest of Asia Pacific
- 14. South America Fortified Coffee Industry Analysis, Insights and Forecast, 2019-2031
- 14.1. Market Analysis, Insights and Forecast - By Country/Sub-region
- 14.1.1 Brazil
- 14.1.2 Argentina
- 14.1.3 Rest of South America
- 15. Middle East and Africa Fortified Coffee Industry Analysis, Insights and Forecast, 2019-2031
- 15.1. Market Analysis, Insights and Forecast - By Country/Sub-region
- 15.1.1 South Africa
- 15.1.2 Saudi Arabia
- 15.1.3 Rest of Middle East and Africa
- 16. Competitive Analysis
- 16.1. Global Market Share Analysis 2024
- 16.2. Company Profiles
- 16.2.1 Nestle SA
- 16.2.1.1. Overview
- 16.2.1.2. Products
- 16.2.1.3. SWOT Analysis
- 16.2.1.4. Recent Developments
- 16.2.1.5. Financials (Based on Availability)
- 16.2.2 Kruger GmbH & Co KG*List Not Exhaustive
- 16.2.2.1. Overview
- 16.2.2.2. Products
- 16.2.2.3. SWOT Analysis
- 16.2.2.4. Recent Developments
- 16.2.2.5. Financials (Based on Availability)
- 16.2.3 Gloria Jean's Coffees
- 16.2.3.1. Overview
- 16.2.3.2. Products
- 16.2.3.3. SWOT Analysis
- 16.2.3.4. Recent Developments
- 16.2.3.5. Financials (Based on Availability)
- 16.2.4 Strauss Group Limited
- 16.2.4.1. Overview
- 16.2.4.2. Products
- 16.2.4.3. SWOT Analysis
- 16.2.4.4. Recent Developments
- 16.2.4.5. Financials (Based on Availability)
- 16.2.5 Dutch Bros Coffee
- 16.2.5.1. Overview
- 16.2.5.2. Products
- 16.2.5.3. SWOT Analysis
- 16.2.5.4. Recent Developments
- 16.2.5.5. Financials (Based on Availability)
- 16.2.6 Ingenuity Beverages
- 16.2.6.1. Overview
- 16.2.6.2. Products
- 16.2.6.3. SWOT Analysis
- 16.2.6.4. Recent Developments
- 16.2.6.5. Financials (Based on Availability)
- 16.2.7 Starbucks Corporation
- 16.2.7.1. Overview
- 16.2.7.2. Products
- 16.2.7.3. SWOT Analysis
- 16.2.7.4. Recent Developments
- 16.2.7.5. Financials (Based on Availability)
- 16.2.8 Eight O' Clock Coffee Company
- 16.2.8.1. Overview
- 16.2.8.2. Products
- 16.2.8.3. SWOT Analysis
- 16.2.8.4. Recent Developments
- 16.2.8.5. Financials (Based on Availability)
- 16.2.9 Tata Coffee
- 16.2.9.1. Overview
- 16.2.9.2. Products
- 16.2.9.3. SWOT Analysis
- 16.2.9.4. Recent Developments
- 16.2.9.5. Financials (Based on Availability)
- 16.2.10 Luigi Lavazza SpA
- 16.2.10.1. Overview
- 16.2.10.2. Products
- 16.2.10.3. SWOT Analysis
- 16.2.10.4. Recent Developments
- 16.2.10.5. Financials (Based on Availability)
- 16.2.11 Bulletproof 360 Inc
- 16.2.11.1. Overview
- 16.2.11.2. Products
- 16.2.11.3. SWOT Analysis
- 16.2.11.4. Recent Developments
- 16.2.11.5. Financials (Based on Availability)
- 16.2.1 Nestle SA
List of Figures
- Figure 1: Global Fortified Coffee Industry Revenue Breakdown (Million, %) by Region 2024 & 2032
- Figure 2: North America Fortified Coffee Industry Revenue (Million), by Country 2024 & 2032
- Figure 3: North America Fortified Coffee Industry Revenue Share (%), by Country 2024 & 2032
- Figure 4: Europe Fortified Coffee Industry Revenue (Million), by Country 2024 & 2032
- Figure 5: Europe Fortified Coffee Industry Revenue Share (%), by Country 2024 & 2032
- Figure 6: Asia Pacific Fortified Coffee Industry Revenue (Million), by Country 2024 & 2032
- Figure 7: Asia Pacific Fortified Coffee Industry Revenue Share (%), by Country 2024 & 2032
- Figure 8: South America Fortified Coffee Industry Revenue (Million), by Country 2024 & 2032
- Figure 9: South America Fortified Coffee Industry Revenue Share (%), by Country 2024 & 2032
- Figure 10: Middle East and Africa Fortified Coffee Industry Revenue (Million), by Country 2024 & 2032
- Figure 11: Middle East and Africa Fortified Coffee Industry Revenue Share (%), by Country 2024 & 2032
- Figure 12: North America Fortified Coffee Industry Revenue (Million), by Product Type 2024 & 2032
- Figure 13: North America Fortified Coffee Industry Revenue Share (%), by Product Type 2024 & 2032
- Figure 14: North America Fortified Coffee Industry Revenue (Million), by Distribution Channel 2024 & 2032
- Figure 15: North America Fortified Coffee Industry Revenue Share (%), by Distribution Channel 2024 & 2032
- Figure 16: North America Fortified Coffee Industry Revenue (Million), by Country 2024 & 2032
- Figure 17: North America Fortified Coffee Industry Revenue Share (%), by Country 2024 & 2032
- Figure 18: Europe Fortified Coffee Industry Revenue (Million), by Product Type 2024 & 2032
- Figure 19: Europe Fortified Coffee Industry Revenue Share (%), by Product Type 2024 & 2032
- Figure 20: Europe Fortified Coffee Industry Revenue (Million), by Distribution Channel 2024 & 2032
- Figure 21: Europe Fortified Coffee Industry Revenue Share (%), by Distribution Channel 2024 & 2032
- Figure 22: Europe Fortified Coffee Industry Revenue (Million), by Country 2024 & 2032
- Figure 23: Europe Fortified Coffee Industry Revenue Share (%), by Country 2024 & 2032
- Figure 24: Asia Pacific Fortified Coffee Industry Revenue (Million), by Product Type 2024 & 2032
- Figure 25: Asia Pacific Fortified Coffee Industry Revenue Share (%), by Product Type 2024 & 2032
- Figure 26: Asia Pacific Fortified Coffee Industry Revenue (Million), by Distribution Channel 2024 & 2032
- Figure 27: Asia Pacific Fortified Coffee Industry Revenue Share (%), by Distribution Channel 2024 & 2032
- Figure 28: Asia Pacific Fortified Coffee Industry Revenue (Million), by Country 2024 & 2032
- Figure 29: Asia Pacific Fortified Coffee Industry Revenue Share (%), by Country 2024 & 2032
- Figure 30: South America Fortified Coffee Industry Revenue (Million), by Product Type 2024 & 2032
- Figure 31: South America Fortified Coffee Industry Revenue Share (%), by Product Type 2024 & 2032
- Figure 32: South America Fortified Coffee Industry Revenue (Million), by Distribution Channel 2024 & 2032
- Figure 33: South America Fortified Coffee Industry Revenue Share (%), by Distribution Channel 2024 & 2032
- Figure 34: South America Fortified Coffee Industry Revenue (Million), by Country 2024 & 2032
- Figure 35: South America Fortified Coffee Industry Revenue Share (%), by Country 2024 & 2032
- Figure 36: Middle East and Africa Fortified Coffee Industry Revenue (Million), by Product Type 2024 & 2032
- Figure 37: Middle East and Africa Fortified Coffee Industry Revenue Share (%), by Product Type 2024 & 2032
- Figure 38: Middle East and Africa Fortified Coffee Industry Revenue (Million), by Distribution Channel 2024 & 2032
- Figure 39: Middle East and Africa Fortified Coffee Industry Revenue Share (%), by Distribution Channel 2024 & 2032
- Figure 40: Middle East and Africa Fortified Coffee Industry Revenue (Million), by Country 2024 & 2032
- Figure 41: Middle East and Africa Fortified Coffee Industry Revenue Share (%), by Country 2024 & 2032
List of Tables
- Table 1: Global Fortified Coffee Industry Revenue Million Forecast, by Region 2019 & 2032
- Table 2: Global Fortified Coffee Industry Revenue Million Forecast, by Product Type 2019 & 2032
- Table 3: Global Fortified Coffee Industry Revenue Million Forecast, by Distribution Channel 2019 & 2032
- Table 4: Global Fortified Coffee Industry Revenue Million Forecast, by Region 2019 & 2032
- Table 5: Global Fortified Coffee Industry Revenue Million Forecast, by Country 2019 & 2032
- Table 6: United States Fortified Coffee Industry Revenue (Million) Forecast, by Application 2019 & 2032
- Table 7: Canada Fortified Coffee Industry Revenue (Million) Forecast, by Application 2019 & 2032
- Table 8: Mexico Fortified Coffee Industry Revenue (Million) Forecast, by Application 2019 & 2032
- Table 9: Rest of North America Fortified Coffee Industry Revenue (Million) Forecast, by Application 2019 & 2032
- Table 10: Global Fortified Coffee Industry Revenue Million Forecast, by Country 2019 & 2032
- Table 11: United Kingdom Fortified Coffee Industry Revenue (Million) Forecast, by Application 2019 & 2032
- Table 12: Germany Fortified Coffee Industry Revenue (Million) Forecast, by Application 2019 & 2032
- Table 13: France Fortified Coffee Industry Revenue (Million) Forecast, by Application 2019 & 2032
- Table 14: Russia Fortified Coffee Industry Revenue (Million) Forecast, by Application 2019 & 2032
- Table 15: Italy Fortified Coffee Industry Revenue (Million) Forecast, by Application 2019 & 2032
- Table 16: Spain Fortified Coffee Industry Revenue (Million) Forecast, by Application 2019 & 2032
- Table 17: Rest of Europe Fortified Coffee Industry Revenue (Million) Forecast, by Application 2019 & 2032
- Table 18: Global Fortified Coffee Industry Revenue Million Forecast, by Country 2019 & 2032
- Table 19: India Fortified Coffee Industry Revenue (Million) Forecast, by Application 2019 & 2032
- Table 20: China Fortified Coffee Industry Revenue (Million) Forecast, by Application 2019 & 2032
- Table 21: Japan Fortified Coffee Industry Revenue (Million) Forecast, by Application 2019 & 2032
- Table 22: Australia Fortified Coffee Industry Revenue (Million) Forecast, by Application 2019 & 2032
- Table 23: Rest of Asia Pacific Fortified Coffee Industry Revenue (Million) Forecast, by Application 2019 & 2032
- Table 24: Global Fortified Coffee Industry Revenue Million Forecast, by Country 2019 & 2032
- Table 25: Brazil Fortified Coffee Industry Revenue (Million) Forecast, by Application 2019 & 2032
- Table 26: Argentina Fortified Coffee Industry Revenue (Million) Forecast, by Application 2019 & 2032
- Table 27: Rest of South America Fortified Coffee Industry Revenue (Million) Forecast, by Application 2019 & 2032
- Table 28: Global Fortified Coffee Industry Revenue Million Forecast, by Country 2019 & 2032
- Table 29: South Africa Fortified Coffee Industry Revenue (Million) Forecast, by Application 2019 & 2032
- Table 30: Saudi Arabia Fortified Coffee Industry Revenue (Million) Forecast, by Application 2019 & 2032
- Table 31: Rest of Middle East and Africa Fortified Coffee Industry Revenue (Million) Forecast, by Application 2019 & 2032
- Table 32: Global Fortified Coffee Industry Revenue Million Forecast, by Product Type 2019 & 2032
- Table 33: Global Fortified Coffee Industry Revenue Million Forecast, by Distribution Channel 2019 & 2032
- Table 34: Global Fortified Coffee Industry Revenue Million Forecast, by Country 2019 & 2032
- Table 35: United States Fortified Coffee Industry Revenue (Million) Forecast, by Application 2019 & 2032
- Table 36: Canada Fortified Coffee Industry Revenue (Million) Forecast, by Application 2019 & 2032
- Table 37: Mexico Fortified Coffee Industry Revenue (Million) Forecast, by Application 2019 & 2032
- Table 38: Rest of North America Fortified Coffee Industry Revenue (Million) Forecast, by Application 2019 & 2032
- Table 39: Global Fortified Coffee Industry Revenue Million Forecast, by Product Type 2019 & 2032
- Table 40: Global Fortified Coffee Industry Revenue Million Forecast, by Distribution Channel 2019 & 2032
- Table 41: Global Fortified Coffee Industry Revenue Million Forecast, by Country 2019 & 2032
- Table 42: United Kingdom Fortified Coffee Industry Revenue (Million) Forecast, by Application 2019 & 2032
- Table 43: Germany Fortified Coffee Industry Revenue (Million) Forecast, by Application 2019 & 2032
- Table 44: France Fortified Coffee Industry Revenue (Million) Forecast, by Application 2019 & 2032
- Table 45: Russia Fortified Coffee Industry Revenue (Million) Forecast, by Application 2019 & 2032
- Table 46: Italy Fortified Coffee Industry Revenue (Million) Forecast, by Application 2019 & 2032
- Table 47: Spain Fortified Coffee Industry Revenue (Million) Forecast, by Application 2019 & 2032
- Table 48: Rest of Europe Fortified Coffee Industry Revenue (Million) Forecast, by Application 2019 & 2032
- Table 49: Global Fortified Coffee Industry Revenue Million Forecast, by Product Type 2019 & 2032
- Table 50: Global Fortified Coffee Industry Revenue Million Forecast, by Distribution Channel 2019 & 2032
- Table 51: Global Fortified Coffee Industry Revenue Million Forecast, by Country 2019 & 2032
- Table 52: India Fortified Coffee Industry Revenue (Million) Forecast, by Application 2019 & 2032
- Table 53: China Fortified Coffee Industry Revenue (Million) Forecast, by Application 2019 & 2032
- Table 54: Japan Fortified Coffee Industry Revenue (Million) Forecast, by Application 2019 & 2032
- Table 55: Australia Fortified Coffee Industry Revenue (Million) Forecast, by Application 2019 & 2032
- Table 56: Rest of Asia Pacific Fortified Coffee Industry Revenue (Million) Forecast, by Application 2019 & 2032
- Table 57: Global Fortified Coffee Industry Revenue Million Forecast, by Product Type 2019 & 2032
- Table 58: Global Fortified Coffee Industry Revenue Million Forecast, by Distribution Channel 2019 & 2032
- Table 59: Global Fortified Coffee Industry Revenue Million Forecast, by Country 2019 & 2032
- Table 60: Brazil Fortified Coffee Industry Revenue (Million) Forecast, by Application 2019 & 2032
- Table 61: Argentina Fortified Coffee Industry Revenue (Million) Forecast, by Application 2019 & 2032
- Table 62: Rest of South America Fortified Coffee Industry Revenue (Million) Forecast, by Application 2019 & 2032
- Table 63: Global Fortified Coffee Industry Revenue Million Forecast, by Product Type 2019 & 2032
- Table 64: Global Fortified Coffee Industry Revenue Million Forecast, by Distribution Channel 2019 & 2032
- Table 65: Global Fortified Coffee Industry Revenue Million Forecast, by Country 2019 & 2032
- Table 66: South Africa Fortified Coffee Industry Revenue (Million) Forecast, by Application 2019 & 2032
- Table 67: Saudi Arabia Fortified Coffee Industry Revenue (Million) Forecast, by Application 2019 & 2032
- Table 68: Rest of Middle East and Africa Fortified Coffee Industry Revenue (Million) Forecast, by Application 2019 & 2032
Frequently Asked Questions
1. What is the projected Compound Annual Growth Rate (CAGR) of the Fortified Coffee Industry?
The projected CAGR is approximately 2.03%.
2. Which companies are prominent players in the Fortified Coffee Industry?
Key companies in the market include Nestle SA, Kruger GmbH & Co KG*List Not Exhaustive, Gloria Jean's Coffees, Strauss Group Limited, Dutch Bros Coffee, Ingenuity Beverages, Starbucks Corporation, Eight O' Clock Coffee Company, Tata Coffee, Luigi Lavazza SpA, Bulletproof 360 Inc.
3. What are the main segments of the Fortified Coffee Industry?
The market segments include Product Type, Distribution Channel.
4. Can you provide details about the market size?
The market size is estimated to be USD 4.03 Million as of 2022.
5. What are some drivers contributing to market growth?
Escalating Concern for Quality Drinking Water; Strategic Investment by the Key Players.
6. What are the notable trends driving market growth?
Growing Demand for Healthy Hydration.
7. Are there any restraints impacting market growth?
Need for Stringent Regulatory Landscape.
8. Can you provide examples of recent developments in the market?
August 2022: Herbalife Nutrition launched its first functional coffee mix, High Protein Premix Coffee, in the Malaysian market. According to the company statement, the high-protein premix coffee was designed for consumers who want to reduce calories, fat, and sugar.
9. What pricing options are available for accessing the report?
Pricing options include single-user, multi-user, and enterprise licenses priced at USD 4750, USD 5250, and USD 8750 respectively.
10. Is the market size provided in terms of value or volume?
The market size is provided in terms of value, measured in Million.
11. Are there any specific market keywords associated with the report?
Yes, the market keyword associated with the report is "Fortified Coffee Industry," which aids in identifying and referencing the specific market segment covered.
12. How do I determine which pricing option suits my needs best?
The pricing options vary based on user requirements and access needs. Individual users may opt for single-user licenses, while businesses requiring broader access may choose multi-user or enterprise licenses for cost-effective access to the report.
13. Are there any additional resources or data provided in the Fortified Coffee Industry report?
While the report offers comprehensive insights, it's advisable to review the specific contents or supplementary materials provided to ascertain if additional resources or data are available.
14. How can I stay updated on further developments or reports in the Fortified Coffee Industry?
To stay informed about further developments, trends, and reports in the Fortified Coffee Industry, consider subscribing to industry newsletters, following relevant companies and organizations, or regularly checking reputable industry news sources and publications.
Methodology
Step 1 - Identification of Relevant Samples Size from Population Database


Step 2 - Approaches for Defining Global Market Size (Value, Volume* & Price*)

Note*: In applicable scenarios
Step 3 - Data Sources
Primary Research
- Web Analytics
- Survey Reports
- Research Institute
- Latest Research Reports
- Opinion Leaders
Secondary Research
- Annual Reports
- White Paper
- Latest Press Release
- Industry Association
- Paid Database
- Investor Presentations

Step 4 - Data Triangulation
Involves using different sources of information in order to increase the validity of a study
These sources are likely to be stakeholders in a program - participants, other researchers, program staff, other community members, and so on.
Then we put all data in single framework & apply various statistical tools to find out the dynamic on the market.
During the analysis stage, feedback from the stakeholder groups would be compared to determine areas of agreement as well as areas of divergence


