
Key Insights
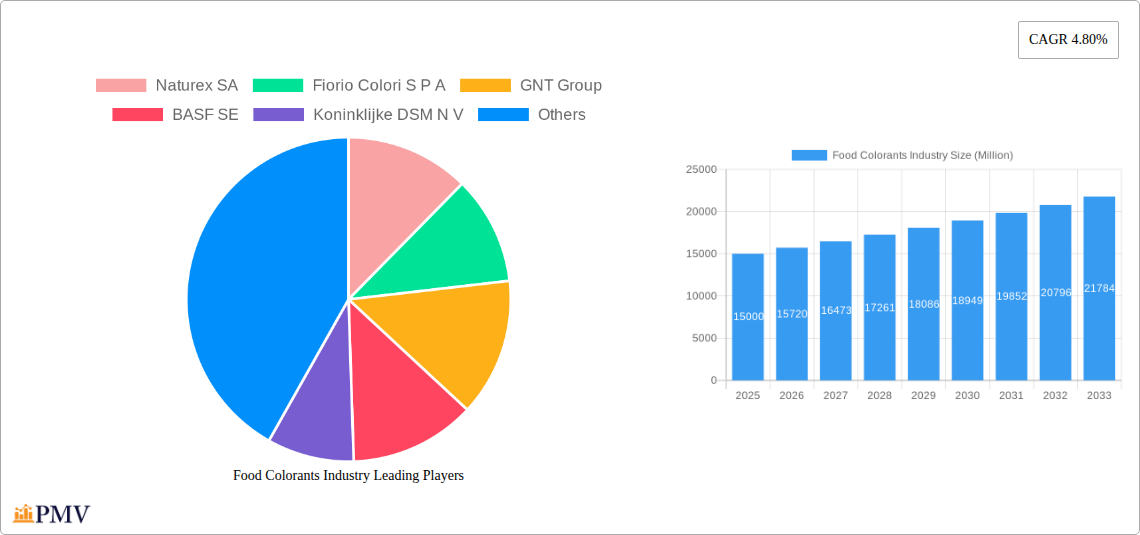
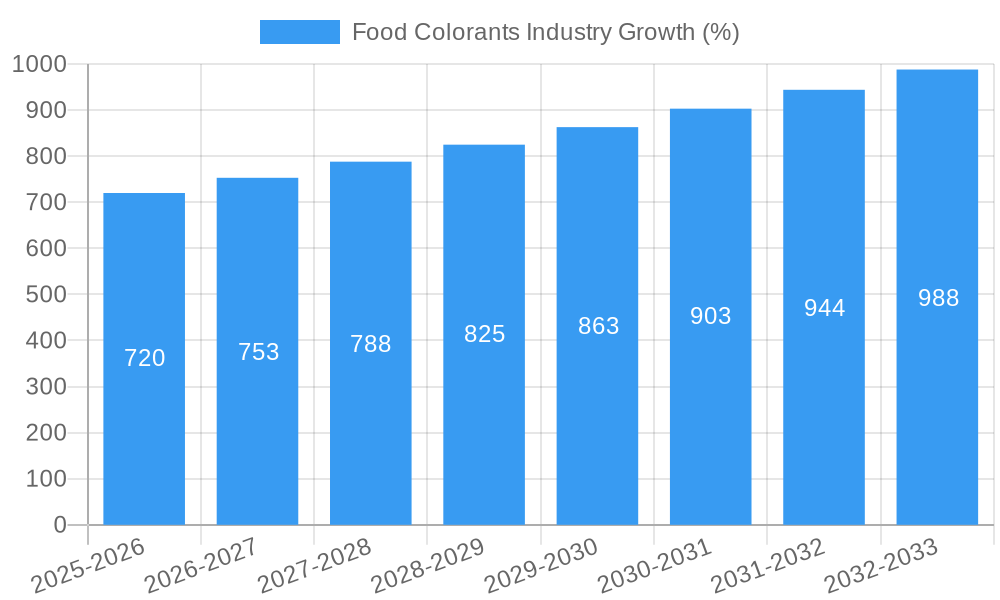
The global food colorants market, valued at approximately $XX million in 2025, is projected to experience robust growth, exhibiting a compound annual growth rate (CAGR) of 4.80% from 2025 to 2033. This expansion is driven by several key factors. Increasing demand for visually appealing and attractive food products across diverse categories like beverages, confectionery, and dairy products fuels the market's growth. The rising popularity of processed and convenience foods further contributes to this trend. Consumer preferences for natural and organic food colorants are also significantly impacting the market, leading to increased innovation and product development in this segment. However, stringent regulations concerning the safety and usage of certain synthetic colorants pose a challenge to market expansion. Furthermore, fluctuating raw material prices and the potential for stricter environmental regulations could impact overall market growth. The market is segmented by product type (natural and synthetic) and application (beverages, dairy & frozen products, bakery, meat, poultry and seafood, confectionery, sauces and condiments, and others). Key players like Naturex SA, Fiorio Colori S P A, GNT Group, and BASF SE are actively shaping the market through strategic innovations, acquisitions, and geographical expansions. The Asia-Pacific region, driven by rapid economic growth and evolving consumer preferences, is anticipated to witness substantial growth in the coming years.
The competitive landscape is characterized by both established multinational corporations and smaller, specialized companies. Companies are focusing on expanding their product portfolios to cater to the growing demand for natural and clean-label food colorants. Strategic partnerships and collaborations are becoming increasingly common to gain access to new technologies and expand market reach. Future growth prospects are further enhanced by the development of innovative colorant technologies and the exploration of new color shades to meet the evolving needs of the food industry. While challenges exist, the overall market outlook remains positive, driven by sustained demand from the food and beverage sector and the increasing preference for visually appealing food products.
Food Colorants Industry: A Comprehensive Market Report (2019-2033)
This in-depth report provides a comprehensive analysis of the global food colorants market, offering invaluable insights for stakeholders, investors, and industry professionals. Covering the period from 2019 to 2033, with a focus on 2025, this report examines market dynamics, competitive landscapes, and future growth potential. The market is projected to reach xx Million by 2033, showcasing substantial growth opportunities.
Food Colorants Industry Market Structure & Competitive Dynamics
The food colorants market exhibits a moderately concentrated structure, with key players like BASF SE, Koninklijke DSM N.V., and GNT Group holding significant market shares. However, the presence of numerous smaller players, particularly in the natural color segment, fosters a dynamic competitive landscape. Innovation plays a crucial role, with companies continuously investing in R&D to develop novel colors and applications. Regulatory frameworks, varying significantly across regions, significantly impact market dynamics and product approvals. Product substitutes, such as naturally derived alternatives, pose a competitive challenge. End-user trends towards cleaner labels and healthier food options drive demand for natural food colorants. M&A activities have been relatively infrequent in recent years, with deal values averaging around xx Million, reflecting strategic consolidation and expansion efforts. Market share data for the top 5 players in 2024 is estimated to be as follows: BASF SE (15%), Koninklijke DSM N.V. (12%), GNT Group (8%), Naturex SA (6%), and D D Williamson & Co (5%). The remaining market share is distributed among numerous smaller players.
Food Colorants Industry Industry Trends & Insights
The food colorants market is experiencing robust growth, driven by factors such as increasing demand for processed foods, expanding beverage consumption, and evolving consumer preferences. The market is witnessing a notable shift towards natural food colorants due to rising health consciousness and stringent regulations. Technological advancements, particularly in extraction and synthesis processes, are fueling innovation. The CAGR for the period 2025-2033 is estimated to be around xx%, reflecting steady growth momentum. The market penetration of natural colorants is gradually increasing, reaching an estimated xx% in 2024 and projected to grow to xx% by 2033. Competitive dynamics remain intense, with companies focusing on product differentiation, brand building, and strategic partnerships. The rising demand for customized color solutions and the introduction of new shades further propel market expansion.
Dominant Markets & Segments in Food Colorants Industry
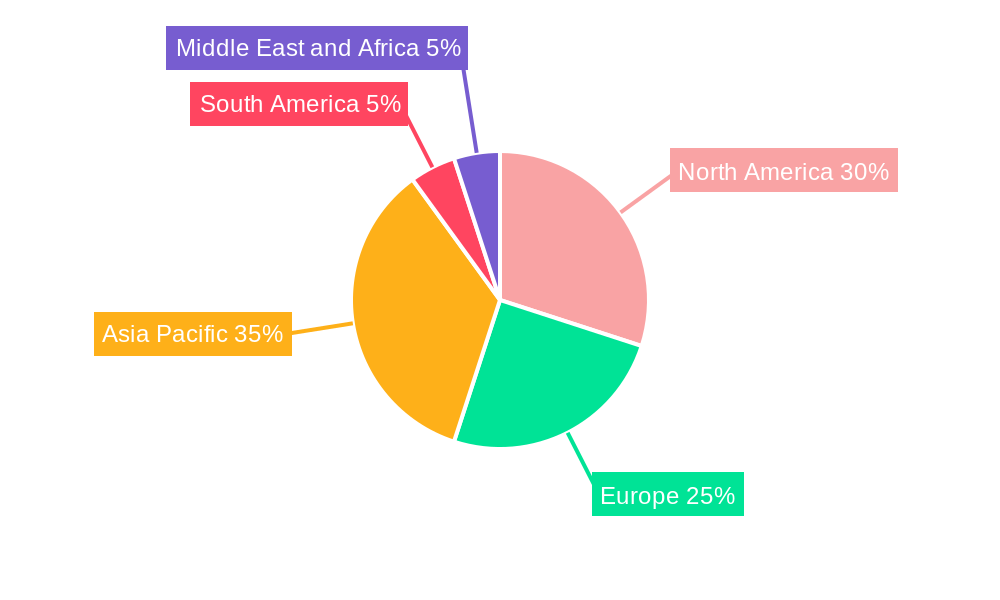
Leading Region: North America currently holds a dominant position in the global food colorants market, driven by high processed food consumption and robust food and beverage industries. Key drivers include established food processing infrastructure and favorable economic conditions.
Leading Country: The United States continues to be the largest consumer of food colorants globally.
Dominant Product Type: Synthetic colors currently dominate the market due to their cost-effectiveness and wide range of available shades. However, the natural color segment is witnessing strong growth, driven by health concerns and regulatory pressures.
Dominant Application: The beverages segment accounts for a major share of the food colorants market, reflecting high consumption levels and a wide variety of colored beverages. Dairy & Frozen Products, Bakery, and Confectionery also represent significant application segments.
The North American dominance is primarily attributed to established processing infrastructure, high per capita income, and sophisticated food and beverage processing industries. The substantial growth of the synthetic color segment is primarily due to its lower cost of production compared to natural alternatives. While the beverages segment holds the largest application market share currently, the Dairy & Frozen Products and Confectionery segments are expected to show significant growth in the coming years.
Food Colorants Industry Product Innovations
Recent years have witnessed significant product innovations in the food colorants market, particularly in the natural color segment. Companies are actively investing in R&D to develop innovative solutions that offer vibrant colors, excellent stability, and compatibility with a wide range of food products. Technological advancements, such as the use of advanced extraction methods and precision synthesis techniques, are leading to superior colorants with enhanced functionality. New product launches, including those by GNT Group (EXBERRY® Shade Pink - OD) and Chr. Hansen's focus on expanding their natural color solutions, showcase the industry's focus on meeting consumer demand for cleaner label products. These innovations are crucial in improving market fit and achieving a competitive edge.
Report Segmentation & Scope
This report comprehensively segments the food colorants market based on product type (Natural Color, Synthetic Color) and application (Beverages, Dairy & Frozen Products, Bakery, Meat, Poultry and Seafood, Confectionery, Sauces and Condiments, Others). Each segment's growth projections, market sizes, and competitive dynamics are analyzed in detail. The natural color segment is expected to witness a higher CAGR than the synthetic color segment due to changing consumer preferences. Similarly, the beverages and confectionery application segments are projected to demonstrate significant growth due to high consumption rates and increasing demand for visually appealing products. Competitive dynamics vary across segments, with some segments showing higher levels of concentration than others.
Key Drivers of Food Colorants Industry Growth
The food colorants market growth is primarily propelled by the increasing demand for processed and packaged food and beverages. Economic growth and rising disposable incomes in developing countries contribute to higher consumption rates. Technological advancements and the introduction of innovative colors drive market expansion. Favorable regulatory environments and growing consumer acceptance of natural colorants further contribute to market growth. Stricter regulations on synthetic colorants in some regions are also accelerating the growth of the natural color segment.
Challenges in the Food Colorants Industry Sector
The food colorants industry faces various challenges, including fluctuating raw material prices, which impact production costs. Stricter regulatory compliance requirements and concerns about the safety of certain synthetic colorants create additional hurdles. The increasing competition from both established and new players can put pressure on margins. Supply chain disruptions and volatility in global markets also affect product availability and pricing. These factors pose significant challenges to the sustainable growth of the food colorants industry.
Leading Players in the Food Colorants Industry Market
- Naturex SA
- Fiorio Colori S P A
- GNT Group
- BASF SE
- Koninklijke DSM N.V.
- D D Williamson & Co
- Likored
- Chr. Hansen holdings
- Dohler group
- Sensient technologies Corporation
Key Developments in Food Colorants Industry Sector
- January 2021: GNT Group launched EXBERRY® Shade Pink - OD, expanding its natural color range for fat-based applications.
- October 2020: Chr. Hansen established an R&D center in Montpellier, France, focusing on natural color solutions.
- January 2020: Azelis and BASF partnered for Health Ingredients & Colorants in Greece.
These developments highlight the industry's focus on innovation, expansion into new application areas, and strategic partnerships to strengthen market position.
Strategic Food Colorants Industry Market Outlook
The food colorants market is poised for continued growth, driven by rising consumer demand, innovation, and evolving regulatory landscapes. Strategic opportunities lie in the development and commercialization of sustainable, high-performance natural colorants. Companies that successfully leverage technological advancements, cater to consumer preferences for cleaner labels, and navigate regulatory complexities will be well-positioned for success. Focus on regional expansion and strategic partnerships will further enhance growth prospects. The market's future potential is substantial, promising significant returns for businesses that adopt proactive and innovative approaches.
Food Colorants Industry Segmentation
-
1. Product Type
- 1.1. Natural Color
- 1.2. Synthetic Color
-
2. Application
- 2.1. Beverages
- 2.2. Dairy & Frozen Products
- 2.3. Bakery
- 2.4. Meat, Poultry and Seafood
- 2.5. Confectionery
- 2.6. Sauces and Condiments
- 2.7. Others
Food Colorants Industry Segmentation By Geography
-
1. North America
- 1.1. United States
- 1.2. Canada
- 1.3. Mexico
- 1.4. Rest of North America
-
2. Europe
- 2.1. Germany
- 2.2. United Kingdom
- 2.3. France
- 2.4. Italy
- 2.5. Russia
- 2.6. Spain
- 2.7. Rest of Europe
-
3. Asia Pacific
- 3.1. India
- 3.2. China
- 3.3. Australia
- 3.4. Japan
- 3.5. Rest of Asia Pacific
-
4. South America
- 4.1. Brazil
- 4.2. Argentina
- 4.3. Rest of South America
-
5. Middle East and Africa
- 5.1. United Arab Emirates
- 5.2. South Africa
- 5.3. Rest of Middle East and Africa
Food Colorants Industry REPORT HIGHLIGHTS
| Aspects | Details |
|---|---|
| Study Period | 2019-2033 |
| Base Year | 2024 |
| Estimated Year | 2025 |
| Forecast Period | 2025-2033 |
| Historical Period | 2019-2024 |
| Growth Rate | CAGR of 4.80% from 2019-2033 |
| Segmentation |
|
Table of Contents
- 1. Introduction
- 1.1. Research Scope
- 1.2. Market Segmentation
- 1.3. Research Methodology
- 1.4. Definitions and Assumptions
- 2. Executive Summary
- 2.1. Introduction
- 3. Market Dynamics
- 3.1. Introduction
- 3.2. Market Drivers
- 3.2.1. Rising Health Consciousness among consumer
- 3.3. Market Restrains
- 3.3.1. High Cost of natural Ingredients
- 3.4. Market Trends
- 3.4.1. Increasing Demand For Natural Food Colorants
- 4. Market Factor Analysis
- 4.1. Porters Five Forces
- 4.2. Supply/Value Chain
- 4.3. PESTEL analysis
- 4.4. Market Entropy
- 4.5. Patent/Trademark Analysis
- 5. Global Food Colorants Industry Analysis, Insights and Forecast, 2019-2031
- 5.1. Market Analysis, Insights and Forecast - by Product Type
- 5.1.1. Natural Color
- 5.1.2. Synthetic Color
- 5.2. Market Analysis, Insights and Forecast - by Application
- 5.2.1. Beverages
- 5.2.2. Dairy & Frozen Products
- 5.2.3. Bakery
- 5.2.4. Meat, Poultry and Seafood
- 5.2.5. Confectionery
- 5.2.6. Sauces and Condiments
- 5.2.7. Others
- 5.3. Market Analysis, Insights and Forecast - by Region
- 5.3.1. North America
- 5.3.2. Europe
- 5.3.3. Asia Pacific
- 5.3.4. South America
- 5.3.5. Middle East and Africa
- 5.1. Market Analysis, Insights and Forecast - by Product Type
- 6. North America Food Colorants Industry Analysis, Insights and Forecast, 2019-2031
- 6.1. Market Analysis, Insights and Forecast - by Product Type
- 6.1.1. Natural Color
- 6.1.2. Synthetic Color
- 6.2. Market Analysis, Insights and Forecast - by Application
- 6.2.1. Beverages
- 6.2.2. Dairy & Frozen Products
- 6.2.3. Bakery
- 6.2.4. Meat, Poultry and Seafood
- 6.2.5. Confectionery
- 6.2.6. Sauces and Condiments
- 6.2.7. Others
- 6.1. Market Analysis, Insights and Forecast - by Product Type
- 7. Europe Food Colorants Industry Analysis, Insights and Forecast, 2019-2031
- 7.1. Market Analysis, Insights and Forecast - by Product Type
- 7.1.1. Natural Color
- 7.1.2. Synthetic Color
- 7.2. Market Analysis, Insights and Forecast - by Application
- 7.2.1. Beverages
- 7.2.2. Dairy & Frozen Products
- 7.2.3. Bakery
- 7.2.4. Meat, Poultry and Seafood
- 7.2.5. Confectionery
- 7.2.6. Sauces and Condiments
- 7.2.7. Others
- 7.1. Market Analysis, Insights and Forecast - by Product Type
- 8. Asia Pacific Food Colorants Industry Analysis, Insights and Forecast, 2019-2031
- 8.1. Market Analysis, Insights and Forecast - by Product Type
- 8.1.1. Natural Color
- 8.1.2. Synthetic Color
- 8.2. Market Analysis, Insights and Forecast - by Application
- 8.2.1. Beverages
- 8.2.2. Dairy & Frozen Products
- 8.2.3. Bakery
- 8.2.4. Meat, Poultry and Seafood
- 8.2.5. Confectionery
- 8.2.6. Sauces and Condiments
- 8.2.7. Others
- 8.1. Market Analysis, Insights and Forecast - by Product Type
- 9. South America Food Colorants Industry Analysis, Insights and Forecast, 2019-2031
- 9.1. Market Analysis, Insights and Forecast - by Product Type
- 9.1.1. Natural Color
- 9.1.2. Synthetic Color
- 9.2. Market Analysis, Insights and Forecast - by Application
- 9.2.1. Beverages
- 9.2.2. Dairy & Frozen Products
- 9.2.3. Bakery
- 9.2.4. Meat, Poultry and Seafood
- 9.2.5. Confectionery
- 9.2.6. Sauces and Condiments
- 9.2.7. Others
- 9.1. Market Analysis, Insights and Forecast - by Product Type
- 10. Middle East and Africa Food Colorants Industry Analysis, Insights and Forecast, 2019-2031
- 10.1. Market Analysis, Insights and Forecast - by Product Type
- 10.1.1. Natural Color
- 10.1.2. Synthetic Color
- 10.2. Market Analysis, Insights and Forecast - by Application
- 10.2.1. Beverages
- 10.2.2. Dairy & Frozen Products
- 10.2.3. Bakery
- 10.2.4. Meat, Poultry and Seafood
- 10.2.5. Confectionery
- 10.2.6. Sauces and Condiments
- 10.2.7. Others
- 10.1. Market Analysis, Insights and Forecast - by Product Type
- 11. North America Food Colorants Industry Analysis, Insights and Forecast, 2019-2031
- 11.1. Market Analysis, Insights and Forecast - By Country/Sub-region
- 11.1.1 United States
- 11.1.2 Canada
- 11.1.3 Mexico
- 11.1.4 Rest of North America
- 12. Europe Food Colorants Industry Analysis, Insights and Forecast, 2019-2031
- 12.1. Market Analysis, Insights and Forecast - By Country/Sub-region
- 12.1.1 Germany
- 12.1.2 United Kingdom
- 12.1.3 France
- 12.1.4 Italy
- 12.1.5 Russia
- 12.1.6 Spain
- 12.1.7 Rest of Europe
- 13. Asia Pacific Food Colorants Industry Analysis, Insights and Forecast, 2019-2031
- 13.1. Market Analysis, Insights and Forecast - By Country/Sub-region
- 13.1.1 India
- 13.1.2 China
- 13.1.3 Australia
- 13.1.4 Japan
- 13.1.5 Rest of Asia Pacific
- 14. South America Food Colorants Industry Analysis, Insights and Forecast, 2019-2031
- 14.1. Market Analysis, Insights and Forecast - By Country/Sub-region
- 14.1.1 Brazil
- 14.1.2 Argentina
- 14.1.3 Rest of South America
- 15. Middle East and Africa Food Colorants Industry Analysis, Insights and Forecast, 2019-2031
- 15.1. Market Analysis, Insights and Forecast - By Country/Sub-region
- 15.1.1 United Arab Emirates
- 15.1.2 South Africa
- 15.1.3 Rest of Middle East and Africa
- 16. Competitive Analysis
- 16.1. Global Market Share Analysis 2024
- 16.2. Company Profiles
- 16.2.1 Naturex SA
- 16.2.1.1. Overview
- 16.2.1.2. Products
- 16.2.1.3. SWOT Analysis
- 16.2.1.4. Recent Developments
- 16.2.1.5. Financials (Based on Availability)
- 16.2.2 Fiorio Colori S P A
- 16.2.2.1. Overview
- 16.2.2.2. Products
- 16.2.2.3. SWOT Analysis
- 16.2.2.4. Recent Developments
- 16.2.2.5. Financials (Based on Availability)
- 16.2.3 GNT Group
- 16.2.3.1. Overview
- 16.2.3.2. Products
- 16.2.3.3. SWOT Analysis
- 16.2.3.4. Recent Developments
- 16.2.3.5. Financials (Based on Availability)
- 16.2.4 BASF SE
- 16.2.4.1. Overview
- 16.2.4.2. Products
- 16.2.4.3. SWOT Analysis
- 16.2.4.4. Recent Developments
- 16.2.4.5. Financials (Based on Availability)
- 16.2.5 Koninklijke DSM N V
- 16.2.5.1. Overview
- 16.2.5.2. Products
- 16.2.5.3. SWOT Analysis
- 16.2.5.4. Recent Developments
- 16.2.5.5. Financials (Based on Availability)
- 16.2.6 D D Williamson & Co
- 16.2.6.1. Overview
- 16.2.6.2. Products
- 16.2.6.3. SWOT Analysis
- 16.2.6.4. Recent Developments
- 16.2.6.5. Financials (Based on Availability)
- 16.2.7 Likored*List Not Exhaustive
- 16.2.7.1. Overview
- 16.2.7.2. Products
- 16.2.7.3. SWOT Analysis
- 16.2.7.4. Recent Developments
- 16.2.7.5. Financials (Based on Availability)
- 16.2.8 Chr Hansen holdings
- 16.2.8.1. Overview
- 16.2.8.2. Products
- 16.2.8.3. SWOT Analysis
- 16.2.8.4. Recent Developments
- 16.2.8.5. Financials (Based on Availability)
- 16.2.9 Dohler group
- 16.2.9.1. Overview
- 16.2.9.2. Products
- 16.2.9.3. SWOT Analysis
- 16.2.9.4. Recent Developments
- 16.2.9.5. Financials (Based on Availability)
- 16.2.10 Sensient technologies Corporation
- 16.2.10.1. Overview
- 16.2.10.2. Products
- 16.2.10.3. SWOT Analysis
- 16.2.10.4. Recent Developments
- 16.2.10.5. Financials (Based on Availability)
- 16.2.1 Naturex SA
List of Figures
- Figure 1: Global Food Colorants Industry Revenue Breakdown (Million, %) by Region 2024 & 2032
- Figure 2: North America Food Colorants Industry Revenue (Million), by Country 2024 & 2032
- Figure 3: North America Food Colorants Industry Revenue Share (%), by Country 2024 & 2032
- Figure 4: Europe Food Colorants Industry Revenue (Million), by Country 2024 & 2032
- Figure 5: Europe Food Colorants Industry Revenue Share (%), by Country 2024 & 2032
- Figure 6: Asia Pacific Food Colorants Industry Revenue (Million), by Country 2024 & 2032
- Figure 7: Asia Pacific Food Colorants Industry Revenue Share (%), by Country 2024 & 2032
- Figure 8: South America Food Colorants Industry Revenue (Million), by Country 2024 & 2032
- Figure 9: South America Food Colorants Industry Revenue Share (%), by Country 2024 & 2032
- Figure 10: Middle East and Africa Food Colorants Industry Revenue (Million), by Country 2024 & 2032
- Figure 11: Middle East and Africa Food Colorants Industry Revenue Share (%), by Country 2024 & 2032
- Figure 12: North America Food Colorants Industry Revenue (Million), by Product Type 2024 & 2032
- Figure 13: North America Food Colorants Industry Revenue Share (%), by Product Type 2024 & 2032
- Figure 14: North America Food Colorants Industry Revenue (Million), by Application 2024 & 2032
- Figure 15: North America Food Colorants Industry Revenue Share (%), by Application 2024 & 2032
- Figure 16: North America Food Colorants Industry Revenue (Million), by Country 2024 & 2032
- Figure 17: North America Food Colorants Industry Revenue Share (%), by Country 2024 & 2032
- Figure 18: Europe Food Colorants Industry Revenue (Million), by Product Type 2024 & 2032
- Figure 19: Europe Food Colorants Industry Revenue Share (%), by Product Type 2024 & 2032
- Figure 20: Europe Food Colorants Industry Revenue (Million), by Application 2024 & 2032
- Figure 21: Europe Food Colorants Industry Revenue Share (%), by Application 2024 & 2032
- Figure 22: Europe Food Colorants Industry Revenue (Million), by Country 2024 & 2032
- Figure 23: Europe Food Colorants Industry Revenue Share (%), by Country 2024 & 2032
- Figure 24: Asia Pacific Food Colorants Industry Revenue (Million), by Product Type 2024 & 2032
- Figure 25: Asia Pacific Food Colorants Industry Revenue Share (%), by Product Type 2024 & 2032
- Figure 26: Asia Pacific Food Colorants Industry Revenue (Million), by Application 2024 & 2032
- Figure 27: Asia Pacific Food Colorants Industry Revenue Share (%), by Application 2024 & 2032
- Figure 28: Asia Pacific Food Colorants Industry Revenue (Million), by Country 2024 & 2032
- Figure 29: Asia Pacific Food Colorants Industry Revenue Share (%), by Country 2024 & 2032
- Figure 30: South America Food Colorants Industry Revenue (Million), by Product Type 2024 & 2032
- Figure 31: South America Food Colorants Industry Revenue Share (%), by Product Type 2024 & 2032
- Figure 32: South America Food Colorants Industry Revenue (Million), by Application 2024 & 2032
- Figure 33: South America Food Colorants Industry Revenue Share (%), by Application 2024 & 2032
- Figure 34: South America Food Colorants Industry Revenue (Million), by Country 2024 & 2032
- Figure 35: South America Food Colorants Industry Revenue Share (%), by Country 2024 & 2032
- Figure 36: Middle East and Africa Food Colorants Industry Revenue (Million), by Product Type 2024 & 2032
- Figure 37: Middle East and Africa Food Colorants Industry Revenue Share (%), by Product Type 2024 & 2032
- Figure 38: Middle East and Africa Food Colorants Industry Revenue (Million), by Application 2024 & 2032
- Figure 39: Middle East and Africa Food Colorants Industry Revenue Share (%), by Application 2024 & 2032
- Figure 40: Middle East and Africa Food Colorants Industry Revenue (Million), by Country 2024 & 2032
- Figure 41: Middle East and Africa Food Colorants Industry Revenue Share (%), by Country 2024 & 2032
List of Tables
- Table 1: Global Food Colorants Industry Revenue Million Forecast, by Region 2019 & 2032
- Table 2: Global Food Colorants Industry Revenue Million Forecast, by Product Type 2019 & 2032
- Table 3: Global Food Colorants Industry Revenue Million Forecast, by Application 2019 & 2032
- Table 4: Global Food Colorants Industry Revenue Million Forecast, by Region 2019 & 2032
- Table 5: Global Food Colorants Industry Revenue Million Forecast, by Country 2019 & 2032
- Table 6: United States Food Colorants Industry Revenue (Million) Forecast, by Application 2019 & 2032
- Table 7: Canada Food Colorants Industry Revenue (Million) Forecast, by Application 2019 & 2032
- Table 8: Mexico Food Colorants Industry Revenue (Million) Forecast, by Application 2019 & 2032
- Table 9: Rest of North America Food Colorants Industry Revenue (Million) Forecast, by Application 2019 & 2032
- Table 10: Global Food Colorants Industry Revenue Million Forecast, by Country 2019 & 2032
- Table 11: Germany Food Colorants Industry Revenue (Million) Forecast, by Application 2019 & 2032
- Table 12: United Kingdom Food Colorants Industry Revenue (Million) Forecast, by Application 2019 & 2032
- Table 13: France Food Colorants Industry Revenue (Million) Forecast, by Application 2019 & 2032
- Table 14: Italy Food Colorants Industry Revenue (Million) Forecast, by Application 2019 & 2032
- Table 15: Russia Food Colorants Industry Revenue (Million) Forecast, by Application 2019 & 2032
- Table 16: Spain Food Colorants Industry Revenue (Million) Forecast, by Application 2019 & 2032
- Table 17: Rest of Europe Food Colorants Industry Revenue (Million) Forecast, by Application 2019 & 2032
- Table 18: Global Food Colorants Industry Revenue Million Forecast, by Country 2019 & 2032
- Table 19: India Food Colorants Industry Revenue (Million) Forecast, by Application 2019 & 2032
- Table 20: China Food Colorants Industry Revenue (Million) Forecast, by Application 2019 & 2032
- Table 21: Australia Food Colorants Industry Revenue (Million) Forecast, by Application 2019 & 2032
- Table 22: Japan Food Colorants Industry Revenue (Million) Forecast, by Application 2019 & 2032
- Table 23: Rest of Asia Pacific Food Colorants Industry Revenue (Million) Forecast, by Application 2019 & 2032
- Table 24: Global Food Colorants Industry Revenue Million Forecast, by Country 2019 & 2032
- Table 25: Brazil Food Colorants Industry Revenue (Million) Forecast, by Application 2019 & 2032
- Table 26: Argentina Food Colorants Industry Revenue (Million) Forecast, by Application 2019 & 2032
- Table 27: Rest of South America Food Colorants Industry Revenue (Million) Forecast, by Application 2019 & 2032
- Table 28: Global Food Colorants Industry Revenue Million Forecast, by Country 2019 & 2032
- Table 29: United Arab Emirates Food Colorants Industry Revenue (Million) Forecast, by Application 2019 & 2032
- Table 30: South Africa Food Colorants Industry Revenue (Million) Forecast, by Application 2019 & 2032
- Table 31: Rest of Middle East and Africa Food Colorants Industry Revenue (Million) Forecast, by Application 2019 & 2032
- Table 32: Global Food Colorants Industry Revenue Million Forecast, by Product Type 2019 & 2032
- Table 33: Global Food Colorants Industry Revenue Million Forecast, by Application 2019 & 2032
- Table 34: Global Food Colorants Industry Revenue Million Forecast, by Country 2019 & 2032
- Table 35: United States Food Colorants Industry Revenue (Million) Forecast, by Application 2019 & 2032
- Table 36: Canada Food Colorants Industry Revenue (Million) Forecast, by Application 2019 & 2032
- Table 37: Mexico Food Colorants Industry Revenue (Million) Forecast, by Application 2019 & 2032
- Table 38: Rest of North America Food Colorants Industry Revenue (Million) Forecast, by Application 2019 & 2032
- Table 39: Global Food Colorants Industry Revenue Million Forecast, by Product Type 2019 & 2032
- Table 40: Global Food Colorants Industry Revenue Million Forecast, by Application 2019 & 2032
- Table 41: Global Food Colorants Industry Revenue Million Forecast, by Country 2019 & 2032
- Table 42: Germany Food Colorants Industry Revenue (Million) Forecast, by Application 2019 & 2032
- Table 43: United Kingdom Food Colorants Industry Revenue (Million) Forecast, by Application 2019 & 2032
- Table 44: France Food Colorants Industry Revenue (Million) Forecast, by Application 2019 & 2032
- Table 45: Italy Food Colorants Industry Revenue (Million) Forecast, by Application 2019 & 2032
- Table 46: Russia Food Colorants Industry Revenue (Million) Forecast, by Application 2019 & 2032
- Table 47: Spain Food Colorants Industry Revenue (Million) Forecast, by Application 2019 & 2032
- Table 48: Rest of Europe Food Colorants Industry Revenue (Million) Forecast, by Application 2019 & 2032
- Table 49: Global Food Colorants Industry Revenue Million Forecast, by Product Type 2019 & 2032
- Table 50: Global Food Colorants Industry Revenue Million Forecast, by Application 2019 & 2032
- Table 51: Global Food Colorants Industry Revenue Million Forecast, by Country 2019 & 2032
- Table 52: India Food Colorants Industry Revenue (Million) Forecast, by Application 2019 & 2032
- Table 53: China Food Colorants Industry Revenue (Million) Forecast, by Application 2019 & 2032
- Table 54: Australia Food Colorants Industry Revenue (Million) Forecast, by Application 2019 & 2032
- Table 55: Japan Food Colorants Industry Revenue (Million) Forecast, by Application 2019 & 2032
- Table 56: Rest of Asia Pacific Food Colorants Industry Revenue (Million) Forecast, by Application 2019 & 2032
- Table 57: Global Food Colorants Industry Revenue Million Forecast, by Product Type 2019 & 2032
- Table 58: Global Food Colorants Industry Revenue Million Forecast, by Application 2019 & 2032
- Table 59: Global Food Colorants Industry Revenue Million Forecast, by Country 2019 & 2032
- Table 60: Brazil Food Colorants Industry Revenue (Million) Forecast, by Application 2019 & 2032
- Table 61: Argentina Food Colorants Industry Revenue (Million) Forecast, by Application 2019 & 2032
- Table 62: Rest of South America Food Colorants Industry Revenue (Million) Forecast, by Application 2019 & 2032
- Table 63: Global Food Colorants Industry Revenue Million Forecast, by Product Type 2019 & 2032
- Table 64: Global Food Colorants Industry Revenue Million Forecast, by Application 2019 & 2032
- Table 65: Global Food Colorants Industry Revenue Million Forecast, by Country 2019 & 2032
- Table 66: United Arab Emirates Food Colorants Industry Revenue (Million) Forecast, by Application 2019 & 2032
- Table 67: South Africa Food Colorants Industry Revenue (Million) Forecast, by Application 2019 & 2032
- Table 68: Rest of Middle East and Africa Food Colorants Industry Revenue (Million) Forecast, by Application 2019 & 2032
Frequently Asked Questions
1. What is the projected Compound Annual Growth Rate (CAGR) of the Food Colorants Industry?
The projected CAGR is approximately 4.80%.
2. Which companies are prominent players in the Food Colorants Industry?
Key companies in the market include Naturex SA, Fiorio Colori S P A, GNT Group, BASF SE, Koninklijke DSM N V, D D Williamson & Co, Likored*List Not Exhaustive, Chr Hansen holdings, Dohler group, Sensient technologies Corporation.
3. What are the main segments of the Food Colorants Industry?
The market segments include Product Type, Application.
4. Can you provide details about the market size?
The market size is estimated to be USD XX Million as of 2022.
5. What are some drivers contributing to market growth?
Rising Health Consciousness among consumer.
6. What are the notable trends driving market growth?
Increasing Demand For Natural Food Colorants.
7. Are there any restraints impacting market growth?
High Cost of natural Ingredients.
8. Can you provide examples of recent developments in the market?
In January 2021, GNT Group added a new pink shade coloring agent under its EXBERRY® brand with the name EXBERRY® Shade Pink - OD, which is developed for use in fat-based applications. It is also available in red, yellow, orange, blue, and green variants.
9. What pricing options are available for accessing the report?
Pricing options include single-user, multi-user, and enterprise licenses priced at USD 4750, USD 5250, and USD 8750 respectively.
10. Is the market size provided in terms of value or volume?
The market size is provided in terms of value, measured in Million.
11. Are there any specific market keywords associated with the report?
Yes, the market keyword associated with the report is "Food Colorants Industry," which aids in identifying and referencing the specific market segment covered.
12. How do I determine which pricing option suits my needs best?
The pricing options vary based on user requirements and access needs. Individual users may opt for single-user licenses, while businesses requiring broader access may choose multi-user or enterprise licenses for cost-effective access to the report.
13. Are there any additional resources or data provided in the Food Colorants Industry report?
While the report offers comprehensive insights, it's advisable to review the specific contents or supplementary materials provided to ascertain if additional resources or data are available.
14. How can I stay updated on further developments or reports in the Food Colorants Industry?
To stay informed about further developments, trends, and reports in the Food Colorants Industry, consider subscribing to industry newsletters, following relevant companies and organizations, or regularly checking reputable industry news sources and publications.
Methodology
Step 1 - Identification of Relevant Samples Size from Population Database


Step 2 - Approaches for Defining Global Market Size (Value, Volume* & Price*)

Note*: In applicable scenarios
Step 3 - Data Sources
Primary Research
- Web Analytics
- Survey Reports
- Research Institute
- Latest Research Reports
- Opinion Leaders
Secondary Research
- Annual Reports
- White Paper
- Latest Press Release
- Industry Association
- Paid Database
- Investor Presentations

Step 4 - Data Triangulation
Involves using different sources of information in order to increase the validity of a study
These sources are likely to be stakeholders in a program - participants, other researchers, program staff, other community members, and so on.
Then we put all data in single framework & apply various statistical tools to find out the dynamic on the market.
During the analysis stage, feedback from the stakeholder groups would be compared to determine areas of agreement as well as areas of divergence


