


Key Insights
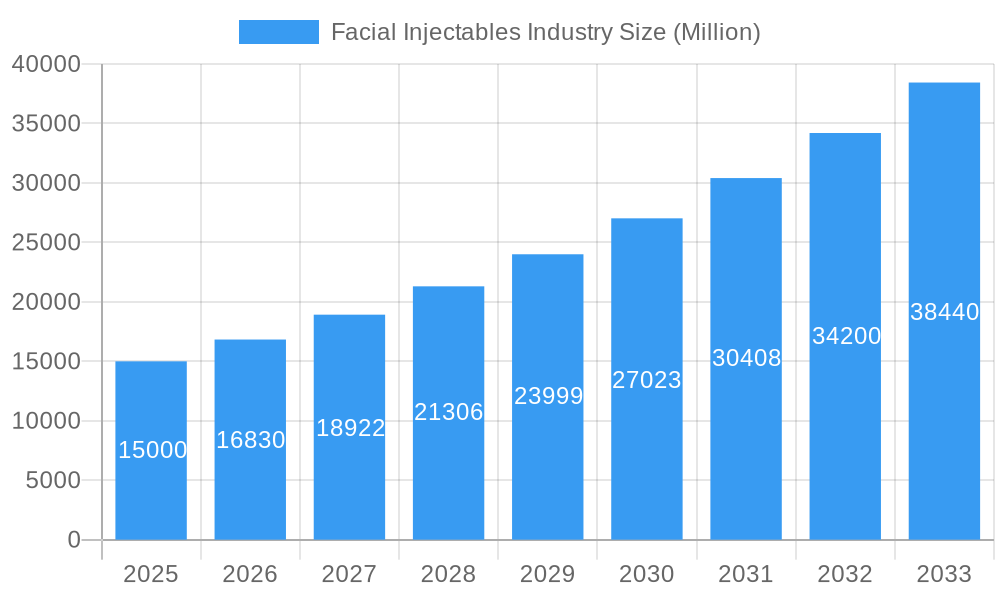
The global facial injectables market, valued at $21.63 billion in 2025, is projected for significant expansion. Expected to grow at a compound annual growth rate (CAGR) of 12.1% from 2025 to 2033, this growth is attributed to increasing demand for aesthetic procedures, driven by rising age-related concerns, growing disposable incomes, and heightened awareness of non-invasive cosmetic treatments. Technological advancements are enhancing the safety and efficacy of injectables, supported by the expanding expertise of medical professionals. Wrinkle relaxers, particularly botulinum toxin, lead market share due to their effectiveness in correcting facial lines and established safety. Dermal fillers, used for lip augmentation, facelifts, and scar treatment, also show strong growth, propelled by the increasing acceptance of minimally invasive options. North America and Europe currently lead the market, with the Asia-Pacific region anticipated for rapid expansion due to rising awareness and disposable incomes in key economies. Potential side effects and regulatory approvals remain considerations, but the market's overall outlook is positive.
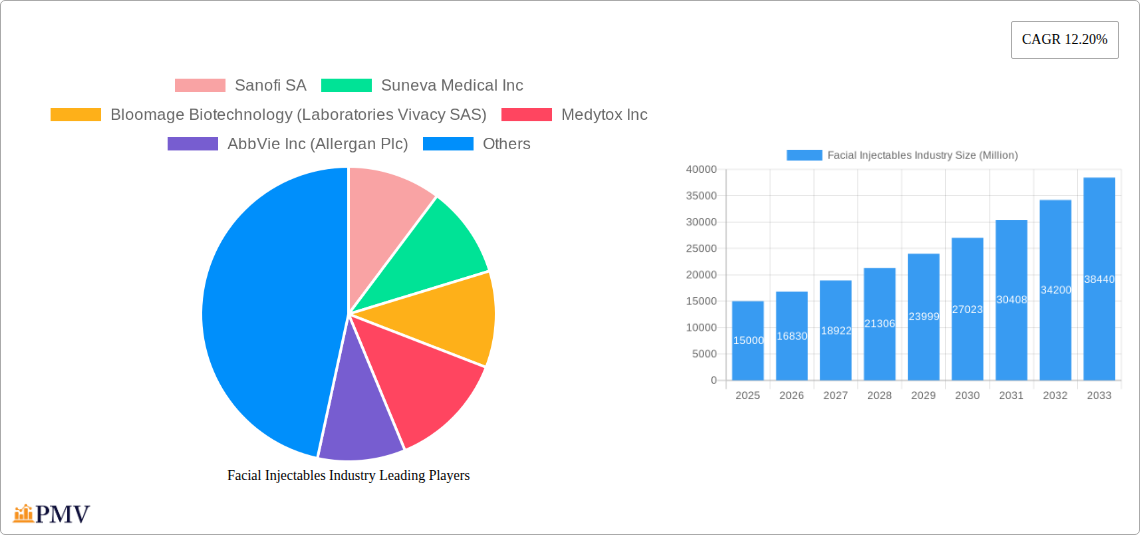
Facial Injectables Industry Market Size (In Billion)

The competitive environment features established pharmaceutical and specialized aesthetic companies. Key players are actively engaged in research and development to introduce innovative products and broaden market reach. Smaller firms are focusing on niche applications and tailored solutions. Strategic partnerships and acquisitions are expected to influence market dynamics, enabling companies to strengthen product portfolios and global presence. Future growth will be driven by next-generation injectables with improved performance and safety, alongside increasing adoption in emerging markets and expansion into new medical applications beyond aesthetics.
Facial Injectables Industry Company Market Share
Global Facial Injectables Market Analysis: 2025-2033
This comprehensive report details the global facial injectables market from 2019 to 2033, offering crucial insights into market size, growth catalysts, competitive strategies, and future projections. The analysis employs a robust methodology, utilizing historical data (2019-2024), a 2025 base year, and a forecast period of 2025-2033. Key industry leaders, including Sanofi SA, AbbVie Inc (Allergan Plc), and Merz Pharma, are extensively reviewed. Detailed segmentation by type (Wrinkle Relaxers, Botulinum Toxin, Dermal Fillers) and application (Facial Line Correction, Lip Augmentation, Face Lift) provides a granular market perspective. The market is projected to exceed $XX billion by 2033.
Facial Injectables Industry Market Structure & Competitive Dynamics
The global facial injectables market exhibits a moderately concentrated structure, with a few major players holding significant market share. However, the presence of numerous smaller companies and emerging players indicates a dynamic competitive environment. Innovation is a key driver, with companies investing heavily in research and development to create novel products and formulations. Regulatory frameworks vary across geographies, influencing market access and product approvals. The market is characterized by several substitutes, including surgical procedures and alternative cosmetic treatments. End-user trends, especially increasing demand for minimally invasive cosmetic procedures, fuel market growth. Mergers and acquisitions (M&A) activities are common, with deal values reaching xx Million in recent years. Key M&A activities include [Specific example if available, otherwise state "Further details are provided within the report"]. This competitive landscape results in a constant evolution of market share, with some companies experiencing growth exceeding xx% while others face challenges maintaining their position.
Facial Injectables Industry Industry Trends & Insights
The facial injectables market is experiencing robust growth, driven by rising disposable incomes, increasing awareness of aesthetic procedures, and a growing preference for minimally invasive options. The market's Compound Annual Growth Rate (CAGR) during the forecast period (2025-2033) is projected at xx%, exceeding the global average for similar industries. Technological advancements, such as the development of longer-lasting and more effective formulations, are contributing to market expansion. Consumer preferences are shifting towards natural-looking results, driving innovation in product design and delivery methods. Market penetration is highest in developed regions, with developing markets showing significant growth potential. The competitive dynamics are characterized by intense rivalry, with companies focusing on product differentiation, pricing strategies, and marketing campaigns. The increasing adoption of advanced injectables and the rising awareness of the benefits of these treatments are expected to further fuel the industry's growth in the coming years, with specific segments exhibiting even higher growth rates.
Dominant Markets & Segments in Facial Injectables Industry
The North American region currently dominates the global facial injectables market, driven by high disposable incomes, advanced healthcare infrastructure, and a strong preference for cosmetic procedures. Within specific segments:
Wrinkle Relaxers: This segment holds the largest market share, driven by the high efficacy of botulinum toxin in treating wrinkles and lines. Key drivers include:
- High consumer demand for non-surgical wrinkle reduction
- Increasing awareness of the safety and effectiveness of these treatments
- Growing availability of technologically advanced wrinkle relaxers
Dermal Fillers: This segment is experiencing significant growth, driven by increasing acceptance of facial volumization procedures. Key drivers include:
- The rising popularity of lip augmentation and facial contouring
- The advancement of hyaluronic acid based fillers
- Effective marketing campaigns emphasizing the benefits of dermal fillers
Applications: Facial line correction consistently maintains the largest share within application segments, followed by lip augmentation. However, other applications, such as acne scar treatment and lipoatrophy treatment, are rapidly growing due to increasing awareness and the development of specialized products. Economic factors such as disposable income and healthcare spending directly correlate with market size and growth in each region.
Further regional and segmental details are outlined in the full report.
Facial Injectables Industry Product Innovations
Recent innovations in the facial injectables industry center on longer-lasting formulations, enhanced efficacy, and improved safety profiles. Advancements in filler technology, including the development of biodegradable and hyaluronic acid-based fillers, are transforming the market. New delivery systems and improved product designs are enhancing patient experience and treatment outcomes. Companies are focusing on developing products that offer natural-looking results, thereby addressing increasing consumer demands for subtle and aesthetically pleasing outcomes. These innovations are directly impacting market competition and driving growth in specific segments.
Report Segmentation & Scope
This report segments the facial injectables market comprehensively, based on:
Type: Wrinkle Relaxers (Botulinum Toxin, others), Dermal Fillers (Hyaluronic acid, collagen, others). Each type is analyzed for market size, growth projections, and competitive landscape. For example, Botulinum Toxin is predicted to hold a significant share driven by its established market presence and widespread acceptance, while other innovative fillers contribute to the segment growth.
Application: Facial line correction, lip augmentation, face lift, acne scar treatment, lipoatrophy treatment, and other applications (including chin augmentation and earlobe rejuvenation). Each application segment is examined for market size, drivers, and challenges. For instance, the acne scar treatment market will observe substantial growth due to increased awareness and improved treatment options.
Key Drivers of Facial Injectables Industry Growth
The growth of the facial injectables industry is fueled by several key factors: the rising prevalence of age-related skin concerns, increasing disposable incomes, and growing awareness of minimally invasive cosmetic treatments. Technological advancements leading to the development of more effective and safer products also contribute to growth. Furthermore, supportive regulatory environments in key markets facilitate market access and industry expansion.
Challenges in the Facial Injectables Industry Sector
The facial injectables industry faces challenges such as stringent regulatory approvals, potential side effects associated with some products, and increasing competition. Supply chain disruptions can impact product availability and pricing. Furthermore, the high cost of treatments and the risk of adverse events might limit market penetration in certain segments. The variability in regulatory frameworks across different geographic regions poses additional hurdles for companies expanding globally.
Leading Players in the Facial Injectables Industry Market
- Sanofi SA
- Suneva Medical Inc
- Bloomage Biotechnology (Laboratories Vivacy SAS)
- Medytox Inc
- AbbVie Inc (Allergan Plc)
- Anika Therapeutics Inc
- Alphaeon Corporation (Teoxane Laboratories)
- Sinclair Pharma Plc
- Ipsen SA
- SciVision Biotech Inc
- Galderma Pharma SA
- Merz Pharma
Key Developments in Facial Injectables Industry Sector
- August 2022: Allergan Healthcare India launched Juvéderm VOLUX, expanding its product portfolio and strengthening its market position in the Indian aesthetic market.
- February 2022: Merz Aesthetics launched Radiesse (+), adding a novel treatment option and potentially disrupting the jawline contouring market.
Strategic Facial Injectables Industry Market Outlook
The future of the facial injectables market looks promising, with continued growth driven by increasing demand, technological innovations, and expanding geographic reach. Strategic opportunities exist in developing new and improved products, expanding into emerging markets, and adopting innovative marketing strategies. The market is poised to witness expansion in diverse applications and increased adoption across age groups and demographics. Focus on personalized medicine and sophisticated treatment plans will also drive growth and innovation in this market.
Facial Injectables Industry Segmentation
-
1. Type
-
1.1. Wrinkle Relaxers
- 1.1.1. Botulinum Toxin
-
1.2. Dermal Fillers
- 1.2.1. Collagen
- 1.2.2. Hyaluronic Acid
- 1.2.3. Fat Injection
- 1.2.4. Polylactic Acid
- 1.2.5. Polymethyl-methacrylate Microspheres (PMMA)
- 1.2.6. Calcium Hydroxylapatite
- 1.2.7. Other Dermal Fillers (Polyalkylimide etc.)
-
1.1. Wrinkle Relaxers
-
2. Application
- 2.1. Facial Line Correction
- 2.2. Lip Augmentation
- 2.3. Face Lift
- 2.4. Acne Scar Treatment
- 2.5. Lipoatrophy Treatment
- 2.6. Other Ap
Facial Injectables Industry Segmentation By Geography
-
1. North America
- 1.1. United States
- 1.2. Canada
- 1.3. Mexico
-
2. Europe
- 2.1. Germany
- 2.2. United Kingdom
- 2.3. France
- 2.4. Italy
- 2.5. Spain
- 2.6. Rest of Europe
-
3. Asia Pacific
- 3.1. China
- 3.2. Japan
- 3.3. India
- 3.4. Australia
- 3.5. South Korea
- 3.6. Rest of Asia Pacific
-
4. Middle East and Africa
- 4.1. GCC
- 4.2. South Africa
- 4.3. Rest of Middle East and Africa
-
5. South America
- 5.1. Brazil
- 5.2. Argentina
- 5.3. Rest of South America
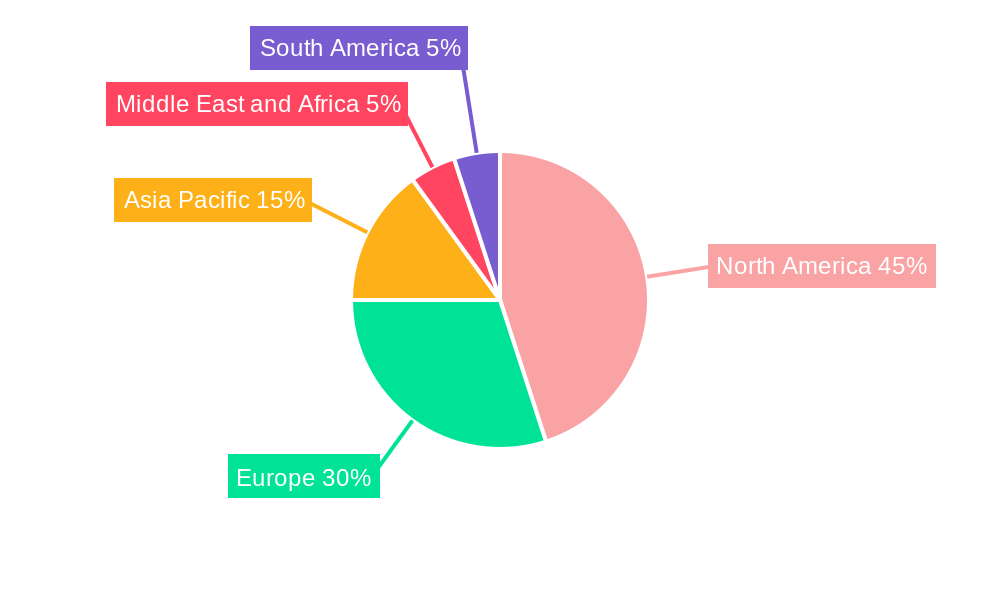
Facial Injectables Industry Regional Market Share
Geographic Coverage of Facial Injectables Industry
Facial Injectables Industry REPORT HIGHLIGHTS
| Aspects | Details |
|---|---|
| Study Period | 2020-2034 |
| Base Year | 2025 |
| Estimated Year | 2026 |
| Forecast Period | 2026-2034 |
| Historical Period | 2020-2025 |
| Growth Rate | CAGR of 12.1% from 2020-2034 |
| Segmentation |
|
Table of Contents
- 1. Introduction
- 1.1. Research Scope
- 1.2. Market Segmentation
- 1.3. Research Methodology
- 1.4. Definitions and Assumptions
- 2. Executive Summary
- 2.1. Introduction
- 3. Market Dynamics
- 3.1. Introduction
- 3.2. Market Drivers
- 3.2.1. Rising Aesthetic Consciousness and Number of Cosmetic Procedures; Introduction of Cost-effective Facial Injectable; Ageing Population
- 3.3. Market Restrains
- 3.3.1. Side-effects of Available Products Limiting Adoption; Lack of Reimbursement Policies Supporting Cosmetic Procedures
- 3.4. Market Trends
- 3.4.1. Hyaluronic Acid Segment is Expected to Hold Significant Share Over the Forecast Period
- 4. Market Factor Analysis
- 4.1. Porters Five Forces
- 4.2. Supply/Value Chain
- 4.3. PESTEL analysis
- 4.4. Market Entropy
- 4.5. Patent/Trademark Analysis
- 5. Global Facial Injectables Industry Analysis, Insights and Forecast, 2020-2032
- 5.1. Market Analysis, Insights and Forecast - by Type
- 5.1.1. Wrinkle Relaxers
- 5.1.1.1. Botulinum Toxin
- 5.1.2. Dermal Fillers
- 5.1.2.1. Collagen
- 5.1.2.2. Hyaluronic Acid
- 5.1.2.3. Fat Injection
- 5.1.2.4. Polylactic Acid
- 5.1.2.5. Polymethyl-methacrylate Microspheres (PMMA)
- 5.1.2.6. Calcium Hydroxylapatite
- 5.1.2.7. Other Dermal Fillers (Polyalkylimide etc.)
- 5.1.1. Wrinkle Relaxers
- 5.2. Market Analysis, Insights and Forecast - by Application
- 5.2.1. Facial Line Correction
- 5.2.2. Lip Augmentation
- 5.2.3. Face Lift
- 5.2.4. Acne Scar Treatment
- 5.2.5. Lipoatrophy Treatment
- 5.2.6. Other Ap
- 5.3. Market Analysis, Insights and Forecast - by Region
- 5.3.1. North America
- 5.3.2. Europe
- 5.3.3. Asia Pacific
- 5.3.4. Middle East and Africa
- 5.3.5. South America
- 5.1. Market Analysis, Insights and Forecast - by Type
- 6. North America Facial Injectables Industry Analysis, Insights and Forecast, 2020-2032
- 6.1. Market Analysis, Insights and Forecast - by Type
- 6.1.1. Wrinkle Relaxers
- 6.1.1.1. Botulinum Toxin
- 6.1.2. Dermal Fillers
- 6.1.2.1. Collagen
- 6.1.2.2. Hyaluronic Acid
- 6.1.2.3. Fat Injection
- 6.1.2.4. Polylactic Acid
- 6.1.2.5. Polymethyl-methacrylate Microspheres (PMMA)
- 6.1.2.6. Calcium Hydroxylapatite
- 6.1.2.7. Other Dermal Fillers (Polyalkylimide etc.)
- 6.1.1. Wrinkle Relaxers
- 6.2. Market Analysis, Insights and Forecast - by Application
- 6.2.1. Facial Line Correction
- 6.2.2. Lip Augmentation
- 6.2.3. Face Lift
- 6.2.4. Acne Scar Treatment
- 6.2.5. Lipoatrophy Treatment
- 6.2.6. Other Ap
- 6.1. Market Analysis, Insights and Forecast - by Type
- 7. Europe Facial Injectables Industry Analysis, Insights and Forecast, 2020-2032
- 7.1. Market Analysis, Insights and Forecast - by Type
- 7.1.1. Wrinkle Relaxers
- 7.1.1.1. Botulinum Toxin
- 7.1.2. Dermal Fillers
- 7.1.2.1. Collagen
- 7.1.2.2. Hyaluronic Acid
- 7.1.2.3. Fat Injection
- 7.1.2.4. Polylactic Acid
- 7.1.2.5. Polymethyl-methacrylate Microspheres (PMMA)
- 7.1.2.6. Calcium Hydroxylapatite
- 7.1.2.7. Other Dermal Fillers (Polyalkylimide etc.)
- 7.1.1. Wrinkle Relaxers
- 7.2. Market Analysis, Insights and Forecast - by Application
- 7.2.1. Facial Line Correction
- 7.2.2. Lip Augmentation
- 7.2.3. Face Lift
- 7.2.4. Acne Scar Treatment
- 7.2.5. Lipoatrophy Treatment
- 7.2.6. Other Ap
- 7.1. Market Analysis, Insights and Forecast - by Type
- 8. Asia Pacific Facial Injectables Industry Analysis, Insights and Forecast, 2020-2032
- 8.1. Market Analysis, Insights and Forecast - by Type
- 8.1.1. Wrinkle Relaxers
- 8.1.1.1. Botulinum Toxin
- 8.1.2. Dermal Fillers
- 8.1.2.1. Collagen
- 8.1.2.2. Hyaluronic Acid
- 8.1.2.3. Fat Injection
- 8.1.2.4. Polylactic Acid
- 8.1.2.5. Polymethyl-methacrylate Microspheres (PMMA)
- 8.1.2.6. Calcium Hydroxylapatite
- 8.1.2.7. Other Dermal Fillers (Polyalkylimide etc.)
- 8.1.1. Wrinkle Relaxers
- 8.2. Market Analysis, Insights and Forecast - by Application
- 8.2.1. Facial Line Correction
- 8.2.2. Lip Augmentation
- 8.2.3. Face Lift
- 8.2.4. Acne Scar Treatment
- 8.2.5. Lipoatrophy Treatment
- 8.2.6. Other Ap
- 8.1. Market Analysis, Insights and Forecast - by Type
- 9. Middle East and Africa Facial Injectables Industry Analysis, Insights and Forecast, 2020-2032
- 9.1. Market Analysis, Insights and Forecast - by Type
- 9.1.1. Wrinkle Relaxers
- 9.1.1.1. Botulinum Toxin
- 9.1.2. Dermal Fillers
- 9.1.2.1. Collagen
- 9.1.2.2. Hyaluronic Acid
- 9.1.2.3. Fat Injection
- 9.1.2.4. Polylactic Acid
- 9.1.2.5. Polymethyl-methacrylate Microspheres (PMMA)
- 9.1.2.6. Calcium Hydroxylapatite
- 9.1.2.7. Other Dermal Fillers (Polyalkylimide etc.)
- 9.1.1. Wrinkle Relaxers
- 9.2. Market Analysis, Insights and Forecast - by Application
- 9.2.1. Facial Line Correction
- 9.2.2. Lip Augmentation
- 9.2.3. Face Lift
- 9.2.4. Acne Scar Treatment
- 9.2.5. Lipoatrophy Treatment
- 9.2.6. Other Ap
- 9.1. Market Analysis, Insights and Forecast - by Type
- 10. South America Facial Injectables Industry Analysis, Insights and Forecast, 2020-2032
- 10.1. Market Analysis, Insights and Forecast - by Type
- 10.1.1. Wrinkle Relaxers
- 10.1.1.1. Botulinum Toxin
- 10.1.2. Dermal Fillers
- 10.1.2.1. Collagen
- 10.1.2.2. Hyaluronic Acid
- 10.1.2.3. Fat Injection
- 10.1.2.4. Polylactic Acid
- 10.1.2.5. Polymethyl-methacrylate Microspheres (PMMA)
- 10.1.2.6. Calcium Hydroxylapatite
- 10.1.2.7. Other Dermal Fillers (Polyalkylimide etc.)
- 10.1.1. Wrinkle Relaxers
- 10.2. Market Analysis, Insights and Forecast - by Application
- 10.2.1. Facial Line Correction
- 10.2.2. Lip Augmentation
- 10.2.3. Face Lift
- 10.2.4. Acne Scar Treatment
- 10.2.5. Lipoatrophy Treatment
- 10.2.6. Other Ap
- 10.1. Market Analysis, Insights and Forecast - by Type
- 11. Competitive Analysis
- 11.1. Global Market Share Analysis 2025
- 11.2. Company Profiles
- 11.2.1 Sanofi SA
- 11.2.1.1. Overview
- 11.2.1.2. Products
- 11.2.1.3. SWOT Analysis
- 11.2.1.4. Recent Developments
- 11.2.1.5. Financials (Based on Availability)
- 11.2.2 Suneva Medical Inc
- 11.2.2.1. Overview
- 11.2.2.2. Products
- 11.2.2.3. SWOT Analysis
- 11.2.2.4. Recent Developments
- 11.2.2.5. Financials (Based on Availability)
- 11.2.3 Bloomage Biotechnology (Laboratories Vivacy SAS)
- 11.2.3.1. Overview
- 11.2.3.2. Products
- 11.2.3.3. SWOT Analysis
- 11.2.3.4. Recent Developments
- 11.2.3.5. Financials (Based on Availability)
- 11.2.4 Medytox Inc
- 11.2.4.1. Overview
- 11.2.4.2. Products
- 11.2.4.3. SWOT Analysis
- 11.2.4.4. Recent Developments
- 11.2.4.5. Financials (Based on Availability)
- 11.2.5 AbbVie Inc (Allergan Plc)
- 11.2.5.1. Overview
- 11.2.5.2. Products
- 11.2.5.3. SWOT Analysis
- 11.2.5.4. Recent Developments
- 11.2.5.5. Financials (Based on Availability)
- 11.2.6 Anika Therapeutics Inc
- 11.2.6.1. Overview
- 11.2.6.2. Products
- 11.2.6.3. SWOT Analysis
- 11.2.6.4. Recent Developments
- 11.2.6.5. Financials (Based on Availability)
- 11.2.7 Alphaeon Corporation (Teoxane Laboratories)
- 11.2.7.1. Overview
- 11.2.7.2. Products
- 11.2.7.3. SWOT Analysis
- 11.2.7.4. Recent Developments
- 11.2.7.5. Financials (Based on Availability)
- 11.2.8 Sinclair Pharma Plc
- 11.2.8.1. Overview
- 11.2.8.2. Products
- 11.2.8.3. SWOT Analysis
- 11.2.8.4. Recent Developments
- 11.2.8.5. Financials (Based on Availability)
- 11.2.9 Ipsen SA
- 11.2.9.1. Overview
- 11.2.9.2. Products
- 11.2.9.3. SWOT Analysis
- 11.2.9.4. Recent Developments
- 11.2.9.5. Financials (Based on Availability)
- 11.2.10 SciVision Biotech Inc
- 11.2.10.1. Overview
- 11.2.10.2. Products
- 11.2.10.3. SWOT Analysis
- 11.2.10.4. Recent Developments
- 11.2.10.5. Financials (Based on Availability)
- 11.2.11 Galderma Pharma SA
- 11.2.11.1. Overview
- 11.2.11.2. Products
- 11.2.11.3. SWOT Analysis
- 11.2.11.4. Recent Developments
- 11.2.11.5. Financials (Based on Availability)
- 11.2.12 Merz Pharma
- 11.2.12.1. Overview
- 11.2.12.2. Products
- 11.2.12.3. SWOT Analysis
- 11.2.12.4. Recent Developments
- 11.2.12.5. Financials (Based on Availability)
- 11.2.1 Sanofi SA
List of Figures
- Figure 1: Global Facial Injectables Industry Revenue Breakdown (billion, %) by Region 2025 & 2033
- Figure 2: Global Facial Injectables Industry Volume Breakdown (K Unit, %) by Region 2025 & 2033
- Figure 3: North America Facial Injectables Industry Revenue (billion), by Type 2025 & 2033
- Figure 4: North America Facial Injectables Industry Volume (K Unit), by Type 2025 & 2033
- Figure 5: North America Facial Injectables Industry Revenue Share (%), by Type 2025 & 2033
- Figure 6: North America Facial Injectables Industry Volume Share (%), by Type 2025 & 2033
- Figure 7: North America Facial Injectables Industry Revenue (billion), by Application 2025 & 2033
- Figure 8: North America Facial Injectables Industry Volume (K Unit), by Application 2025 & 2033
- Figure 9: North America Facial Injectables Industry Revenue Share (%), by Application 2025 & 2033
- Figure 10: North America Facial Injectables Industry Volume Share (%), by Application 2025 & 2033
- Figure 11: North America Facial Injectables Industry Revenue (billion), by Country 2025 & 2033
- Figure 12: North America Facial Injectables Industry Volume (K Unit), by Country 2025 & 2033
- Figure 13: North America Facial Injectables Industry Revenue Share (%), by Country 2025 & 2033
- Figure 14: North America Facial Injectables Industry Volume Share (%), by Country 2025 & 2033
- Figure 15: Europe Facial Injectables Industry Revenue (billion), by Type 2025 & 2033
- Figure 16: Europe Facial Injectables Industry Volume (K Unit), by Type 2025 & 2033
- Figure 17: Europe Facial Injectables Industry Revenue Share (%), by Type 2025 & 2033
- Figure 18: Europe Facial Injectables Industry Volume Share (%), by Type 2025 & 2033
- Figure 19: Europe Facial Injectables Industry Revenue (billion), by Application 2025 & 2033
- Figure 20: Europe Facial Injectables Industry Volume (K Unit), by Application 2025 & 2033
- Figure 21: Europe Facial Injectables Industry Revenue Share (%), by Application 2025 & 2033
- Figure 22: Europe Facial Injectables Industry Volume Share (%), by Application 2025 & 2033
- Figure 23: Europe Facial Injectables Industry Revenue (billion), by Country 2025 & 2033
- Figure 24: Europe Facial Injectables Industry Volume (K Unit), by Country 2025 & 2033
- Figure 25: Europe Facial Injectables Industry Revenue Share (%), by Country 2025 & 2033
- Figure 26: Europe Facial Injectables Industry Volume Share (%), by Country 2025 & 2033
- Figure 27: Asia Pacific Facial Injectables Industry Revenue (billion), by Type 2025 & 2033
- Figure 28: Asia Pacific Facial Injectables Industry Volume (K Unit), by Type 2025 & 2033
- Figure 29: Asia Pacific Facial Injectables Industry Revenue Share (%), by Type 2025 & 2033
- Figure 30: Asia Pacific Facial Injectables Industry Volume Share (%), by Type 2025 & 2033
- Figure 31: Asia Pacific Facial Injectables Industry Revenue (billion), by Application 2025 & 2033
- Figure 32: Asia Pacific Facial Injectables Industry Volume (K Unit), by Application 2025 & 2033
- Figure 33: Asia Pacific Facial Injectables Industry Revenue Share (%), by Application 2025 & 2033
- Figure 34: Asia Pacific Facial Injectables Industry Volume Share (%), by Application 2025 & 2033
- Figure 35: Asia Pacific Facial Injectables Industry Revenue (billion), by Country 2025 & 2033
- Figure 36: Asia Pacific Facial Injectables Industry Volume (K Unit), by Country 2025 & 2033
- Figure 37: Asia Pacific Facial Injectables Industry Revenue Share (%), by Country 2025 & 2033
- Figure 38: Asia Pacific Facial Injectables Industry Volume Share (%), by Country 2025 & 2033
- Figure 39: Middle East and Africa Facial Injectables Industry Revenue (billion), by Type 2025 & 2033
- Figure 40: Middle East and Africa Facial Injectables Industry Volume (K Unit), by Type 2025 & 2033
- Figure 41: Middle East and Africa Facial Injectables Industry Revenue Share (%), by Type 2025 & 2033
- Figure 42: Middle East and Africa Facial Injectables Industry Volume Share (%), by Type 2025 & 2033
- Figure 43: Middle East and Africa Facial Injectables Industry Revenue (billion), by Application 2025 & 2033
- Figure 44: Middle East and Africa Facial Injectables Industry Volume (K Unit), by Application 2025 & 2033
- Figure 45: Middle East and Africa Facial Injectables Industry Revenue Share (%), by Application 2025 & 2033
- Figure 46: Middle East and Africa Facial Injectables Industry Volume Share (%), by Application 2025 & 2033
- Figure 47: Middle East and Africa Facial Injectables Industry Revenue (billion), by Country 2025 & 2033
- Figure 48: Middle East and Africa Facial Injectables Industry Volume (K Unit), by Country 2025 & 2033
- Figure 49: Middle East and Africa Facial Injectables Industry Revenue Share (%), by Country 2025 & 2033
- Figure 50: Middle East and Africa Facial Injectables Industry Volume Share (%), by Country 2025 & 2033
- Figure 51: South America Facial Injectables Industry Revenue (billion), by Type 2025 & 2033
- Figure 52: South America Facial Injectables Industry Volume (K Unit), by Type 2025 & 2033
- Figure 53: South America Facial Injectables Industry Revenue Share (%), by Type 2025 & 2033
- Figure 54: South America Facial Injectables Industry Volume Share (%), by Type 2025 & 2033
- Figure 55: South America Facial Injectables Industry Revenue (billion), by Application 2025 & 2033
- Figure 56: South America Facial Injectables Industry Volume (K Unit), by Application 2025 & 2033
- Figure 57: South America Facial Injectables Industry Revenue Share (%), by Application 2025 & 2033
- Figure 58: South America Facial Injectables Industry Volume Share (%), by Application 2025 & 2033
- Figure 59: South America Facial Injectables Industry Revenue (billion), by Country 2025 & 2033
- Figure 60: South America Facial Injectables Industry Volume (K Unit), by Country 2025 & 2033
- Figure 61: South America Facial Injectables Industry Revenue Share (%), by Country 2025 & 2033
- Figure 62: South America Facial Injectables Industry Volume Share (%), by Country 2025 & 2033
List of Tables
- Table 1: Global Facial Injectables Industry Revenue billion Forecast, by Type 2020 & 2033
- Table 2: Global Facial Injectables Industry Volume K Unit Forecast, by Type 2020 & 2033
- Table 3: Global Facial Injectables Industry Revenue billion Forecast, by Application 2020 & 2033
- Table 4: Global Facial Injectables Industry Volume K Unit Forecast, by Application 2020 & 2033
- Table 5: Global Facial Injectables Industry Revenue billion Forecast, by Region 2020 & 2033
- Table 6: Global Facial Injectables Industry Volume K Unit Forecast, by Region 2020 & 2033
- Table 7: Global Facial Injectables Industry Revenue billion Forecast, by Type 2020 & 2033
- Table 8: Global Facial Injectables Industry Volume K Unit Forecast, by Type 2020 & 2033
- Table 9: Global Facial Injectables Industry Revenue billion Forecast, by Application 2020 & 2033
- Table 10: Global Facial Injectables Industry Volume K Unit Forecast, by Application 2020 & 2033
- Table 11: Global Facial Injectables Industry Revenue billion Forecast, by Country 2020 & 2033
- Table 12: Global Facial Injectables Industry Volume K Unit Forecast, by Country 2020 & 2033
- Table 13: United States Facial Injectables Industry Revenue (billion) Forecast, by Application 2020 & 2033
- Table 14: United States Facial Injectables Industry Volume (K Unit) Forecast, by Application 2020 & 2033
- Table 15: Canada Facial Injectables Industry Revenue (billion) Forecast, by Application 2020 & 2033
- Table 16: Canada Facial Injectables Industry Volume (K Unit) Forecast, by Application 2020 & 2033
- Table 17: Mexico Facial Injectables Industry Revenue (billion) Forecast, by Application 2020 & 2033
- Table 18: Mexico Facial Injectables Industry Volume (K Unit) Forecast, by Application 2020 & 2033
- Table 19: Global Facial Injectables Industry Revenue billion Forecast, by Type 2020 & 2033
- Table 20: Global Facial Injectables Industry Volume K Unit Forecast, by Type 2020 & 2033
- Table 21: Global Facial Injectables Industry Revenue billion Forecast, by Application 2020 & 2033
- Table 22: Global Facial Injectables Industry Volume K Unit Forecast, by Application 2020 & 2033
- Table 23: Global Facial Injectables Industry Revenue billion Forecast, by Country 2020 & 2033
- Table 24: Global Facial Injectables Industry Volume K Unit Forecast, by Country 2020 & 2033
- Table 25: Germany Facial Injectables Industry Revenue (billion) Forecast, by Application 2020 & 2033
- Table 26: Germany Facial Injectables Industry Volume (K Unit) Forecast, by Application 2020 & 2033
- Table 27: United Kingdom Facial Injectables Industry Revenue (billion) Forecast, by Application 2020 & 2033
- Table 28: United Kingdom Facial Injectables Industry Volume (K Unit) Forecast, by Application 2020 & 2033
- Table 29: France Facial Injectables Industry Revenue (billion) Forecast, by Application 2020 & 2033
- Table 30: France Facial Injectables Industry Volume (K Unit) Forecast, by Application 2020 & 2033
- Table 31: Italy Facial Injectables Industry Revenue (billion) Forecast, by Application 2020 & 2033
- Table 32: Italy Facial Injectables Industry Volume (K Unit) Forecast, by Application 2020 & 2033
- Table 33: Spain Facial Injectables Industry Revenue (billion) Forecast, by Application 2020 & 2033
- Table 34: Spain Facial Injectables Industry Volume (K Unit) Forecast, by Application 2020 & 2033
- Table 35: Rest of Europe Facial Injectables Industry Revenue (billion) Forecast, by Application 2020 & 2033
- Table 36: Rest of Europe Facial Injectables Industry Volume (K Unit) Forecast, by Application 2020 & 2033
- Table 37: Global Facial Injectables Industry Revenue billion Forecast, by Type 2020 & 2033
- Table 38: Global Facial Injectables Industry Volume K Unit Forecast, by Type 2020 & 2033
- Table 39: Global Facial Injectables Industry Revenue billion Forecast, by Application 2020 & 2033
- Table 40: Global Facial Injectables Industry Volume K Unit Forecast, by Application 2020 & 2033
- Table 41: Global Facial Injectables Industry Revenue billion Forecast, by Country 2020 & 2033
- Table 42: Global Facial Injectables Industry Volume K Unit Forecast, by Country 2020 & 2033
- Table 43: China Facial Injectables Industry Revenue (billion) Forecast, by Application 2020 & 2033
- Table 44: China Facial Injectables Industry Volume (K Unit) Forecast, by Application 2020 & 2033
- Table 45: Japan Facial Injectables Industry Revenue (billion) Forecast, by Application 2020 & 2033
- Table 46: Japan Facial Injectables Industry Volume (K Unit) Forecast, by Application 2020 & 2033
- Table 47: India Facial Injectables Industry Revenue (billion) Forecast, by Application 2020 & 2033
- Table 48: India Facial Injectables Industry Volume (K Unit) Forecast, by Application 2020 & 2033
- Table 49: Australia Facial Injectables Industry Revenue (billion) Forecast, by Application 2020 & 2033
- Table 50: Australia Facial Injectables Industry Volume (K Unit) Forecast, by Application 2020 & 2033
- Table 51: South Korea Facial Injectables Industry Revenue (billion) Forecast, by Application 2020 & 2033
- Table 52: South Korea Facial Injectables Industry Volume (K Unit) Forecast, by Application 2020 & 2033
- Table 53: Rest of Asia Pacific Facial Injectables Industry Revenue (billion) Forecast, by Application 2020 & 2033
- Table 54: Rest of Asia Pacific Facial Injectables Industry Volume (K Unit) Forecast, by Application 2020 & 2033
- Table 55: Global Facial Injectables Industry Revenue billion Forecast, by Type 2020 & 2033
- Table 56: Global Facial Injectables Industry Volume K Unit Forecast, by Type 2020 & 2033
- Table 57: Global Facial Injectables Industry Revenue billion Forecast, by Application 2020 & 2033
- Table 58: Global Facial Injectables Industry Volume K Unit Forecast, by Application 2020 & 2033
- Table 59: Global Facial Injectables Industry Revenue billion Forecast, by Country 2020 & 2033
- Table 60: Global Facial Injectables Industry Volume K Unit Forecast, by Country 2020 & 2033
- Table 61: GCC Facial Injectables Industry Revenue (billion) Forecast, by Application 2020 & 2033
- Table 62: GCC Facial Injectables Industry Volume (K Unit) Forecast, by Application 2020 & 2033
- Table 63: South Africa Facial Injectables Industry Revenue (billion) Forecast, by Application 2020 & 2033
- Table 64: South Africa Facial Injectables Industry Volume (K Unit) Forecast, by Application 2020 & 2033
- Table 65: Rest of Middle East and Africa Facial Injectables Industry Revenue (billion) Forecast, by Application 2020 & 2033
- Table 66: Rest of Middle East and Africa Facial Injectables Industry Volume (K Unit) Forecast, by Application 2020 & 2033
- Table 67: Global Facial Injectables Industry Revenue billion Forecast, by Type 2020 & 2033
- Table 68: Global Facial Injectables Industry Volume K Unit Forecast, by Type 2020 & 2033
- Table 69: Global Facial Injectables Industry Revenue billion Forecast, by Application 2020 & 2033
- Table 70: Global Facial Injectables Industry Volume K Unit Forecast, by Application 2020 & 2033
- Table 71: Global Facial Injectables Industry Revenue billion Forecast, by Country 2020 & 2033
- Table 72: Global Facial Injectables Industry Volume K Unit Forecast, by Country 2020 & 2033
- Table 73: Brazil Facial Injectables Industry Revenue (billion) Forecast, by Application 2020 & 2033
- Table 74: Brazil Facial Injectables Industry Volume (K Unit) Forecast, by Application 2020 & 2033
- Table 75: Argentina Facial Injectables Industry Revenue (billion) Forecast, by Application 2020 & 2033
- Table 76: Argentina Facial Injectables Industry Volume (K Unit) Forecast, by Application 2020 & 2033
- Table 77: Rest of South America Facial Injectables Industry Revenue (billion) Forecast, by Application 2020 & 2033
- Table 78: Rest of South America Facial Injectables Industry Volume (K Unit) Forecast, by Application 2020 & 2033
Frequently Asked Questions
1. What is the projected Compound Annual Growth Rate (CAGR) of the Facial Injectables Industry?
The projected CAGR is approximately 12.1%.
2. Which companies are prominent players in the Facial Injectables Industry?
Key companies in the market include Sanofi SA, Suneva Medical Inc, Bloomage Biotechnology (Laboratories Vivacy SAS), Medytox Inc, AbbVie Inc (Allergan Plc), Anika Therapeutics Inc, Alphaeon Corporation (Teoxane Laboratories), Sinclair Pharma Plc, Ipsen SA, SciVision Biotech Inc , Galderma Pharma SA, Merz Pharma.
3. What are the main segments of the Facial Injectables Industry?
The market segments include Type, Application.
4. Can you provide details about the market size?
The market size is estimated to be USD 21.63 billion as of 2022.
5. What are some drivers contributing to market growth?
Rising Aesthetic Consciousness and Number of Cosmetic Procedures; Introduction of Cost-effective Facial Injectable; Ageing Population.
6. What are the notable trends driving market growth?
Hyaluronic Acid Segment is Expected to Hold Significant Share Over the Forecast Period.
7. Are there any restraints impacting market growth?
Side-effects of Available Products Limiting Adoption; Lack of Reimbursement Policies Supporting Cosmetic Procedures.
8. Can you provide examples of recent developments in the market?
August 2022: Allergan Healthcare India launched Juvéderm VOLUX, an injectable implant intended to restore and create the volume of the face, under its Business Unit of Allergan Aesthetics.
9. What pricing options are available for accessing the report?
Pricing options include single-user, multi-user, and enterprise licenses priced at USD 4750, USD 5250, and USD 8750 respectively.
10. Is the market size provided in terms of value or volume?
The market size is provided in terms of value, measured in billion and volume, measured in K Unit.
11. Are there any specific market keywords associated with the report?
Yes, the market keyword associated with the report is "Facial Injectables Industry," which aids in identifying and referencing the specific market segment covered.
12. How do I determine which pricing option suits my needs best?
The pricing options vary based on user requirements and access needs. Individual users may opt for single-user licenses, while businesses requiring broader access may choose multi-user or enterprise licenses for cost-effective access to the report.
13. Are there any additional resources or data provided in the Facial Injectables Industry report?
While the report offers comprehensive insights, it's advisable to review the specific contents or supplementary materials provided to ascertain if additional resources or data are available.
14. How can I stay updated on further developments or reports in the Facial Injectables Industry?
To stay informed about further developments, trends, and reports in the Facial Injectables Industry, consider subscribing to industry newsletters, following relevant companies and organizations, or regularly checking reputable industry news sources and publications.
Methodology
Step 1 - Identification of Relevant Samples Size from Population Database


Step 2 - Approaches for Defining Global Market Size (Value, Volume* & Price*)

Note*: In applicable scenarios
Step 3 - Data Sources
Primary Research
- Web Analytics
- Survey Reports
- Research Institute
- Latest Research Reports
- Opinion Leaders
Secondary Research
- Annual Reports
- White Paper
- Latest Press Release
- Industry Association
- Paid Database
- Investor Presentations

Step 4 - Data Triangulation
Involves using different sources of information in order to increase the validity of a study
These sources are likely to be stakeholders in a program - participants, other researchers, program staff, other community members, and so on.
Then we put all data in single framework & apply various statistical tools to find out the dynamic on the market.
During the analysis stage, feedback from the stakeholder groups would be compared to determine areas of agreement as well as areas of divergence