
Key Insights
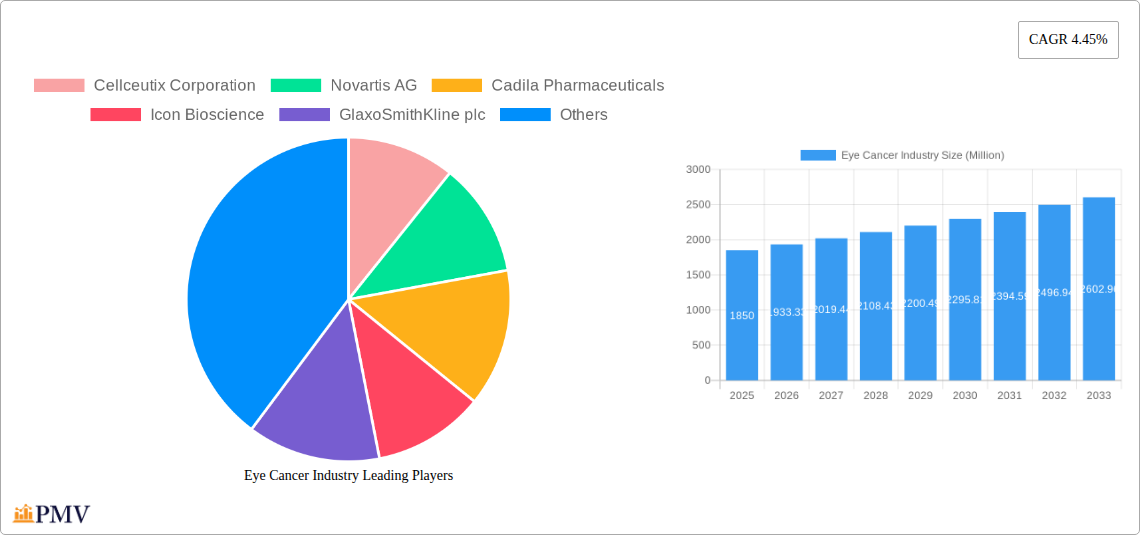
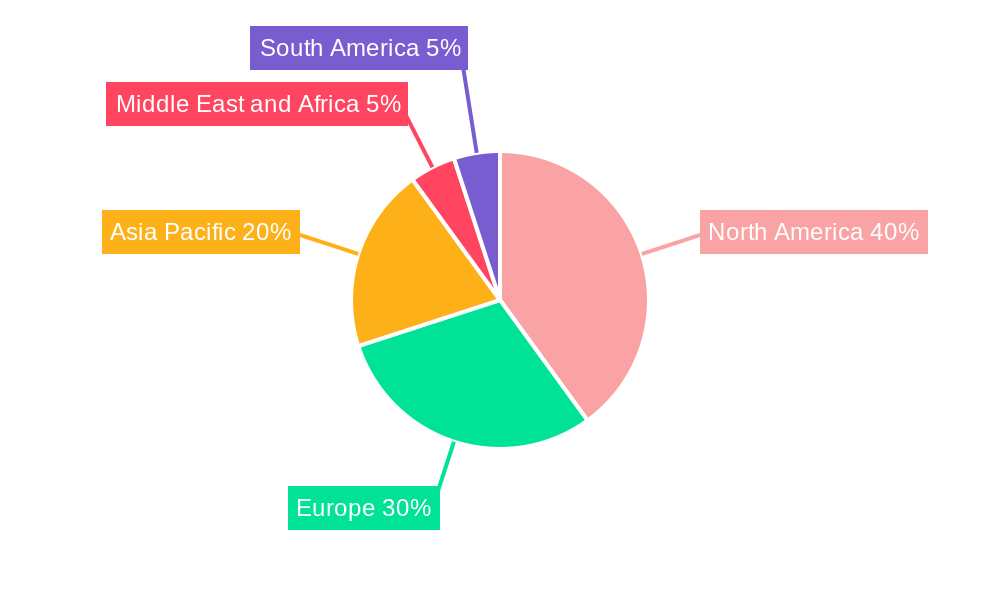
The global eye cancer market, currently valued at approximately $1.85 billion in 2025, is projected to experience robust growth, exhibiting a Compound Annual Growth Rate (CAGR) of 4.45% from 2025 to 2033. This expansion is driven by several key factors. Increasing prevalence of retinoblastoma, particularly in developing nations with limited access to early diagnosis and treatment, significantly fuels market growth. Advances in treatment modalities, such as targeted therapies, innovative surgical techniques, and improved radiation therapies, offer enhanced patient outcomes and contribute to market expansion. The rising geriatric population, globally susceptible to increased eye cancer incidence, further boosts market demand. Furthermore, heightened awareness campaigns and improved diagnostic capabilities are facilitating earlier detection and prompt interventions, impacting market size positively. However, the high cost of advanced treatments, particularly novel targeted therapies, presents a significant restraint, limiting accessibility for a substantial portion of the patient population, especially in low- and middle-income countries. Segmentation analysis reveals a significant market share held by retinoblastoma treatments, reflecting its prominence as a major type of eye cancer. The geographical distribution highlights strong growth potential in Asia-Pacific and other emerging markets where the disease burden is high, but access to quality care lags. North America and Europe, due to their well-established healthcare infrastructure and advanced treatment facilities, are expected to retain significant market shares, though growth may be more moderate compared to emerging regions. The competitive landscape is characterized by a mix of large pharmaceutical companies and specialized biotech firms, each contributing to the ongoing innovation and development within the eye cancer treatment space.
The market's future trajectory is influenced by several emerging trends. The development and approval of novel targeted therapies specifically designed to address specific genetic mutations driving eye cancer development hold significant promise for improved treatment efficacy and patient outcomes. Further research into the genetic basis of eye cancer is expected to enhance diagnostic capabilities and pave the way for personalized medicine approaches. Additionally, the increasing adoption of minimally invasive surgical techniques and advanced imaging technologies will likely contribute to better treatment outcomes and improved patient quality of life. However, regulatory hurdles, challenges associated with clinical trial recruitment, and the need for ongoing investment in research and development continue to pose potential challenges to market growth. The strategic partnerships and collaborations between pharmaceutical companies, research institutions, and healthcare providers will play a vital role in overcoming these obstacles and fostering innovation in eye cancer treatment.
Eye Cancer Industry Market Report: 2019-2033
This comprehensive report provides a detailed analysis of the global eye cancer industry, offering invaluable insights for stakeholders, investors, and industry professionals. Covering the period from 2019 to 2033, with a focus on 2025, this report meticulously examines market dynamics, competitive landscapes, and future growth potential, including a market size valuation exceeding xx Million by 2033.
Eye Cancer Industry Market Structure & Competitive Dynamics
The eye cancer market exhibits a moderately concentrated structure, with several multinational pharmaceutical companies holding significant market share. Key players like Novartis AG, GlaxoSmithKline plc, Johnson & Johnson, and Pfizer Inc. dominate the market through their extensive research and development capabilities, robust distribution networks, and established brand reputations. However, smaller, specialized biotech companies like Cellceutix Corporation, Icon Bioscience, and RXi Pharmaceuticals are also actively contributing to innovation, particularly in targeted therapies. The market is characterized by ongoing mergers and acquisitions (M&A) activity, with deal values exceeding xx Million in recent years, primarily driven by the pursuit of innovative technologies and expanded market access. Regulatory frameworks, particularly concerning drug approvals and pricing, significantly influence market dynamics. Product substitution is limited due to the complexity and severity of eye cancers; however, the development of novel therapies is influencing treatment choices. End-user trends show a growing preference for minimally invasive procedures and targeted therapies, placing pressure on companies to adapt their offerings.
- Market Concentration: Moderately concentrated, with a few large players holding significant market share.
- M&A Activity: Significant activity in recent years, exceeding xx Million in deal value.
- Regulatory Landscape: Stringent regulations impact drug development and market entry.
- Product Substitutes: Limited, with a focus on innovation driving treatment choices.
- End-user Trends: Increasing demand for minimally invasive and targeted therapies.
Eye Cancer Industry Trends & Insights
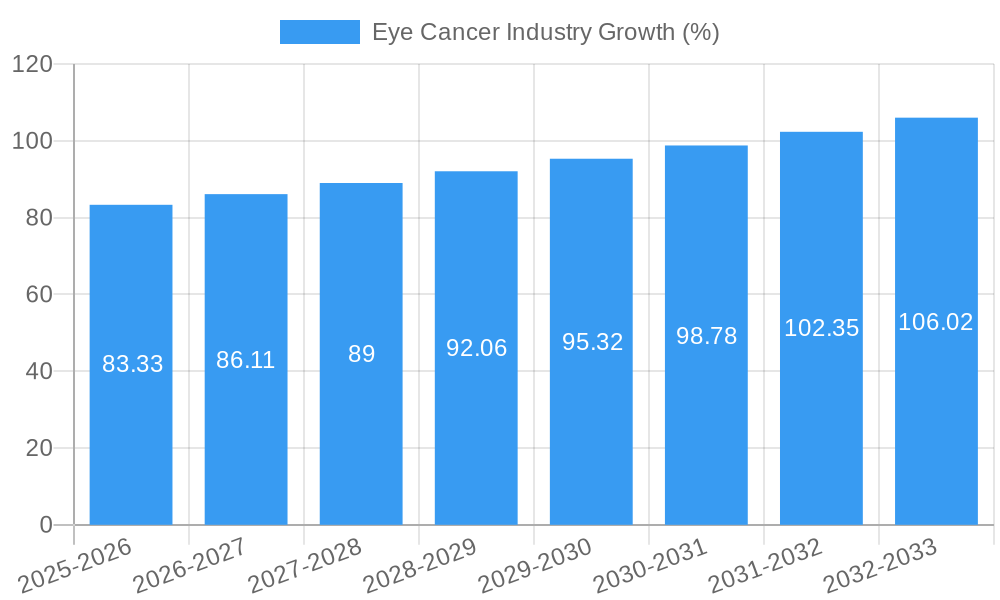
The global eye cancer market is experiencing substantial growth, driven by rising incidence rates, increasing geriatric populations, and advancements in diagnostic and therapeutic technologies. The compound annual growth rate (CAGR) is estimated at xx% during the forecast period (2025-2033). Technological disruptions, including the development of advanced imaging techniques and targeted therapies, significantly contribute to market expansion. Consumer preferences are shifting towards personalized medicine and minimally invasive procedures, influencing the demand for innovative treatment options. Intense competition among established and emerging players further fuels market growth. Market penetration of novel therapies varies depending on the specific eye cancer type and treatment approach, however, the overall market penetration is showing a steady increase.
Dominant Markets & Segments in Eye Cancer Industry
The North American region currently dominates the eye cancer market, primarily due to high healthcare expenditure, advanced healthcare infrastructure, and a substantial research and development ecosystem. Within the market segments, Intraocular Retinoblastoma holds a larger share in the "By Type of Staging" segment. In "By Treatment Type," surgery and radiation therapy together represent the dominant treatment modalities due to their established efficacy. Non-hereditary Retinoblastoma is the more prevalent type in the "By Type of Retinoblastoma" segment.
Key Drivers for North American Dominance:
- High healthcare expenditure
- Advanced healthcare infrastructure
- Robust research and development ecosystem
- Favorable regulatory environment
Segment Dominance Analysis:
- By Type of Staging: Intraocular Retinoblastoma segment holds a larger market share.
- By Treatment Type: Surgery and radiation therapy are the most prevalent treatment modalities.
- By Type of Retinoblastoma: Non-hereditary Retinoblastoma accounts for a significant portion of the market.
Eye Cancer Industry Product Innovations
Significant advancements in targeted therapies, such as the development of novel anti-cancer agents, and improved surgical techniques are revolutionizing the treatment landscape. These innovations offer enhanced efficacy, reduced side effects, and improved patient outcomes. The market is witnessing a growing emphasis on personalized medicine, with tailored treatment approaches based on individual genetic profiles. These developments are increasing market penetration and driving the growth of the overall market.
Report Segmentation & Scope
This report segments the eye cancer market across various parameters:
- By Type of Staging: Intraocular Retinoblastoma and Extraocular Retinoblastoma. Intraocular Retinoblastoma is projected to witness faster growth during the forecast period due to increasing diagnosis rates.
- By Treatment Type: Surgery, Radiation therapy, Laser Therapy, Cryotherapy, Chemotherapy, and Bone Marrow Transplantation/Stem Cell Transplant. Surgery and radiation therapy currently hold a majority of the market share, but targeted therapies are expected to experience significant growth.
- By Type of Retinoblastoma: Non-hereditary Retinoblastoma and Hereditary Retinoblastoma. Non-hereditary retinoblastoma constitutes a larger segment currently.
Each segment's growth projections, market sizes, and competitive dynamics are extensively analyzed in the full report.
Key Drivers of Eye Cancer Industry Growth
Several factors fuel the growth of the eye cancer industry: the increasing prevalence of eye cancer globally, driven by aging populations and environmental risk factors; advancements in diagnostic and therapeutic technologies; rising healthcare expenditure in developed and developing economies; and increasing awareness and early detection programs. Government initiatives supporting research and development, alongside favorable regulatory environments, further contribute to market expansion.
Challenges in the Eye Cancer Industry Sector
The eye cancer industry faces several challenges: the high cost of advanced therapies limits access for many patients; the development of drug resistance poses a significant clinical hurdle; and stringent regulatory pathways prolong the time-to-market for new treatments. Supply chain disruptions and fluctuations in raw material prices also impact profitability. Finally, intense competition among numerous players creates pressure on pricing and market share.
Leading Players in the Eye Cancer Industry Market
- Cellceutix Corporation
- Novartis AG
- Cadila Pharmaceuticals
- Icon Bioscience
- GlaxoSmithKline plc
- Teva Pharmaceutical Industries Ltd
- Johnson & Johnson
- RXi Pharmaceuticals
- Merck & Co
- Baxter International Inc
- Bristol-Myers Squibb Company
- Pfizer Inc
Key Developments in Eye Cancer Industry Sector
- May 2022: The UK's National Health Service launched a new test to detect retinoblastoma in unborn babies, significantly improving early intervention and treatment.
- September 2022: Researchers discovered ESRRG, a molecule promoting retinoblastoma tumor cell survival. Blocking ESRRG shows promise for new treatment strategies. These findings are creating significant interest and pave the way for novel therapeutic avenues.
Strategic Eye Cancer Industry Market Outlook
The eye cancer market holds immense future potential, driven by continued innovation in targeted therapies, personalized medicine approaches, and improved diagnostic tools. Strategic opportunities lie in expanding access to advanced treatments, particularly in developing countries, and in developing novel therapeutic agents to address unmet medical needs. The market is poised for continued robust growth, presenting lucrative prospects for companies investing in research, development, and commercialization within this critical sector.
Eye Cancer Industry Segmentation
-
1. Treatment Type
- 1.1. Surgery
- 1.2. Radiation therapy
- 1.3. Laser Therapy
- 1.4. Cryotherapy
- 1.5. Chemotherapy
- 1.6. Bone Marrow Transplantation/Stem Cell Transplant
-
2. Type of Retinoblastoma
- 2.1. Non-hereditary Retinoblastoma
- 2.2. Hereditary Retinoblastoma
-
3. Type of Staging
- 3.1. Intraocular Retinoblastoma
- 3.2. Extraocular Retinoblastoma
Eye Cancer Industry Segmentation By Geography
-
1. North America
- 1.1. United States
- 1.2. Canada
- 1.3. Mexico
-
2. Europe
- 2.1. Germany
- 2.2. United Kingdom
- 2.3. France
- 2.4. Italy
- 2.5. Spain
- 2.6. Rest of Europe
-
3. Asia Pacific
- 3.1. China
- 3.2. Japan
- 3.3. India
- 3.4. Australia
- 3.5. South Korea
- 3.6. Rest of Asia Pacific
-
4. Middle East and Africa
- 4.1. GCC
- 4.2. South Africa
- 4.3. Rest of Middle East and Africa
-
5. South America
- 5.1. Brazil
- 5.2. Argentina
- 5.3. Rest of South America
Eye Cancer Industry REPORT HIGHLIGHTS
| Aspects | Details |
|---|---|
| Study Period | 2019-2033 |
| Base Year | 2024 |
| Estimated Year | 2025 |
| Forecast Period | 2025-2033 |
| Historical Period | 2019-2024 |
| Growth Rate | CAGR of 4.45% from 2019-2033 |
| Segmentation |
|
Table of Contents
- 1. Introduction
- 1.1. Research Scope
- 1.2. Market Segmentation
- 1.3. Research Methodology
- 1.4. Definitions and Assumptions
- 2. Executive Summary
- 2.1. Introduction
- 3. Market Dynamics
- 3.1. Introduction
- 3.2. Market Drivers
- 3.2.1. Remission and the Chance of Recurrence of Retinoblastoma; Increasing Public Awareness on Retinoblastoma
- 3.3. Market Restrains
- 3.3.1. Side Effects of Retinoblastoma Surgery and High Cost of Treatment in Developing Countries
- 3.4. Market Trends
- 3.4.1. Non-hereditary Retinoblastoma is Expected to hold a Significant Market Share Over the Forecast Period
- 4. Market Factor Analysis
- 4.1. Porters Five Forces
- 4.2. Supply/Value Chain
- 4.3. PESTEL analysis
- 4.4. Market Entropy
- 4.5. Patent/Trademark Analysis
- 5. Global Eye Cancer Industry Analysis, Insights and Forecast, 2019-2031
- 5.1. Market Analysis, Insights and Forecast - by Treatment Type
- 5.1.1. Surgery
- 5.1.2. Radiation therapy
- 5.1.3. Laser Therapy
- 5.1.4. Cryotherapy
- 5.1.5. Chemotherapy
- 5.1.6. Bone Marrow Transplantation/Stem Cell Transplant
- 5.2. Market Analysis, Insights and Forecast - by Type of Retinoblastoma
- 5.2.1. Non-hereditary Retinoblastoma
- 5.2.2. Hereditary Retinoblastoma
- 5.3. Market Analysis, Insights and Forecast - by Type of Staging
- 5.3.1. Intraocular Retinoblastoma
- 5.3.2. Extraocular Retinoblastoma
- 5.4. Market Analysis, Insights and Forecast - by Region
- 5.4.1. North America
- 5.4.2. Europe
- 5.4.3. Asia Pacific
- 5.4.4. Middle East and Africa
- 5.4.5. South America
- 5.1. Market Analysis, Insights and Forecast - by Treatment Type
- 6. North America Eye Cancer Industry Analysis, Insights and Forecast, 2019-2031
- 6.1. Market Analysis, Insights and Forecast - by Treatment Type
- 6.1.1. Surgery
- 6.1.2. Radiation therapy
- 6.1.3. Laser Therapy
- 6.1.4. Cryotherapy
- 6.1.5. Chemotherapy
- 6.1.6. Bone Marrow Transplantation/Stem Cell Transplant
- 6.2. Market Analysis, Insights and Forecast - by Type of Retinoblastoma
- 6.2.1. Non-hereditary Retinoblastoma
- 6.2.2. Hereditary Retinoblastoma
- 6.3. Market Analysis, Insights and Forecast - by Type of Staging
- 6.3.1. Intraocular Retinoblastoma
- 6.3.2. Extraocular Retinoblastoma
- 6.1. Market Analysis, Insights and Forecast - by Treatment Type
- 7. Europe Eye Cancer Industry Analysis, Insights and Forecast, 2019-2031
- 7.1. Market Analysis, Insights and Forecast - by Treatment Type
- 7.1.1. Surgery
- 7.1.2. Radiation therapy
- 7.1.3. Laser Therapy
- 7.1.4. Cryotherapy
- 7.1.5. Chemotherapy
- 7.1.6. Bone Marrow Transplantation/Stem Cell Transplant
- 7.2. Market Analysis, Insights and Forecast - by Type of Retinoblastoma
- 7.2.1. Non-hereditary Retinoblastoma
- 7.2.2. Hereditary Retinoblastoma
- 7.3. Market Analysis, Insights and Forecast - by Type of Staging
- 7.3.1. Intraocular Retinoblastoma
- 7.3.2. Extraocular Retinoblastoma
- 7.1. Market Analysis, Insights and Forecast - by Treatment Type
- 8. Asia Pacific Eye Cancer Industry Analysis, Insights and Forecast, 2019-2031
- 8.1. Market Analysis, Insights and Forecast - by Treatment Type
- 8.1.1. Surgery
- 8.1.2. Radiation therapy
- 8.1.3. Laser Therapy
- 8.1.4. Cryotherapy
- 8.1.5. Chemotherapy
- 8.1.6. Bone Marrow Transplantation/Stem Cell Transplant
- 8.2. Market Analysis, Insights and Forecast - by Type of Retinoblastoma
- 8.2.1. Non-hereditary Retinoblastoma
- 8.2.2. Hereditary Retinoblastoma
- 8.3. Market Analysis, Insights and Forecast - by Type of Staging
- 8.3.1. Intraocular Retinoblastoma
- 8.3.2. Extraocular Retinoblastoma
- 8.1. Market Analysis, Insights and Forecast - by Treatment Type
- 9. Middle East and Africa Eye Cancer Industry Analysis, Insights and Forecast, 2019-2031
- 9.1. Market Analysis, Insights and Forecast - by Treatment Type
- 9.1.1. Surgery
- 9.1.2. Radiation therapy
- 9.1.3. Laser Therapy
- 9.1.4. Cryotherapy
- 9.1.5. Chemotherapy
- 9.1.6. Bone Marrow Transplantation/Stem Cell Transplant
- 9.2. Market Analysis, Insights and Forecast - by Type of Retinoblastoma
- 9.2.1. Non-hereditary Retinoblastoma
- 9.2.2. Hereditary Retinoblastoma
- 9.3. Market Analysis, Insights and Forecast - by Type of Staging
- 9.3.1. Intraocular Retinoblastoma
- 9.3.2. Extraocular Retinoblastoma
- 9.1. Market Analysis, Insights and Forecast - by Treatment Type
- 10. South America Eye Cancer Industry Analysis, Insights and Forecast, 2019-2031
- 10.1. Market Analysis, Insights and Forecast - by Treatment Type
- 10.1.1. Surgery
- 10.1.2. Radiation therapy
- 10.1.3. Laser Therapy
- 10.1.4. Cryotherapy
- 10.1.5. Chemotherapy
- 10.1.6. Bone Marrow Transplantation/Stem Cell Transplant
- 10.2. Market Analysis, Insights and Forecast - by Type of Retinoblastoma
- 10.2.1. Non-hereditary Retinoblastoma
- 10.2.2. Hereditary Retinoblastoma
- 10.3. Market Analysis, Insights and Forecast - by Type of Staging
- 10.3.1. Intraocular Retinoblastoma
- 10.3.2. Extraocular Retinoblastoma
- 10.1. Market Analysis, Insights and Forecast - by Treatment Type
- 11. North America Eye Cancer Industry Analysis, Insights and Forecast, 2019-2031
- 11.1. Market Analysis, Insights and Forecast - By Country/Sub-region
- 11.1.1 United States
- 11.1.2 Canada
- 11.1.3 Mexico
- 12. Europe Eye Cancer Industry Analysis, Insights and Forecast, 2019-2031
- 12.1. Market Analysis, Insights and Forecast - By Country/Sub-region
- 12.1.1 Germany
- 12.1.2 United Kingdom
- 12.1.3 France
- 12.1.4 Italy
- 12.1.5 Spain
- 12.1.6 Rest of Europe
- 13. Asia Pacific Eye Cancer Industry Analysis, Insights and Forecast, 2019-2031
- 13.1. Market Analysis, Insights and Forecast - By Country/Sub-region
- 13.1.1 China
- 13.1.2 Japan
- 13.1.3 India
- 13.1.4 Australia
- 13.1.5 South Korea
- 13.1.6 Rest of Asia Pacific
- 14. Middle East and Africa Eye Cancer Industry Analysis, Insights and Forecast, 2019-2031
- 14.1. Market Analysis, Insights and Forecast - By Country/Sub-region
- 14.1.1 GCC
- 14.1.2 South Africa
- 14.1.3 Rest of Middle East and Africa
- 15. South America Eye Cancer Industry Analysis, Insights and Forecast, 2019-2031
- 15.1. Market Analysis, Insights and Forecast - By Country/Sub-region
- 15.1.1 Brazil
- 15.1.2 Argentina
- 15.1.3 Rest of South America
- 16. Competitive Analysis
- 16.1. Global Market Share Analysis 2024
- 16.2. Company Profiles
- 16.2.1 Cellceutix Corporation
- 16.2.1.1. Overview
- 16.2.1.2. Products
- 16.2.1.3. SWOT Analysis
- 16.2.1.4. Recent Developments
- 16.2.1.5. Financials (Based on Availability)
- 16.2.2 Novartis AG
- 16.2.2.1. Overview
- 16.2.2.2. Products
- 16.2.2.3. SWOT Analysis
- 16.2.2.4. Recent Developments
- 16.2.2.5. Financials (Based on Availability)
- 16.2.3 Cadila Pharmaceuticals
- 16.2.3.1. Overview
- 16.2.3.2. Products
- 16.2.3.3. SWOT Analysis
- 16.2.3.4. Recent Developments
- 16.2.3.5. Financials (Based on Availability)
- 16.2.4 Icon Bioscience
- 16.2.4.1. Overview
- 16.2.4.2. Products
- 16.2.4.3. SWOT Analysis
- 16.2.4.4. Recent Developments
- 16.2.4.5. Financials (Based on Availability)
- 16.2.5 GlaxoSmithKline plc
- 16.2.5.1. Overview
- 16.2.5.2. Products
- 16.2.5.3. SWOT Analysis
- 16.2.5.4. Recent Developments
- 16.2.5.5. Financials (Based on Availability)
- 16.2.6 Teva Pharmaceutical Industries Ltd
- 16.2.6.1. Overview
- 16.2.6.2. Products
- 16.2.6.3. SWOT Analysis
- 16.2.6.4. Recent Developments
- 16.2.6.5. Financials (Based on Availability)
- 16.2.7 Johnson & Johnson
- 16.2.7.1. Overview
- 16.2.7.2. Products
- 16.2.7.3. SWOT Analysis
- 16.2.7.4. Recent Developments
- 16.2.7.5. Financials (Based on Availability)
- 16.2.8 RXi Pharmaceuticals*List Not Exhaustive
- 16.2.8.1. Overview
- 16.2.8.2. Products
- 16.2.8.3. SWOT Analysis
- 16.2.8.4. Recent Developments
- 16.2.8.5. Financials (Based on Availability)
- 16.2.9 Merck & Co
- 16.2.9.1. Overview
- 16.2.9.2. Products
- 16.2.9.3. SWOT Analysis
- 16.2.9.4. Recent Developments
- 16.2.9.5. Financials (Based on Availability)
- 16.2.10 Baxter International Inc
- 16.2.10.1. Overview
- 16.2.10.2. Products
- 16.2.10.3. SWOT Analysis
- 16.2.10.4. Recent Developments
- 16.2.10.5. Financials (Based on Availability)
- 16.2.11 Bristol-Myers Squibb Company
- 16.2.11.1. Overview
- 16.2.11.2. Products
- 16.2.11.3. SWOT Analysis
- 16.2.11.4. Recent Developments
- 16.2.11.5. Financials (Based on Availability)
- 16.2.12 Pfizer Inc
- 16.2.12.1. Overview
- 16.2.12.2. Products
- 16.2.12.3. SWOT Analysis
- 16.2.12.4. Recent Developments
- 16.2.12.5. Financials (Based on Availability)
- 16.2.1 Cellceutix Corporation
List of Figures
- Figure 1: Global Eye Cancer Industry Revenue Breakdown (Million, %) by Region 2024 & 2032
- Figure 2: North America Eye Cancer Industry Revenue (Million), by Country 2024 & 2032
- Figure 3: North America Eye Cancer Industry Revenue Share (%), by Country 2024 & 2032
- Figure 4: Europe Eye Cancer Industry Revenue (Million), by Country 2024 & 2032
- Figure 5: Europe Eye Cancer Industry Revenue Share (%), by Country 2024 & 2032
- Figure 6: Asia Pacific Eye Cancer Industry Revenue (Million), by Country 2024 & 2032
- Figure 7: Asia Pacific Eye Cancer Industry Revenue Share (%), by Country 2024 & 2032
- Figure 8: Middle East and Africa Eye Cancer Industry Revenue (Million), by Country 2024 & 2032
- Figure 9: Middle East and Africa Eye Cancer Industry Revenue Share (%), by Country 2024 & 2032
- Figure 10: South America Eye Cancer Industry Revenue (Million), by Country 2024 & 2032
- Figure 11: South America Eye Cancer Industry Revenue Share (%), by Country 2024 & 2032
- Figure 12: North America Eye Cancer Industry Revenue (Million), by Treatment Type 2024 & 2032
- Figure 13: North America Eye Cancer Industry Revenue Share (%), by Treatment Type 2024 & 2032
- Figure 14: North America Eye Cancer Industry Revenue (Million), by Type of Retinoblastoma 2024 & 2032
- Figure 15: North America Eye Cancer Industry Revenue Share (%), by Type of Retinoblastoma 2024 & 2032
- Figure 16: North America Eye Cancer Industry Revenue (Million), by Type of Staging 2024 & 2032
- Figure 17: North America Eye Cancer Industry Revenue Share (%), by Type of Staging 2024 & 2032
- Figure 18: North America Eye Cancer Industry Revenue (Million), by Country 2024 & 2032
- Figure 19: North America Eye Cancer Industry Revenue Share (%), by Country 2024 & 2032
- Figure 20: Europe Eye Cancer Industry Revenue (Million), by Treatment Type 2024 & 2032
- Figure 21: Europe Eye Cancer Industry Revenue Share (%), by Treatment Type 2024 & 2032
- Figure 22: Europe Eye Cancer Industry Revenue (Million), by Type of Retinoblastoma 2024 & 2032
- Figure 23: Europe Eye Cancer Industry Revenue Share (%), by Type of Retinoblastoma 2024 & 2032
- Figure 24: Europe Eye Cancer Industry Revenue (Million), by Type of Staging 2024 & 2032
- Figure 25: Europe Eye Cancer Industry Revenue Share (%), by Type of Staging 2024 & 2032
- Figure 26: Europe Eye Cancer Industry Revenue (Million), by Country 2024 & 2032
- Figure 27: Europe Eye Cancer Industry Revenue Share (%), by Country 2024 & 2032
- Figure 28: Asia Pacific Eye Cancer Industry Revenue (Million), by Treatment Type 2024 & 2032
- Figure 29: Asia Pacific Eye Cancer Industry Revenue Share (%), by Treatment Type 2024 & 2032
- Figure 30: Asia Pacific Eye Cancer Industry Revenue (Million), by Type of Retinoblastoma 2024 & 2032
- Figure 31: Asia Pacific Eye Cancer Industry Revenue Share (%), by Type of Retinoblastoma 2024 & 2032
- Figure 32: Asia Pacific Eye Cancer Industry Revenue (Million), by Type of Staging 2024 & 2032
- Figure 33: Asia Pacific Eye Cancer Industry Revenue Share (%), by Type of Staging 2024 & 2032
- Figure 34: Asia Pacific Eye Cancer Industry Revenue (Million), by Country 2024 & 2032
- Figure 35: Asia Pacific Eye Cancer Industry Revenue Share (%), by Country 2024 & 2032
- Figure 36: Middle East and Africa Eye Cancer Industry Revenue (Million), by Treatment Type 2024 & 2032
- Figure 37: Middle East and Africa Eye Cancer Industry Revenue Share (%), by Treatment Type 2024 & 2032
- Figure 38: Middle East and Africa Eye Cancer Industry Revenue (Million), by Type of Retinoblastoma 2024 & 2032
- Figure 39: Middle East and Africa Eye Cancer Industry Revenue Share (%), by Type of Retinoblastoma 2024 & 2032
- Figure 40: Middle East and Africa Eye Cancer Industry Revenue (Million), by Type of Staging 2024 & 2032
- Figure 41: Middle East and Africa Eye Cancer Industry Revenue Share (%), by Type of Staging 2024 & 2032
- Figure 42: Middle East and Africa Eye Cancer Industry Revenue (Million), by Country 2024 & 2032
- Figure 43: Middle East and Africa Eye Cancer Industry Revenue Share (%), by Country 2024 & 2032
- Figure 44: South America Eye Cancer Industry Revenue (Million), by Treatment Type 2024 & 2032
- Figure 45: South America Eye Cancer Industry Revenue Share (%), by Treatment Type 2024 & 2032
- Figure 46: South America Eye Cancer Industry Revenue (Million), by Type of Retinoblastoma 2024 & 2032
- Figure 47: South America Eye Cancer Industry Revenue Share (%), by Type of Retinoblastoma 2024 & 2032
- Figure 48: South America Eye Cancer Industry Revenue (Million), by Type of Staging 2024 & 2032
- Figure 49: South America Eye Cancer Industry Revenue Share (%), by Type of Staging 2024 & 2032
- Figure 50: South America Eye Cancer Industry Revenue (Million), by Country 2024 & 2032
- Figure 51: South America Eye Cancer Industry Revenue Share (%), by Country 2024 & 2032
List of Tables
- Table 1: Global Eye Cancer Industry Revenue Million Forecast, by Region 2019 & 2032
- Table 2: Global Eye Cancer Industry Revenue Million Forecast, by Treatment Type 2019 & 2032
- Table 3: Global Eye Cancer Industry Revenue Million Forecast, by Type of Retinoblastoma 2019 & 2032
- Table 4: Global Eye Cancer Industry Revenue Million Forecast, by Type of Staging 2019 & 2032
- Table 5: Global Eye Cancer Industry Revenue Million Forecast, by Region 2019 & 2032
- Table 6: Global Eye Cancer Industry Revenue Million Forecast, by Country 2019 & 2032
- Table 7: United States Eye Cancer Industry Revenue (Million) Forecast, by Application 2019 & 2032
- Table 8: Canada Eye Cancer Industry Revenue (Million) Forecast, by Application 2019 & 2032
- Table 9: Mexico Eye Cancer Industry Revenue (Million) Forecast, by Application 2019 & 2032
- Table 10: Global Eye Cancer Industry Revenue Million Forecast, by Country 2019 & 2032
- Table 11: Germany Eye Cancer Industry Revenue (Million) Forecast, by Application 2019 & 2032
- Table 12: United Kingdom Eye Cancer Industry Revenue (Million) Forecast, by Application 2019 & 2032
- Table 13: France Eye Cancer Industry Revenue (Million) Forecast, by Application 2019 & 2032
- Table 14: Italy Eye Cancer Industry Revenue (Million) Forecast, by Application 2019 & 2032
- Table 15: Spain Eye Cancer Industry Revenue (Million) Forecast, by Application 2019 & 2032
- Table 16: Rest of Europe Eye Cancer Industry Revenue (Million) Forecast, by Application 2019 & 2032
- Table 17: Global Eye Cancer Industry Revenue Million Forecast, by Country 2019 & 2032
- Table 18: China Eye Cancer Industry Revenue (Million) Forecast, by Application 2019 & 2032
- Table 19: Japan Eye Cancer Industry Revenue (Million) Forecast, by Application 2019 & 2032
- Table 20: India Eye Cancer Industry Revenue (Million) Forecast, by Application 2019 & 2032
- Table 21: Australia Eye Cancer Industry Revenue (Million) Forecast, by Application 2019 & 2032
- Table 22: South Korea Eye Cancer Industry Revenue (Million) Forecast, by Application 2019 & 2032
- Table 23: Rest of Asia Pacific Eye Cancer Industry Revenue (Million) Forecast, by Application 2019 & 2032
- Table 24: Global Eye Cancer Industry Revenue Million Forecast, by Country 2019 & 2032
- Table 25: GCC Eye Cancer Industry Revenue (Million) Forecast, by Application 2019 & 2032
- Table 26: South Africa Eye Cancer Industry Revenue (Million) Forecast, by Application 2019 & 2032
- Table 27: Rest of Middle East and Africa Eye Cancer Industry Revenue (Million) Forecast, by Application 2019 & 2032
- Table 28: Global Eye Cancer Industry Revenue Million Forecast, by Country 2019 & 2032
- Table 29: Brazil Eye Cancer Industry Revenue (Million) Forecast, by Application 2019 & 2032
- Table 30: Argentina Eye Cancer Industry Revenue (Million) Forecast, by Application 2019 & 2032
- Table 31: Rest of South America Eye Cancer Industry Revenue (Million) Forecast, by Application 2019 & 2032
- Table 32: Global Eye Cancer Industry Revenue Million Forecast, by Treatment Type 2019 & 2032
- Table 33: Global Eye Cancer Industry Revenue Million Forecast, by Type of Retinoblastoma 2019 & 2032
- Table 34: Global Eye Cancer Industry Revenue Million Forecast, by Type of Staging 2019 & 2032
- Table 35: Global Eye Cancer Industry Revenue Million Forecast, by Country 2019 & 2032
- Table 36: United States Eye Cancer Industry Revenue (Million) Forecast, by Application 2019 & 2032
- Table 37: Canada Eye Cancer Industry Revenue (Million) Forecast, by Application 2019 & 2032
- Table 38: Mexico Eye Cancer Industry Revenue (Million) Forecast, by Application 2019 & 2032
- Table 39: Global Eye Cancer Industry Revenue Million Forecast, by Treatment Type 2019 & 2032
- Table 40: Global Eye Cancer Industry Revenue Million Forecast, by Type of Retinoblastoma 2019 & 2032
- Table 41: Global Eye Cancer Industry Revenue Million Forecast, by Type of Staging 2019 & 2032
- Table 42: Global Eye Cancer Industry Revenue Million Forecast, by Country 2019 & 2032
- Table 43: Germany Eye Cancer Industry Revenue (Million) Forecast, by Application 2019 & 2032
- Table 44: United Kingdom Eye Cancer Industry Revenue (Million) Forecast, by Application 2019 & 2032
- Table 45: France Eye Cancer Industry Revenue (Million) Forecast, by Application 2019 & 2032
- Table 46: Italy Eye Cancer Industry Revenue (Million) Forecast, by Application 2019 & 2032
- Table 47: Spain Eye Cancer Industry Revenue (Million) Forecast, by Application 2019 & 2032
- Table 48: Rest of Europe Eye Cancer Industry Revenue (Million) Forecast, by Application 2019 & 2032
- Table 49: Global Eye Cancer Industry Revenue Million Forecast, by Treatment Type 2019 & 2032
- Table 50: Global Eye Cancer Industry Revenue Million Forecast, by Type of Retinoblastoma 2019 & 2032
- Table 51: Global Eye Cancer Industry Revenue Million Forecast, by Type of Staging 2019 & 2032
- Table 52: Global Eye Cancer Industry Revenue Million Forecast, by Country 2019 & 2032
- Table 53: China Eye Cancer Industry Revenue (Million) Forecast, by Application 2019 & 2032
- Table 54: Japan Eye Cancer Industry Revenue (Million) Forecast, by Application 2019 & 2032
- Table 55: India Eye Cancer Industry Revenue (Million) Forecast, by Application 2019 & 2032
- Table 56: Australia Eye Cancer Industry Revenue (Million) Forecast, by Application 2019 & 2032
- Table 57: South Korea Eye Cancer Industry Revenue (Million) Forecast, by Application 2019 & 2032
- Table 58: Rest of Asia Pacific Eye Cancer Industry Revenue (Million) Forecast, by Application 2019 & 2032
- Table 59: Global Eye Cancer Industry Revenue Million Forecast, by Treatment Type 2019 & 2032
- Table 60: Global Eye Cancer Industry Revenue Million Forecast, by Type of Retinoblastoma 2019 & 2032
- Table 61: Global Eye Cancer Industry Revenue Million Forecast, by Type of Staging 2019 & 2032
- Table 62: Global Eye Cancer Industry Revenue Million Forecast, by Country 2019 & 2032
- Table 63: GCC Eye Cancer Industry Revenue (Million) Forecast, by Application 2019 & 2032
- Table 64: South Africa Eye Cancer Industry Revenue (Million) Forecast, by Application 2019 & 2032
- Table 65: Rest of Middle East and Africa Eye Cancer Industry Revenue (Million) Forecast, by Application 2019 & 2032
- Table 66: Global Eye Cancer Industry Revenue Million Forecast, by Treatment Type 2019 & 2032
- Table 67: Global Eye Cancer Industry Revenue Million Forecast, by Type of Retinoblastoma 2019 & 2032
- Table 68: Global Eye Cancer Industry Revenue Million Forecast, by Type of Staging 2019 & 2032
- Table 69: Global Eye Cancer Industry Revenue Million Forecast, by Country 2019 & 2032
- Table 70: Brazil Eye Cancer Industry Revenue (Million) Forecast, by Application 2019 & 2032
- Table 71: Argentina Eye Cancer Industry Revenue (Million) Forecast, by Application 2019 & 2032
- Table 72: Rest of South America Eye Cancer Industry Revenue (Million) Forecast, by Application 2019 & 2032
Frequently Asked Questions
1. What is the projected Compound Annual Growth Rate (CAGR) of the Eye Cancer Industry?
The projected CAGR is approximately 4.45%.
2. Which companies are prominent players in the Eye Cancer Industry?
Key companies in the market include Cellceutix Corporation, Novartis AG, Cadila Pharmaceuticals, Icon Bioscience, GlaxoSmithKline plc, Teva Pharmaceutical Industries Ltd, Johnson & Johnson, RXi Pharmaceuticals*List Not Exhaustive, Merck & Co, Baxter International Inc, Bristol-Myers Squibb Company, Pfizer Inc.
3. What are the main segments of the Eye Cancer Industry?
The market segments include Treatment Type, Type of Retinoblastoma, Type of Staging.
4. Can you provide details about the market size?
The market size is estimated to be USD 1.85 Million as of 2022.
5. What are some drivers contributing to market growth?
Remission and the Chance of Recurrence of Retinoblastoma; Increasing Public Awareness on Retinoblastoma.
6. What are the notable trends driving market growth?
Non-hereditary Retinoblastoma is Expected to hold a Significant Market Share Over the Forecast Period.
7. Are there any restraints impacting market growth?
Side Effects of Retinoblastoma Surgery and High Cost of Treatment in Developing Countries.
8. Can you provide examples of recent developments in the market?
September 2022: researchers at UT Southwestern and the University of Miami discovered a molecule, estrogen-related receptor gamma, or ESRRG that is hyperactive and promotes tumor cell survival in retinoblastoma. Blocking ESRRG, the team reported in Science Advances, kills retinoblastoma cells.
9. What pricing options are available for accessing the report?
Pricing options include single-user, multi-user, and enterprise licenses priced at USD 4750, USD 5250, and USD 8750 respectively.
10. Is the market size provided in terms of value or volume?
The market size is provided in terms of value, measured in Million.
11. Are there any specific market keywords associated with the report?
Yes, the market keyword associated with the report is "Eye Cancer Industry," which aids in identifying and referencing the specific market segment covered.
12. How do I determine which pricing option suits my needs best?
The pricing options vary based on user requirements and access needs. Individual users may opt for single-user licenses, while businesses requiring broader access may choose multi-user or enterprise licenses for cost-effective access to the report.
13. Are there any additional resources or data provided in the Eye Cancer Industry report?
While the report offers comprehensive insights, it's advisable to review the specific contents or supplementary materials provided to ascertain if additional resources or data are available.
14. How can I stay updated on further developments or reports in the Eye Cancer Industry?
To stay informed about further developments, trends, and reports in the Eye Cancer Industry, consider subscribing to industry newsletters, following relevant companies and organizations, or regularly checking reputable industry news sources and publications.
Methodology
Step 1 - Identification of Relevant Samples Size from Population Database


Step 2 - Approaches for Defining Global Market Size (Value, Volume* & Price*)

Note*: In applicable scenarios
Step 3 - Data Sources
Primary Research
- Web Analytics
- Survey Reports
- Research Institute
- Latest Research Reports
- Opinion Leaders
Secondary Research
- Annual Reports
- White Paper
- Latest Press Release
- Industry Association
- Paid Database
- Investor Presentations

Step 4 - Data Triangulation
Involves using different sources of information in order to increase the validity of a study
These sources are likely to be stakeholders in a program - participants, other researchers, program staff, other community members, and so on.
Then we put all data in single framework & apply various statistical tools to find out the dynamic on the market.
During the analysis stage, feedback from the stakeholder groups would be compared to determine areas of agreement as well as areas of divergence


