
Key Insights
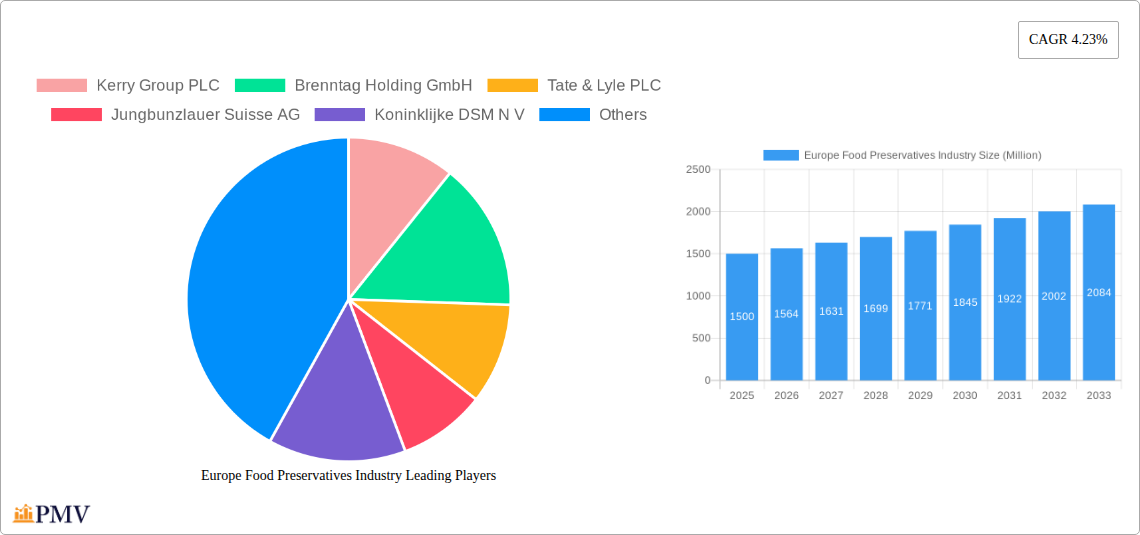
The European food preservatives market, valued at approximately €1.5 billion in 2025, is projected to experience robust growth, driven by increasing consumer demand for extended shelf life and food safety. A compound annual growth rate (CAGR) of 4.23% from 2025 to 2033 indicates a significant expansion in market size, reaching an estimated €2.3 billion by 2033. This growth is fueled by several key factors. The rising prevalence of foodborne illnesses is prompting manufacturers to prioritize preservation techniques, boosting the demand for effective and safe preservatives. Furthermore, evolving consumer preferences towards convenient and ready-to-eat meals are contributing to the market's expansion, as these products often require extended shelf lives. Stringent food safety regulations within the EU are also driving innovation in preservative technologies, leading to the development of natural and clean-label alternatives. This shift towards natural preservatives, alongside the growing health-conscious consumer base, presents both opportunities and challenges for market players. The increasing cost of raw materials and potential regulatory changes could pose restraints on market growth.
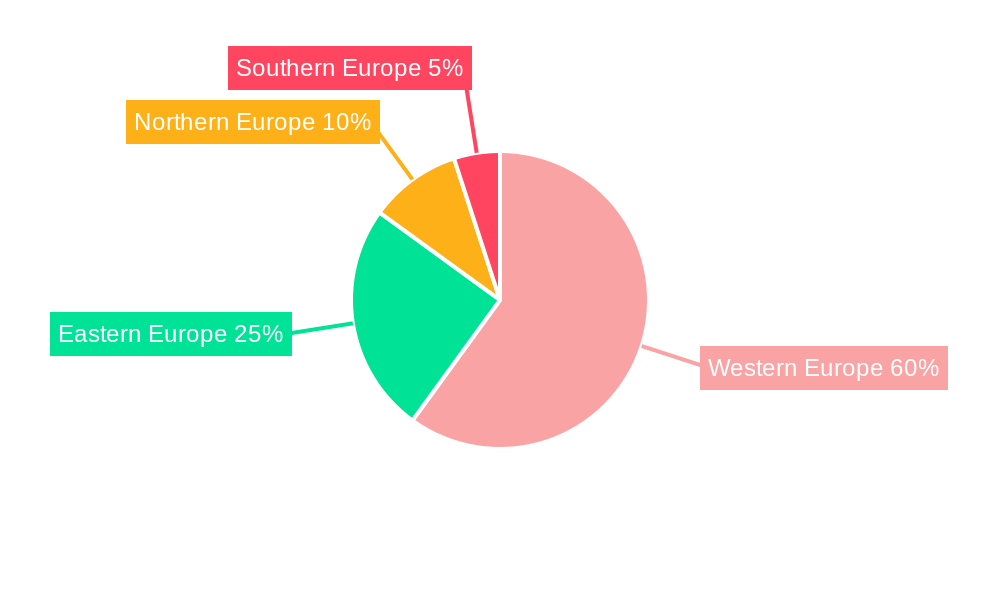
Major players like Kerry Group PLC, Brenntag Holding GmbH, and Tate & Lyle PLC are strategically positioning themselves through mergers and acquisitions, product innovations, and expansion into new markets to capitalize on the growth opportunities. The market is segmented by type (natural and synthetic), application (meat, bakery, beverages, etc.), and distribution channel. The natural preservatives segment is expected to exhibit faster growth due to increasing consumer preference for clean-label products. Regional variations in consumer preferences and regulatory landscapes contribute to diverse market dynamics across Europe, with Western European countries likely leading in market share due to higher consumer spending and established food processing industries. The market’s future will be shaped by consumer demand for clean labels, stricter regulations, and the continuous development of innovative and sustainable preservative technologies.
Europe Food Preservatives Industry Market Report: 2019-2033
This comprehensive report provides an in-depth analysis of the Europe food preservatives market, offering valuable insights for industry stakeholders, investors, and strategic decision-makers. The study covers the period from 2019 to 2033, with a base year of 2025 and a forecast period spanning 2025-2033. The report analyzes market size, growth drivers, competitive landscape, and future trends, leveraging detailed data and expert analysis to deliver actionable intelligence. The total market value in 2025 is estimated at €XX Million, projected to reach €XX Million by 2033, exhibiting a CAGR of XX%.
Europe Food Preservatives Industry Market Structure & Competitive Dynamics
The European food preservatives market is characterized by a moderately concentrated structure, with several large multinational corporations holding significant market share. Key players include Kerry Group PLC, Brenntag Holding GmbH, Tate & Lyle PLC, Jungbunzlauer Suisse AG, Koninklijke DSM N V, DuPont de Nemours Inc, Corbion NV, and Merck KGaA. However, smaller, specialized companies also contribute significantly, particularly in niche segments.
- Market Concentration: The top five players hold an estimated XX% market share in 2025.
- Innovation Ecosystems: Collaboration between industry players and research institutions drives innovation in natural and sustainable preservatives.
- Regulatory Frameworks: Stringent EU regulations on food additives influence product development and market access. Compliance costs impact profitability.
- Product Substitutes: The growing demand for natural and clean-label products is pushing the development of alternatives to traditional preservatives.
- End-User Trends: The shift towards convenience foods and longer shelf-life products fuels demand for effective and safe preservatives.
- M&A Activities: The past five years have witnessed several mergers and acquisitions, valued at approximately €XX Million, driven by consolidation and expansion strategies. These activities reshape market dynamics and competitive landscapes.
Europe Food Preservatives Industry Industry Trends & Insights
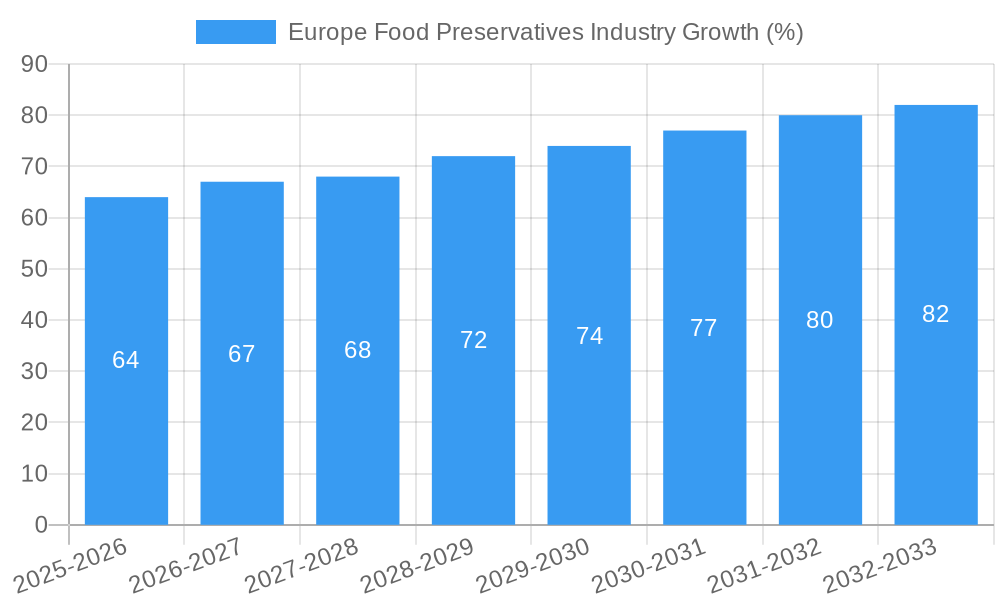
The European food preservatives market is experiencing dynamic growth propelled by several key factors. The increasing demand for processed and convenience foods, coupled with stringent food safety regulations, necessitates the use of effective preservatives. The rising consumer preference for longer shelf-life products drives the growth, with the market expected to grow at a CAGR of XX% during the forecast period. Technological advancements have led to the development of novel preservatives with enhanced efficacy and improved safety profiles. Furthermore, the rising adoption of natural and clean-label products is shaping the market landscape, forcing companies to invest in research and development to create natural alternatives. Market penetration of natural preservatives is increasing at XX% annually. The growing awareness of foodborne illnesses among consumers further strengthens the demand for food preservatives to ensure safety and quality. Intense competition and innovation are driving prices down, leading to higher market penetration.
Dominant Markets & Segments in Europe Food Preservatives Industry
Germany holds the largest market share within Europe, driven by its robust food processing industry and high consumption of processed food products. The UK and France follow closely. Within segments, natural preservatives (such as extracts and essential oils) are experiencing rapid growth, outpacing traditional synthetic preservatives due to rising consumer awareness and demand for clean-label products.
Key Drivers in Germany:
- Strong food processing sector
- High per capita consumption of processed foods
- Favorable regulatory environment
- Advanced technological infrastructure
Dominance Analysis: Germany benefits from a highly developed food processing industry, supporting robust demand for preservatives. Its strong regulatory framework ensures high-quality products, while its favorable economic climate fosters investments in the sector.
Europe Food Preservatives Industry Product Innovations
Recent product innovations focus on developing natural and clean-label preservatives to meet growing consumer demands. Encapsulation technologies are enhancing the efficacy and stability of sensitive natural preservatives. The development of antimicrobial peptides and bacteriophages offers novel solutions for extending shelf-life and improving food safety. These innovations are improving market fit by addressing the rising demand for healthier and more sustainable alternatives to traditional preservatives.
Report Segmentation & Scope
This report segments the European food preservatives market based on type (natural and synthetic), application (meat, bakery, dairy, beverages, etc.), and region. Each segment offers unique growth prospects and competitive dynamics. Natural preservatives are expected to witness faster growth compared to synthetic preservatives. The meat processing segment has significant demand due to high volumes of processed meat consumption, while the bakery segment is also experiencing increasing demand for extended shelf-life products.
Key Drivers of Europe Food Preservatives Industry Growth
The growth of the European food preservatives market is driven by several factors, including the rising demand for processed and convenience foods, stringent food safety regulations, increasing consumer awareness of foodborne illnesses, and the growing preference for longer shelf-life products. Technological advancements in developing novel preservatives also contribute to market expansion. Furthermore, the increasing focus on sustainable and eco-friendly preservatives is pushing innovation and creating new market opportunities.
Challenges in the Europe Food Preservatives Industry Sector
The European food preservatives market faces challenges such as stringent regulatory hurdles, including rigorous testing and approval processes for new preservatives. Fluctuations in raw material prices and supply chain disruptions can impact production costs and profitability. Intense competition among established players and the emergence of new entrants also presents challenges. These factors collectively impact profitability and overall market growth.
Leading Players in the Europe Food Preservatives Industry Market
- Kerry Group PLC
- Brenntag Holding GmbH
- Tate & Lyle PLC
- Jungbunzlauer Suisse AG
- Koninklijke DSM N V
- DuPont de Nemours Inc
- Corbion NV
- Merck KGaA
- List Not Exhaustive
Key Developments in Europe Food Preservatives Industry Sector
- June 2023: Launch of a new natural preservative by Company X.
- October 2022: Merger between Company Y and Company Z, creating a larger market player.
- March 2021: Introduction of stricter regulations on the use of certain preservatives by the EU. (Further specific developments with dates and impacts on market dynamics would be included in the full report.)
Strategic Europe Food Preservatives Industry Market Outlook
The European food preservatives market presents significant growth potential, driven by the aforementioned factors. Companies can capitalize on this opportunity by focusing on innovation, developing natural and sustainable solutions, and effectively navigating regulatory landscapes. Strategic partnerships and collaborations can enhance market penetration and build a strong competitive edge. Focus on delivering high-quality, safe, and effective products will be crucial for sustained success in this dynamic market.
Europe Food Preservatives Industry Segmentation
-
1. Type
- 1.1. Natural
- 1.2. Synthetic
-
2. Application
- 2.1. Beverage
- 2.2. Dairy & Frozen Product
- 2.3. Bakery
- 2.4. Meat, Poultry & Seafood
- 2.5. Confectionery
- 2.6. Sauces & Salad Mixes
- 2.7. Others
Europe Food Preservatives Industry Segmentation By Geography
- 1. United Kingdom
- 2. Spain
- 3. Germany
- 4. Italy
- 5. Russia
- 6. France
- 7. Rest of Europe
Europe Food Preservatives Industry REPORT HIGHLIGHTS
| Aspects | Details |
|---|---|
| Study Period | 2019-2033 |
| Base Year | 2024 |
| Estimated Year | 2025 |
| Forecast Period | 2025-2033 |
| Historical Period | 2019-2024 |
| Growth Rate | CAGR of 4.23% from 2019-2033 |
| Segmentation |
|
Table of Contents
- 1. Introduction
- 1.1. Research Scope
- 1.2. Market Segmentation
- 1.3. Research Methodology
- 1.4. Definitions and Assumptions
- 2. Executive Summary
- 2.1. Introduction
- 3. Market Dynamics
- 3.1. Introduction
- 3.2. Market Drivers
- 3.3. Market Restrains
- 3.4. Market Trends
- 3.4.1. Beverage Application is driving the Market
- 4. Market Factor Analysis
- 4.1. Porters Five Forces
- 4.2. Supply/Value Chain
- 4.3. PESTEL analysis
- 4.4. Market Entropy
- 4.5. Patent/Trademark Analysis
- 5. Global Europe Food Preservatives Industry Analysis, Insights and Forecast, 2019-2031
- 5.1. Market Analysis, Insights and Forecast - by Type
- 5.1.1. Natural
- 5.1.2. Synthetic
- 5.2. Market Analysis, Insights and Forecast - by Application
- 5.2.1. Beverage
- 5.2.2. Dairy & Frozen Product
- 5.2.3. Bakery
- 5.2.4. Meat, Poultry & Seafood
- 5.2.5. Confectionery
- 5.2.6. Sauces & Salad Mixes
- 5.2.7. Others
- 5.3. Market Analysis, Insights and Forecast - by Region
- 5.3.1. United Kingdom
- 5.3.2. Spain
- 5.3.3. Germany
- 5.3.4. Italy
- 5.3.5. Russia
- 5.3.6. France
- 5.3.7. Rest of Europe
- 5.1. Market Analysis, Insights and Forecast - by Type
- 6. United Kingdom Europe Food Preservatives Industry Analysis, Insights and Forecast, 2019-2031
- 6.1. Market Analysis, Insights and Forecast - by Type
- 6.1.1. Natural
- 6.1.2. Synthetic
- 6.2. Market Analysis, Insights and Forecast - by Application
- 6.2.1. Beverage
- 6.2.2. Dairy & Frozen Product
- 6.2.3. Bakery
- 6.2.4. Meat, Poultry & Seafood
- 6.2.5. Confectionery
- 6.2.6. Sauces & Salad Mixes
- 6.2.7. Others
- 6.1. Market Analysis, Insights and Forecast - by Type
- 7. Spain Europe Food Preservatives Industry Analysis, Insights and Forecast, 2019-2031
- 7.1. Market Analysis, Insights and Forecast - by Type
- 7.1.1. Natural
- 7.1.2. Synthetic
- 7.2. Market Analysis, Insights and Forecast - by Application
- 7.2.1. Beverage
- 7.2.2. Dairy & Frozen Product
- 7.2.3. Bakery
- 7.2.4. Meat, Poultry & Seafood
- 7.2.5. Confectionery
- 7.2.6. Sauces & Salad Mixes
- 7.2.7. Others
- 7.1. Market Analysis, Insights and Forecast - by Type
- 8. Germany Europe Food Preservatives Industry Analysis, Insights and Forecast, 2019-2031
- 8.1. Market Analysis, Insights and Forecast - by Type
- 8.1.1. Natural
- 8.1.2. Synthetic
- 8.2. Market Analysis, Insights and Forecast - by Application
- 8.2.1. Beverage
- 8.2.2. Dairy & Frozen Product
- 8.2.3. Bakery
- 8.2.4. Meat, Poultry & Seafood
- 8.2.5. Confectionery
- 8.2.6. Sauces & Salad Mixes
- 8.2.7. Others
- 8.1. Market Analysis, Insights and Forecast - by Type
- 9. Italy Europe Food Preservatives Industry Analysis, Insights and Forecast, 2019-2031
- 9.1. Market Analysis, Insights and Forecast - by Type
- 9.1.1. Natural
- 9.1.2. Synthetic
- 9.2. Market Analysis, Insights and Forecast - by Application
- 9.2.1. Beverage
- 9.2.2. Dairy & Frozen Product
- 9.2.3. Bakery
- 9.2.4. Meat, Poultry & Seafood
- 9.2.5. Confectionery
- 9.2.6. Sauces & Salad Mixes
- 9.2.7. Others
- 9.1. Market Analysis, Insights and Forecast - by Type
- 10. Russia Europe Food Preservatives Industry Analysis, Insights and Forecast, 2019-2031
- 10.1. Market Analysis, Insights and Forecast - by Type
- 10.1.1. Natural
- 10.1.2. Synthetic
- 10.2. Market Analysis, Insights and Forecast - by Application
- 10.2.1. Beverage
- 10.2.2. Dairy & Frozen Product
- 10.2.3. Bakery
- 10.2.4. Meat, Poultry & Seafood
- 10.2.5. Confectionery
- 10.2.6. Sauces & Salad Mixes
- 10.2.7. Others
- 10.1. Market Analysis, Insights and Forecast - by Type
- 11. France Europe Food Preservatives Industry Analysis, Insights and Forecast, 2019-2031
- 11.1. Market Analysis, Insights and Forecast - by Type
- 11.1.1. Natural
- 11.1.2. Synthetic
- 11.2. Market Analysis, Insights and Forecast - by Application
- 11.2.1. Beverage
- 11.2.2. Dairy & Frozen Product
- 11.2.3. Bakery
- 11.2.4. Meat, Poultry & Seafood
- 11.2.5. Confectionery
- 11.2.6. Sauces & Salad Mixes
- 11.2.7. Others
- 11.1. Market Analysis, Insights and Forecast - by Type
- 12. Rest of Europe Europe Food Preservatives Industry Analysis, Insights and Forecast, 2019-2031
- 12.1. Market Analysis, Insights and Forecast - by Type
- 12.1.1. Natural
- 12.1.2. Synthetic
- 12.2. Market Analysis, Insights and Forecast - by Application
- 12.2.1. Beverage
- 12.2.2. Dairy & Frozen Product
- 12.2.3. Bakery
- 12.2.4. Meat, Poultry & Seafood
- 12.2.5. Confectionery
- 12.2.6. Sauces & Salad Mixes
- 12.2.7. Others
- 12.1. Market Analysis, Insights and Forecast - by Type
- 13. Competitive Analysis
- 13.1. Global Market Share Analysis 2024
- 13.2. Company Profiles
- 13.2.1 Kerry Group PLC
- 13.2.1.1. Overview
- 13.2.1.2. Products
- 13.2.1.3. SWOT Analysis
- 13.2.1.4. Recent Developments
- 13.2.1.5. Financials (Based on Availability)
- 13.2.2 Brenntag Holding GmbH
- 13.2.2.1. Overview
- 13.2.2.2. Products
- 13.2.2.3. SWOT Analysis
- 13.2.2.4. Recent Developments
- 13.2.2.5. Financials (Based on Availability)
- 13.2.3 Tate & Lyle PLC
- 13.2.3.1. Overview
- 13.2.3.2. Products
- 13.2.3.3. SWOT Analysis
- 13.2.3.4. Recent Developments
- 13.2.3.5. Financials (Based on Availability)
- 13.2.4 Jungbunzlauer Suisse AG
- 13.2.4.1. Overview
- 13.2.4.2. Products
- 13.2.4.3. SWOT Analysis
- 13.2.4.4. Recent Developments
- 13.2.4.5. Financials (Based on Availability)
- 13.2.5 Koninklijke DSM N V
- 13.2.5.1. Overview
- 13.2.5.2. Products
- 13.2.5.3. SWOT Analysis
- 13.2.5.4. Recent Developments
- 13.2.5.5. Financials (Based on Availability)
- 13.2.6 DuPont de Nemours Inc
- 13.2.6.1. Overview
- 13.2.6.2. Products
- 13.2.6.3. SWOT Analysis
- 13.2.6.4. Recent Developments
- 13.2.6.5. Financials (Based on Availability)
- 13.2.7 Corbion NV
- 13.2.7.1. Overview
- 13.2.7.2. Products
- 13.2.7.3. SWOT Analysis
- 13.2.7.4. Recent Developments
- 13.2.7.5. Financials (Based on Availability)
- 13.2.8 Merck KGaA*List Not Exhaustive
- 13.2.8.1. Overview
- 13.2.8.2. Products
- 13.2.8.3. SWOT Analysis
- 13.2.8.4. Recent Developments
- 13.2.8.5. Financials (Based on Availability)
- 13.2.1 Kerry Group PLC
List of Figures
- Figure 1: Global Europe Food Preservatives Industry Revenue Breakdown (Million, %) by Region 2024 & 2032
- Figure 2: United Kingdom Europe Food Preservatives Industry Revenue (Million), by Type 2024 & 2032
- Figure 3: United Kingdom Europe Food Preservatives Industry Revenue Share (%), by Type 2024 & 2032
- Figure 4: United Kingdom Europe Food Preservatives Industry Revenue (Million), by Application 2024 & 2032
- Figure 5: United Kingdom Europe Food Preservatives Industry Revenue Share (%), by Application 2024 & 2032
- Figure 6: United Kingdom Europe Food Preservatives Industry Revenue (Million), by Country 2024 & 2032
- Figure 7: United Kingdom Europe Food Preservatives Industry Revenue Share (%), by Country 2024 & 2032
- Figure 8: Spain Europe Food Preservatives Industry Revenue (Million), by Type 2024 & 2032
- Figure 9: Spain Europe Food Preservatives Industry Revenue Share (%), by Type 2024 & 2032
- Figure 10: Spain Europe Food Preservatives Industry Revenue (Million), by Application 2024 & 2032
- Figure 11: Spain Europe Food Preservatives Industry Revenue Share (%), by Application 2024 & 2032
- Figure 12: Spain Europe Food Preservatives Industry Revenue (Million), by Country 2024 & 2032
- Figure 13: Spain Europe Food Preservatives Industry Revenue Share (%), by Country 2024 & 2032
- Figure 14: Germany Europe Food Preservatives Industry Revenue (Million), by Type 2024 & 2032
- Figure 15: Germany Europe Food Preservatives Industry Revenue Share (%), by Type 2024 & 2032
- Figure 16: Germany Europe Food Preservatives Industry Revenue (Million), by Application 2024 & 2032
- Figure 17: Germany Europe Food Preservatives Industry Revenue Share (%), by Application 2024 & 2032
- Figure 18: Germany Europe Food Preservatives Industry Revenue (Million), by Country 2024 & 2032
- Figure 19: Germany Europe Food Preservatives Industry Revenue Share (%), by Country 2024 & 2032
- Figure 20: Italy Europe Food Preservatives Industry Revenue (Million), by Type 2024 & 2032
- Figure 21: Italy Europe Food Preservatives Industry Revenue Share (%), by Type 2024 & 2032
- Figure 22: Italy Europe Food Preservatives Industry Revenue (Million), by Application 2024 & 2032
- Figure 23: Italy Europe Food Preservatives Industry Revenue Share (%), by Application 2024 & 2032
- Figure 24: Italy Europe Food Preservatives Industry Revenue (Million), by Country 2024 & 2032
- Figure 25: Italy Europe Food Preservatives Industry Revenue Share (%), by Country 2024 & 2032
- Figure 26: Russia Europe Food Preservatives Industry Revenue (Million), by Type 2024 & 2032
- Figure 27: Russia Europe Food Preservatives Industry Revenue Share (%), by Type 2024 & 2032
- Figure 28: Russia Europe Food Preservatives Industry Revenue (Million), by Application 2024 & 2032
- Figure 29: Russia Europe Food Preservatives Industry Revenue Share (%), by Application 2024 & 2032
- Figure 30: Russia Europe Food Preservatives Industry Revenue (Million), by Country 2024 & 2032
- Figure 31: Russia Europe Food Preservatives Industry Revenue Share (%), by Country 2024 & 2032
- Figure 32: France Europe Food Preservatives Industry Revenue (Million), by Type 2024 & 2032
- Figure 33: France Europe Food Preservatives Industry Revenue Share (%), by Type 2024 & 2032
- Figure 34: France Europe Food Preservatives Industry Revenue (Million), by Application 2024 & 2032
- Figure 35: France Europe Food Preservatives Industry Revenue Share (%), by Application 2024 & 2032
- Figure 36: France Europe Food Preservatives Industry Revenue (Million), by Country 2024 & 2032
- Figure 37: France Europe Food Preservatives Industry Revenue Share (%), by Country 2024 & 2032
- Figure 38: Rest of Europe Europe Food Preservatives Industry Revenue (Million), by Type 2024 & 2032
- Figure 39: Rest of Europe Europe Food Preservatives Industry Revenue Share (%), by Type 2024 & 2032
- Figure 40: Rest of Europe Europe Food Preservatives Industry Revenue (Million), by Application 2024 & 2032
- Figure 41: Rest of Europe Europe Food Preservatives Industry Revenue Share (%), by Application 2024 & 2032
- Figure 42: Rest of Europe Europe Food Preservatives Industry Revenue (Million), by Country 2024 & 2032
- Figure 43: Rest of Europe Europe Food Preservatives Industry Revenue Share (%), by Country 2024 & 2032
List of Tables
- Table 1: Global Europe Food Preservatives Industry Revenue Million Forecast, by Region 2019 & 2032
- Table 2: Global Europe Food Preservatives Industry Revenue Million Forecast, by Type 2019 & 2032
- Table 3: Global Europe Food Preservatives Industry Revenue Million Forecast, by Application 2019 & 2032
- Table 4: Global Europe Food Preservatives Industry Revenue Million Forecast, by Region 2019 & 2032
- Table 5: Global Europe Food Preservatives Industry Revenue Million Forecast, by Type 2019 & 2032
- Table 6: Global Europe Food Preservatives Industry Revenue Million Forecast, by Application 2019 & 2032
- Table 7: Global Europe Food Preservatives Industry Revenue Million Forecast, by Country 2019 & 2032
- Table 8: Global Europe Food Preservatives Industry Revenue Million Forecast, by Type 2019 & 2032
- Table 9: Global Europe Food Preservatives Industry Revenue Million Forecast, by Application 2019 & 2032
- Table 10: Global Europe Food Preservatives Industry Revenue Million Forecast, by Country 2019 & 2032
- Table 11: Global Europe Food Preservatives Industry Revenue Million Forecast, by Type 2019 & 2032
- Table 12: Global Europe Food Preservatives Industry Revenue Million Forecast, by Application 2019 & 2032
- Table 13: Global Europe Food Preservatives Industry Revenue Million Forecast, by Country 2019 & 2032
- Table 14: Global Europe Food Preservatives Industry Revenue Million Forecast, by Type 2019 & 2032
- Table 15: Global Europe Food Preservatives Industry Revenue Million Forecast, by Application 2019 & 2032
- Table 16: Global Europe Food Preservatives Industry Revenue Million Forecast, by Country 2019 & 2032
- Table 17: Global Europe Food Preservatives Industry Revenue Million Forecast, by Type 2019 & 2032
- Table 18: Global Europe Food Preservatives Industry Revenue Million Forecast, by Application 2019 & 2032
- Table 19: Global Europe Food Preservatives Industry Revenue Million Forecast, by Country 2019 & 2032
- Table 20: Global Europe Food Preservatives Industry Revenue Million Forecast, by Type 2019 & 2032
- Table 21: Global Europe Food Preservatives Industry Revenue Million Forecast, by Application 2019 & 2032
- Table 22: Global Europe Food Preservatives Industry Revenue Million Forecast, by Country 2019 & 2032
- Table 23: Global Europe Food Preservatives Industry Revenue Million Forecast, by Type 2019 & 2032
- Table 24: Global Europe Food Preservatives Industry Revenue Million Forecast, by Application 2019 & 2032
- Table 25: Global Europe Food Preservatives Industry Revenue Million Forecast, by Country 2019 & 2032
Frequently Asked Questions
1. What is the projected Compound Annual Growth Rate (CAGR) of the Europe Food Preservatives Industry?
The projected CAGR is approximately 4.23%.
2. Which companies are prominent players in the Europe Food Preservatives Industry?
Key companies in the market include Kerry Group PLC, Brenntag Holding GmbH, Tate & Lyle PLC, Jungbunzlauer Suisse AG, Koninklijke DSM N V, DuPont de Nemours Inc, Corbion NV, Merck KGaA*List Not Exhaustive.
3. What are the main segments of the Europe Food Preservatives Industry?
The market segments include Type, Application.
4. Can you provide details about the market size?
The market size is estimated to be USD XX Million as of 2022.
5. What are some drivers contributing to market growth?
N/A
6. What are the notable trends driving market growth?
Beverage Application is driving the Market.
7. Are there any restraints impacting market growth?
N/A
8. Can you provide examples of recent developments in the market?
N/A
9. What pricing options are available for accessing the report?
Pricing options include single-user, multi-user, and enterprise licenses priced at USD 4750, USD 5250, and USD 8750 respectively.
10. Is the market size provided in terms of value or volume?
The market size is provided in terms of value, measured in Million.
11. Are there any specific market keywords associated with the report?
Yes, the market keyword associated with the report is "Europe Food Preservatives Industry," which aids in identifying and referencing the specific market segment covered.
12. How do I determine which pricing option suits my needs best?
The pricing options vary based on user requirements and access needs. Individual users may opt for single-user licenses, while businesses requiring broader access may choose multi-user or enterprise licenses for cost-effective access to the report.
13. Are there any additional resources or data provided in the Europe Food Preservatives Industry report?
While the report offers comprehensive insights, it's advisable to review the specific contents or supplementary materials provided to ascertain if additional resources or data are available.
14. How can I stay updated on further developments or reports in the Europe Food Preservatives Industry?
To stay informed about further developments, trends, and reports in the Europe Food Preservatives Industry, consider subscribing to industry newsletters, following relevant companies and organizations, or regularly checking reputable industry news sources and publications.
Methodology
Step 1 - Identification of Relevant Samples Size from Population Database


Step 2 - Approaches for Defining Global Market Size (Value, Volume* & Price*)

Note*: In applicable scenarios
Step 3 - Data Sources
Primary Research
- Web Analytics
- Survey Reports
- Research Institute
- Latest Research Reports
- Opinion Leaders
Secondary Research
- Annual Reports
- White Paper
- Latest Press Release
- Industry Association
- Paid Database
- Investor Presentations

Step 4 - Data Triangulation
Involves using different sources of information in order to increase the validity of a study
These sources are likely to be stakeholders in a program - participants, other researchers, program staff, other community members, and so on.
Then we put all data in single framework & apply various statistical tools to find out the dynamic on the market.
During the analysis stage, feedback from the stakeholder groups would be compared to determine areas of agreement as well as areas of divergence


