
Key Insights
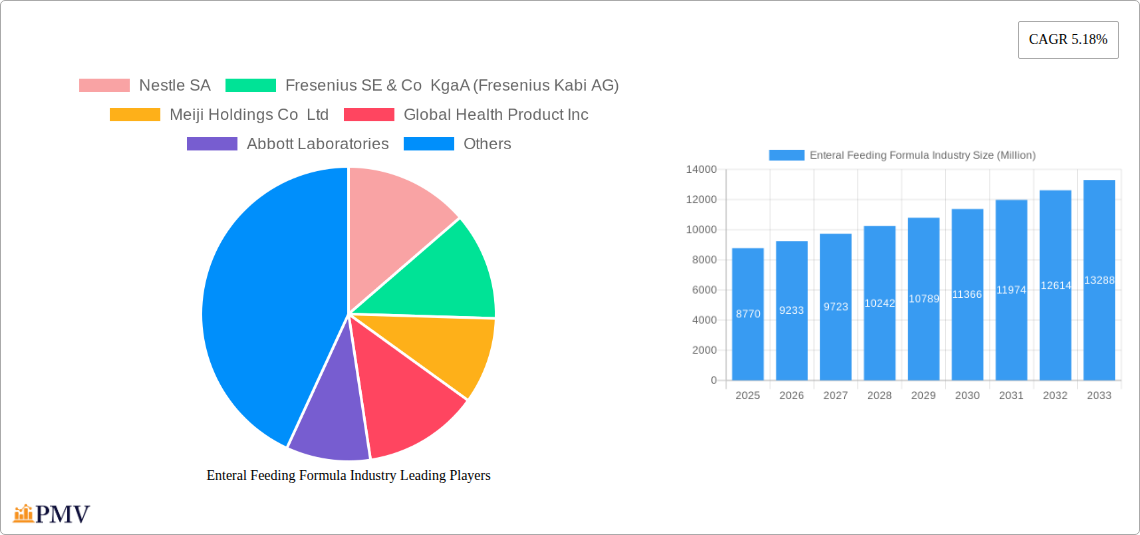
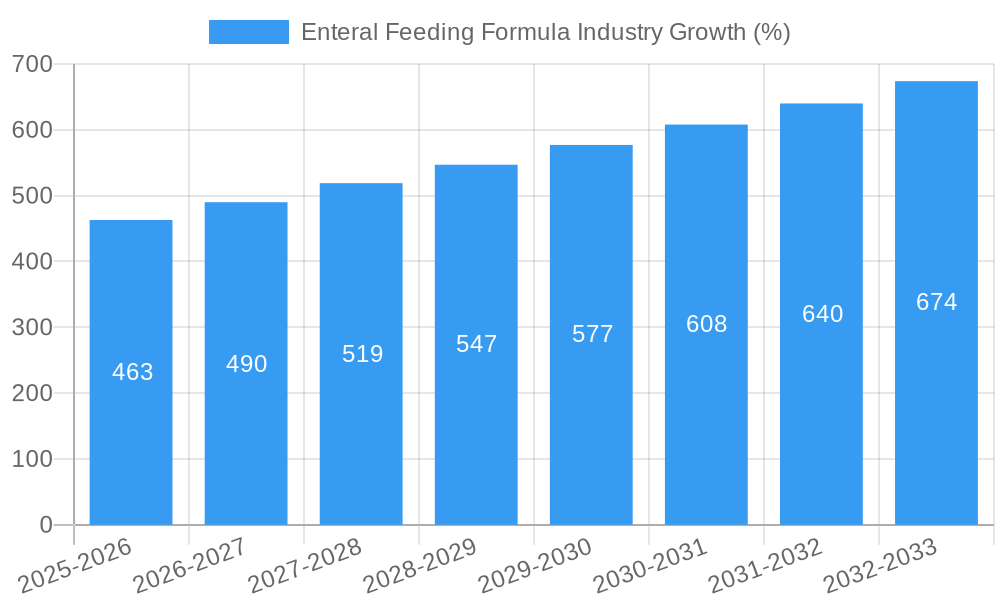
The global enteral feeding formula market, valued at $8.77 billion in 2025, is projected to experience robust growth, exhibiting a Compound Annual Growth Rate (CAGR) of 5.18% from 2025 to 2033. This expansion is driven by several key factors. The aging global population, coupled with a rising prevalence of chronic diseases like diabetes, oncology, and neurological disorders, necessitates increased reliance on enteral nutrition. Advances in formula technology, leading to specialized formulas catering to specific dietary needs and disease states, further fuel market growth. The increasing adoption of home healthcare settings also contributes to market expansion, as patients increasingly opt for convenient and cost-effective at-home care solutions. However, challenges exist, including the high cost of specialized formulas, stringent regulatory approvals, and potential adverse reactions in certain patients. The market segmentation reveals a diverse landscape, with Standard Formulas holding a significant share, followed by Disease-specific Formulas. Oncology and Neurology dominate the application segment, while Hospitals and Home Care Agencies represent major end-user channels. Key players such as Nestle SA, Fresenius Kabi AG, and Abbott Laboratories are strategically expanding their product portfolios and geographical reach to capitalize on the growing market demand. Competition is intense, with companies focusing on innovation, partnerships, and acquisitions to maintain a competitive edge.
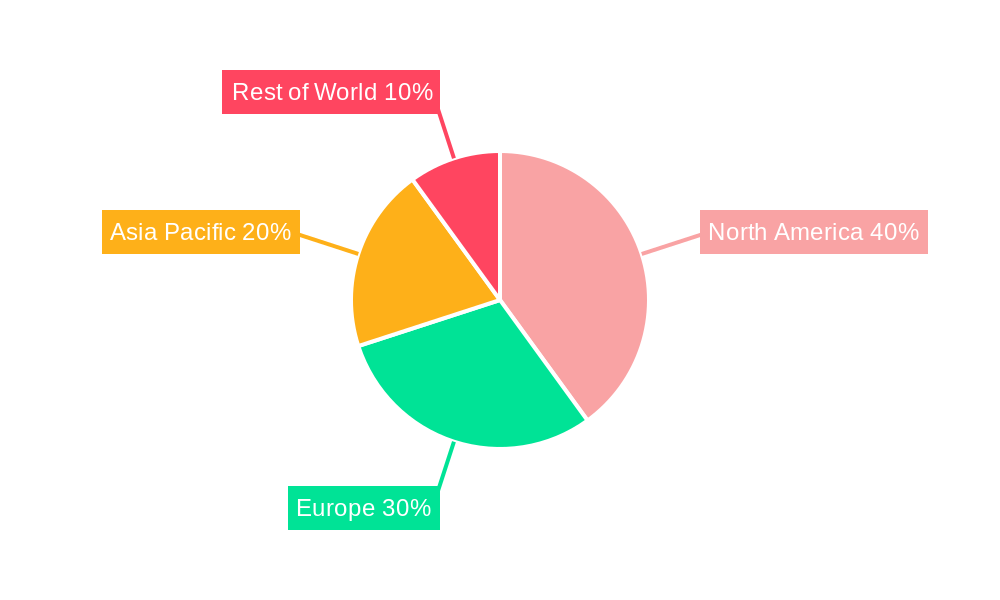
The geographical distribution of the market showcases significant regional disparities. North America and Europe currently hold substantial market shares, driven by high healthcare expenditure and established healthcare infrastructure. However, Asia-Pacific is anticipated to witness the fastest growth over the forecast period, fueled by rising disposable incomes, increasing awareness of nutritional needs, and expanding healthcare facilities. The market is expected to witness a continued shift towards specialized formulas tailored to specific medical conditions. Companies are investing heavily in research and development to introduce innovative products with enhanced efficacy and safety profiles. Furthermore, the adoption of digital health technologies, such as telehealth and remote patient monitoring, will contribute to market expansion by improving access to enteral nutrition services and patient care. This creates both opportunities and challenges for companies as they navigate regulatory landscapes and changing patient preferences.
Enteral Feeding Formula Industry Market Report: 2019-2033
This comprehensive report provides a detailed analysis of the global enteral feeding formula industry, offering invaluable insights for stakeholders across the value chain. The report covers the period 2019-2033, with a focus on the forecast period 2025-2033 and a base year of 2025. The study encompasses market sizing, segmentation, competitive landscape, growth drivers, challenges, and future outlook, providing actionable intelligence for informed decision-making.
Enteral Feeding Formula Industry Market Structure & Competitive Dynamics
The enteral feeding formula market is characterized by a moderately concentrated landscape with several multinational players holding significant market share. Key players such as Nestle SA, Fresenius SE & Co KgaA (Fresenius Kabi AG), Abbott Laboratories, and Danone SA (Nutricia) dominate the market, leveraging their established brand reputation and extensive distribution networks. However, smaller companies like Kate Farms and Victus Inc are also making inroads with innovative product offerings and specialized formulations. The market exhibits a dynamic competitive landscape shaped by factors including:
- Market Concentration: The top five players collectively hold an estimated xx% market share in 2025, indicating moderate consolidation.
- Innovation Ecosystems: Significant investments in research and development are driving innovation, particularly in areas such as disease-specific formulas and plant-based options.
- Regulatory Frameworks: Stringent regulatory requirements related to product safety and efficacy influence market entry and product development strategies.
- Product Substitutes: Parenteral nutrition represents a key substitute, but enteral feeding remains preferred for its ease of administration and cost-effectiveness in many applications.
- End-User Trends: Growing prevalence of chronic diseases like diabetes and oncology is driving demand for specialized enteral formulas.
- M&A Activities: The industry has witnessed several mergers and acquisitions (M&A) in recent years, with deal values ranging from USD xx Million to USD xx Million, reflecting consolidation efforts and expansion strategies. These activities often involve the acquisition of smaller companies with specialized technologies or market presence.
Enteral Feeding Formula Industry Industry Trends & Insights
The global enteral feeding formula market is projected to experience a Compound Annual Growth Rate (CAGR) of xx% during the forecast period (2025-2033). This growth is driven by several key factors:
- Rising Prevalence of Chronic Diseases: The increasing incidence of chronic diseases, such as diabetes, cancer, and neurological disorders, significantly fuels the demand for specialized enteral nutrition solutions.
- Aging Population: The global aging population, particularly in developed nations, contributes to a rise in individuals requiring enteral nutrition support due to age-related health issues.
- Technological Advancements: Ongoing technological advancements in formula development, including the use of novel ingredients and improved delivery systems, enhance product efficacy and patient compliance.
- Increased Healthcare Spending: Rising healthcare expenditures globally provide impetus for enhanced access to advanced medical nutrition therapies like enteral feeding formulas.
- Shifting Consumer Preferences: A growing preference for convenient, palatable, and nutritionally complete formulations influences product development and marketing strategies within the industry. Market penetration of plant-based options is also on the rise, with a projected xx% market share by 2033.
Dominant Markets & Segments in Enteral Feeding Formula Industry
The North American region is currently the leading market for enteral feeding formulas, driven by factors such as high healthcare expenditure, a substantial aging population, and robust healthcare infrastructure. However, strong growth is anticipated in emerging markets in Asia-Pacific and Latin America.
- By Product: Disease-specific formulas are experiencing faster growth compared to standard formulas due to the rising prevalence of chronic illnesses.
- By Application: Oncology and critical care applications constitute significant segments, with strong demand driven by the increasing number of cancer patients and critically ill individuals.
- By End User: Hospitals represent the largest end-user segment, followed by home care agencies and hospices, with the latter showing faster growth due to an increasing preference for home-based care.
- By Distribution Channel: Hospitals remain the dominant distribution channel, though retail and online pharmacies are gaining traction, particularly for standard formulas and certain specialized products. Key drivers include the ease of access and growing e-commerce penetration.
Key Drivers of Regional Dominance:
- North America: High healthcare expenditure, advanced healthcare infrastructure, and a large aging population.
- Europe: Strong healthcare systems and increasing prevalence of chronic diseases.
- Asia-Pacific: Rapidly growing population, rising healthcare awareness, and increasing disposable incomes.
Enteral Feeding Formula Industry Product Innovations
Recent product innovations focus on enhanced palatability, improved nutrient profiles, and specialized formulations catering to specific disease conditions. The industry is witnessing a shift towards plant-based options and convenient ready-to-use formulations. Technological advancements in delivery systems, such as improved pumps and feeding tubes, are also enhancing patient experience and convenience. These advancements cater to increasing consumer demand for convenient and palatable products.
Report Segmentation & Scope
This report segments the enteral feeding formula market across several key parameters:
- By Product: Standard Formulas and Disease-Specific Formulas. The Disease-Specific segment shows higher projected growth due to the prevalence of chronic conditions.
- By Application: Oncology, Neurology, Critical Care, Diabetes, Gastroenterology, and Other Applications. Oncology and Critical Care are the fastest-growing segments.
- By End User: Hospitals, Home Care Agencies and Hospices, and Other End Users. Home Care is a high-growth area driven by the trend of aging at home.
- By Distribution Channel: Hospitals, Retail Pharmacies, and Online Pharmacies. Online pharmacies show promising growth potential. Each segment's market size, growth projections, and competitive dynamics are analyzed in detail within the report.
Key Drivers of Enteral Feeding Formula Industry Growth
Several factors contribute to the growth of the enteral feeding formula market:
- Technological advancements: Development of disease-specific formulas, improved delivery systems, and convenient formats are driving market growth.
- Economic factors: Rising disposable incomes in emerging economies and increased healthcare spending in developed countries are positively impacting the market.
- Regulatory support: Government initiatives promoting better healthcare and nutritional well-being are contributing to market expansion.
Challenges in the Enteral Feeding Formula Industry Sector
Despite significant growth potential, the enteral feeding formula market faces certain challenges:
- Stringent regulatory approvals: The process for obtaining regulatory approvals for new products can be lengthy and expensive.
- Supply chain disruptions: Global events and logistical challenges can affect the availability of raw materials and finished goods.
- Competitive pressures: The market is characterized by intense competition among established players and new entrants. This pressure impacts pricing strategies and profitability margins.
Leading Players in the Enteral Feeding Formula Industry Market
- Nestle SA
- Fresenius SE & Co KgaA (Fresenius Kabi AG)
- Meiji Holdings Co Ltd
- Abbott Laboratories
- Danone SA (Nutricia)
- Functional Formularies
- Hormel Foods Corporation
- B Braun Melsungen AG
- Victus Inc
- Reckitt Benckiser Group plc (Mead Johnson)
- Kate Farms
Key Developments in Enteral Feeding Formula Industry Sector
- September 2022: Kate Farms secured USD 75 Million in Series C funding, boosting its research and development efforts in plant-based clinical nutrition.
- September 2022: Kate Farms launched Adult Standard 1.4, a high-calorie medical formula in chocolate flavor, enhancing product offerings and market appeal.
Strategic Enteral Feeding Formula Industry Market Outlook
The enteral feeding formula market exhibits strong growth prospects, driven by the rising prevalence of chronic diseases, an aging population, and technological advancements. Strategic opportunities exist in developing innovative, customized formulations, expanding into emerging markets, and strengthening digital distribution channels. Companies focusing on product differentiation, strong R&D, and strategic partnerships will be well-positioned to capitalize on the market's growth potential.
Enteral Feeding Formula Industry Segmentation
-
1. Product
- 1.1. Standard Formulas
- 1.2. Disease-specific Formulas
-
2. Application
- 2.1. Oncology
- 2.2. Neurology
- 2.3. Critical Care
- 2.4. Diabetes
- 2.5. Gastroenterology
- 2.6. Other Applications
-
3. End User
- 3.1. Hospital
- 3.2. Home Care Agencies and Hospices
- 3.3. Other End Users
-
4. Distributuion Channel
- 4.1. Hospitals
- 4.2. Retail Pharmacies
- 4.3. Online Pharmacies
Enteral Feeding Formula Industry Segmentation By Geography
-
1. North America
- 1.1. United States
- 1.2. Canada
- 1.3. Mexico
-
2. Europe
- 2.1. Germany
- 2.2. United Kingdom
- 2.3. France
- 2.4. Italy
- 2.5. Spain
- 2.6. Rest of Europe
-
3. Asia Pacific
- 3.1. China
- 3.2. Japan
- 3.3. India
- 3.4. Australia
- 3.5. South Korea
- 3.6. Rest of Asia Pacific
-
4. Middle East and Africa
- 4.1. GCC
- 4.2. South Africa
- 4.3. Rest of Middle East and Africa
-
5. South America
- 5.1. Brazil
- 5.2. Argentina
- 5.3. Rest of South America
Enteral Feeding Formula Industry REPORT HIGHLIGHTS
| Aspects | Details |
|---|---|
| Study Period | 2019-2033 |
| Base Year | 2024 |
| Estimated Year | 2025 |
| Forecast Period | 2025-2033 |
| Historical Period | 2019-2024 |
| Growth Rate | CAGR of 5.18% from 2019-2033 |
| Segmentation |
|
Table of Contents
- 1. Introduction
- 1.1. Research Scope
- 1.2. Market Segmentation
- 1.3. Research Methodology
- 1.4. Definitions and Assumptions
- 2. Executive Summary
- 2.1. Introduction
- 3. Market Dynamics
- 3.1. Introduction
- 3.2. Market Drivers
- 3.2.1. Increasing Prevalence of Metabolic and Chronic Diseases; Increasing Spending on Patient Care; Growing Geriatric Population
- 3.3. Market Restrains
- 3.3.1. Complications Associated with Enteral Nutrition; High Cost and Low Adherence Rates in Developing Countries
- 3.4. Market Trends
- 3.4.1. Oncology Segment is Expected to Hold a Significant Market Share in the Enteral Feeding Formulas Market
- 4. Market Factor Analysis
- 4.1. Porters Five Forces
- 4.2. Supply/Value Chain
- 4.3. PESTEL analysis
- 4.4. Market Entropy
- 4.5. Patent/Trademark Analysis
- 5. Global Enteral Feeding Formula Industry Analysis, Insights and Forecast, 2019-2031
- 5.1. Market Analysis, Insights and Forecast - by Product
- 5.1.1. Standard Formulas
- 5.1.2. Disease-specific Formulas
- 5.2. Market Analysis, Insights and Forecast - by Application
- 5.2.1. Oncology
- 5.2.2. Neurology
- 5.2.3. Critical Care
- 5.2.4. Diabetes
- 5.2.5. Gastroenterology
- 5.2.6. Other Applications
- 5.3. Market Analysis, Insights and Forecast - by End User
- 5.3.1. Hospital
- 5.3.2. Home Care Agencies and Hospices
- 5.3.3. Other End Users
- 5.4. Market Analysis, Insights and Forecast - by Distributuion Channel
- 5.4.1. Hospitals
- 5.4.2. Retail Pharmacies
- 5.4.3. Online Pharmacies
- 5.5. Market Analysis, Insights and Forecast - by Region
- 5.5.1. North America
- 5.5.2. Europe
- 5.5.3. Asia Pacific
- 5.5.4. Middle East and Africa
- 5.5.5. South America
- 5.1. Market Analysis, Insights and Forecast - by Product
- 6. North America Enteral Feeding Formula Industry Analysis, Insights and Forecast, 2019-2031
- 6.1. Market Analysis, Insights and Forecast - by Product
- 6.1.1. Standard Formulas
- 6.1.2. Disease-specific Formulas
- 6.2. Market Analysis, Insights and Forecast - by Application
- 6.2.1. Oncology
- 6.2.2. Neurology
- 6.2.3. Critical Care
- 6.2.4. Diabetes
- 6.2.5. Gastroenterology
- 6.2.6. Other Applications
- 6.3. Market Analysis, Insights and Forecast - by End User
- 6.3.1. Hospital
- 6.3.2. Home Care Agencies and Hospices
- 6.3.3. Other End Users
- 6.4. Market Analysis, Insights and Forecast - by Distributuion Channel
- 6.4.1. Hospitals
- 6.4.2. Retail Pharmacies
- 6.4.3. Online Pharmacies
- 6.1. Market Analysis, Insights and Forecast - by Product
- 7. Europe Enteral Feeding Formula Industry Analysis, Insights and Forecast, 2019-2031
- 7.1. Market Analysis, Insights and Forecast - by Product
- 7.1.1. Standard Formulas
- 7.1.2. Disease-specific Formulas
- 7.2. Market Analysis, Insights and Forecast - by Application
- 7.2.1. Oncology
- 7.2.2. Neurology
- 7.2.3. Critical Care
- 7.2.4. Diabetes
- 7.2.5. Gastroenterology
- 7.2.6. Other Applications
- 7.3. Market Analysis, Insights and Forecast - by End User
- 7.3.1. Hospital
- 7.3.2. Home Care Agencies and Hospices
- 7.3.3. Other End Users
- 7.4. Market Analysis, Insights and Forecast - by Distributuion Channel
- 7.4.1. Hospitals
- 7.4.2. Retail Pharmacies
- 7.4.3. Online Pharmacies
- 7.1. Market Analysis, Insights and Forecast - by Product
- 8. Asia Pacific Enteral Feeding Formula Industry Analysis, Insights and Forecast, 2019-2031
- 8.1. Market Analysis, Insights and Forecast - by Product
- 8.1.1. Standard Formulas
- 8.1.2. Disease-specific Formulas
- 8.2. Market Analysis, Insights and Forecast - by Application
- 8.2.1. Oncology
- 8.2.2. Neurology
- 8.2.3. Critical Care
- 8.2.4. Diabetes
- 8.2.5. Gastroenterology
- 8.2.6. Other Applications
- 8.3. Market Analysis, Insights and Forecast - by End User
- 8.3.1. Hospital
- 8.3.2. Home Care Agencies and Hospices
- 8.3.3. Other End Users
- 8.4. Market Analysis, Insights and Forecast - by Distributuion Channel
- 8.4.1. Hospitals
- 8.4.2. Retail Pharmacies
- 8.4.3. Online Pharmacies
- 8.1. Market Analysis, Insights and Forecast - by Product
- 9. Middle East and Africa Enteral Feeding Formula Industry Analysis, Insights and Forecast, 2019-2031
- 9.1. Market Analysis, Insights and Forecast - by Product
- 9.1.1. Standard Formulas
- 9.1.2. Disease-specific Formulas
- 9.2. Market Analysis, Insights and Forecast - by Application
- 9.2.1. Oncology
- 9.2.2. Neurology
- 9.2.3. Critical Care
- 9.2.4. Diabetes
- 9.2.5. Gastroenterology
- 9.2.6. Other Applications
- 9.3. Market Analysis, Insights and Forecast - by End User
- 9.3.1. Hospital
- 9.3.2. Home Care Agencies and Hospices
- 9.3.3. Other End Users
- 9.4. Market Analysis, Insights and Forecast - by Distributuion Channel
- 9.4.1. Hospitals
- 9.4.2. Retail Pharmacies
- 9.4.3. Online Pharmacies
- 9.1. Market Analysis, Insights and Forecast - by Product
- 10. South America Enteral Feeding Formula Industry Analysis, Insights and Forecast, 2019-2031
- 10.1. Market Analysis, Insights and Forecast - by Product
- 10.1.1. Standard Formulas
- 10.1.2. Disease-specific Formulas
- 10.2. Market Analysis, Insights and Forecast - by Application
- 10.2.1. Oncology
- 10.2.2. Neurology
- 10.2.3. Critical Care
- 10.2.4. Diabetes
- 10.2.5. Gastroenterology
- 10.2.6. Other Applications
- 10.3. Market Analysis, Insights and Forecast - by End User
- 10.3.1. Hospital
- 10.3.2. Home Care Agencies and Hospices
- 10.3.3. Other End Users
- 10.4. Market Analysis, Insights and Forecast - by Distributuion Channel
- 10.4.1. Hospitals
- 10.4.2. Retail Pharmacies
- 10.4.3. Online Pharmacies
- 10.1. Market Analysis, Insights and Forecast - by Product
- 11. North America Enteral Feeding Formula Industry Analysis, Insights and Forecast, 2019-2031
- 11.1. Market Analysis, Insights and Forecast - By Country/Sub-region
- 11.1.1 United States
- 11.1.2 Canada
- 11.1.3 Mexico
- 12. South America Enteral Feeding Formula Industry Analysis, Insights and Forecast, 2019-2031
- 12.1. Market Analysis, Insights and Forecast - By Country/Sub-region
- 12.1.1 Brazil
- 12.1.2 Mexico
- 12.1.3 Rest of South America
- 13. Europe Enteral Feeding Formula Industry Analysis, Insights and Forecast, 2019-2031
- 13.1. Market Analysis, Insights and Forecast - By Country/Sub-region
- 13.1.1 United Kingdom
- 13.1.2 Germany
- 13.1.3 France
- 13.1.4 Italy
- 13.1.5 Spain
- 13.1.6 Russia
- 13.1.7 Rest of Europe
- 14. Asia Pacific Enteral Feeding Formula Industry Analysis, Insights and Forecast, 2019-2031
- 14.1. Market Analysis, Insights and Forecast - By Country/Sub-region
- 14.1.1 China
- 14.1.2 Japan
- 14.1.3 India
- 14.1.4 South Korea
- 14.1.5 Taiwan
- 14.1.6 Australia
- 14.1.7 Rest of Asia-Pacific
- 15. MEA Enteral Feeding Formula Industry Analysis, Insights and Forecast, 2019-2031
- 15.1. Market Analysis, Insights and Forecast - By Country/Sub-region
- 15.1.1 Middle East
- 15.1.2 Africa
- 16. Competitive Analysis
- 16.1. Global Market Share Analysis 2024
- 16.2. Company Profiles
- 16.2.1 Nestle SA
- 16.2.1.1. Overview
- 16.2.1.2. Products
- 16.2.1.3. SWOT Analysis
- 16.2.1.4. Recent Developments
- 16.2.1.5. Financials (Based on Availability)
- 16.2.2 Fresenius SE & Co KgaA (Fresenius Kabi AG)
- 16.2.2.1. Overview
- 16.2.2.2. Products
- 16.2.2.3. SWOT Analysis
- 16.2.2.4. Recent Developments
- 16.2.2.5. Financials (Based on Availability)
- 16.2.3 Meiji Holdings Co Ltd
- 16.2.3.1. Overview
- 16.2.3.2. Products
- 16.2.3.3. SWOT Analysis
- 16.2.3.4. Recent Developments
- 16.2.3.5. Financials (Based on Availability)
- 16.2.4 Global Health Product Inc
- 16.2.4.1. Overview
- 16.2.4.2. Products
- 16.2.4.3. SWOT Analysis
- 16.2.4.4. Recent Developments
- 16.2.4.5. Financials (Based on Availability)
- 16.2.5 Abbott Laboratories
- 16.2.5.1. Overview
- 16.2.5.2. Products
- 16.2.5.3. SWOT Analysis
- 16.2.5.4. Recent Developments
- 16.2.5.5. Financials (Based on Availability)
- 16.2.6 Danone SA (Nutricia)
- 16.2.6.1. Overview
- 16.2.6.2. Products
- 16.2.6.3. SWOT Analysis
- 16.2.6.4. Recent Developments
- 16.2.6.5. Financials (Based on Availability)
- 16.2.7 Functional Formularies*List Not Exhaustive
- 16.2.7.1. Overview
- 16.2.7.2. Products
- 16.2.7.3. SWOT Analysis
- 16.2.7.4. Recent Developments
- 16.2.7.5. Financials (Based on Availability)
- 16.2.8 Hormel Foods Corporation
- 16.2.8.1. Overview
- 16.2.8.2. Products
- 16.2.8.3. SWOT Analysis
- 16.2.8.4. Recent Developments
- 16.2.8.5. Financials (Based on Availability)
- 16.2.9 B Braun Melsungen AG
- 16.2.9.1. Overview
- 16.2.9.2. Products
- 16.2.9.3. SWOT Analysis
- 16.2.9.4. Recent Developments
- 16.2.9.5. Financials (Based on Availability)
- 16.2.10 Victus Inc
- 16.2.10.1. Overview
- 16.2.10.2. Products
- 16.2.10.3. SWOT Analysis
- 16.2.10.4. Recent Developments
- 16.2.10.5. Financials (Based on Availability)
- 16.2.11 Reckitt Benckiser Group plc (Mead Johnson)
- 16.2.11.1. Overview
- 16.2.11.2. Products
- 16.2.11.3. SWOT Analysis
- 16.2.11.4. Recent Developments
- 16.2.11.5. Financials (Based on Availability)
- 16.2.12 Kate Farms
- 16.2.12.1. Overview
- 16.2.12.2. Products
- 16.2.12.3. SWOT Analysis
- 16.2.12.4. Recent Developments
- 16.2.12.5. Financials (Based on Availability)
- 16.2.1 Nestle SA
List of Figures
- Figure 1: Global Enteral Feeding Formula Industry Revenue Breakdown (Million, %) by Region 2024 & 2032
- Figure 2: North America Enteral Feeding Formula Industry Revenue (Million), by Country 2024 & 2032
- Figure 3: North America Enteral Feeding Formula Industry Revenue Share (%), by Country 2024 & 2032
- Figure 4: South America Enteral Feeding Formula Industry Revenue (Million), by Country 2024 & 2032
- Figure 5: South America Enteral Feeding Formula Industry Revenue Share (%), by Country 2024 & 2032
- Figure 6: Europe Enteral Feeding Formula Industry Revenue (Million), by Country 2024 & 2032
- Figure 7: Europe Enteral Feeding Formula Industry Revenue Share (%), by Country 2024 & 2032
- Figure 8: Asia Pacific Enteral Feeding Formula Industry Revenue (Million), by Country 2024 & 2032
- Figure 9: Asia Pacific Enteral Feeding Formula Industry Revenue Share (%), by Country 2024 & 2032
- Figure 10: MEA Enteral Feeding Formula Industry Revenue (Million), by Country 2024 & 2032
- Figure 11: MEA Enteral Feeding Formula Industry Revenue Share (%), by Country 2024 & 2032
- Figure 12: North America Enteral Feeding Formula Industry Revenue (Million), by Product 2024 & 2032
- Figure 13: North America Enteral Feeding Formula Industry Revenue Share (%), by Product 2024 & 2032
- Figure 14: North America Enteral Feeding Formula Industry Revenue (Million), by Application 2024 & 2032
- Figure 15: North America Enteral Feeding Formula Industry Revenue Share (%), by Application 2024 & 2032
- Figure 16: North America Enteral Feeding Formula Industry Revenue (Million), by End User 2024 & 2032
- Figure 17: North America Enteral Feeding Formula Industry Revenue Share (%), by End User 2024 & 2032
- Figure 18: North America Enteral Feeding Formula Industry Revenue (Million), by Distributuion Channel 2024 & 2032
- Figure 19: North America Enteral Feeding Formula Industry Revenue Share (%), by Distributuion Channel 2024 & 2032
- Figure 20: North America Enteral Feeding Formula Industry Revenue (Million), by Country 2024 & 2032
- Figure 21: North America Enteral Feeding Formula Industry Revenue Share (%), by Country 2024 & 2032
- Figure 22: Europe Enteral Feeding Formula Industry Revenue (Million), by Product 2024 & 2032
- Figure 23: Europe Enteral Feeding Formula Industry Revenue Share (%), by Product 2024 & 2032
- Figure 24: Europe Enteral Feeding Formula Industry Revenue (Million), by Application 2024 & 2032
- Figure 25: Europe Enteral Feeding Formula Industry Revenue Share (%), by Application 2024 & 2032
- Figure 26: Europe Enteral Feeding Formula Industry Revenue (Million), by End User 2024 & 2032
- Figure 27: Europe Enteral Feeding Formula Industry Revenue Share (%), by End User 2024 & 2032
- Figure 28: Europe Enteral Feeding Formula Industry Revenue (Million), by Distributuion Channel 2024 & 2032
- Figure 29: Europe Enteral Feeding Formula Industry Revenue Share (%), by Distributuion Channel 2024 & 2032
- Figure 30: Europe Enteral Feeding Formula Industry Revenue (Million), by Country 2024 & 2032
- Figure 31: Europe Enteral Feeding Formula Industry Revenue Share (%), by Country 2024 & 2032
- Figure 32: Asia Pacific Enteral Feeding Formula Industry Revenue (Million), by Product 2024 & 2032
- Figure 33: Asia Pacific Enteral Feeding Formula Industry Revenue Share (%), by Product 2024 & 2032
- Figure 34: Asia Pacific Enteral Feeding Formula Industry Revenue (Million), by Application 2024 & 2032
- Figure 35: Asia Pacific Enteral Feeding Formula Industry Revenue Share (%), by Application 2024 & 2032
- Figure 36: Asia Pacific Enteral Feeding Formula Industry Revenue (Million), by End User 2024 & 2032
- Figure 37: Asia Pacific Enteral Feeding Formula Industry Revenue Share (%), by End User 2024 & 2032
- Figure 38: Asia Pacific Enteral Feeding Formula Industry Revenue (Million), by Distributuion Channel 2024 & 2032
- Figure 39: Asia Pacific Enteral Feeding Formula Industry Revenue Share (%), by Distributuion Channel 2024 & 2032
- Figure 40: Asia Pacific Enteral Feeding Formula Industry Revenue (Million), by Country 2024 & 2032
- Figure 41: Asia Pacific Enteral Feeding Formula Industry Revenue Share (%), by Country 2024 & 2032
- Figure 42: Middle East and Africa Enteral Feeding Formula Industry Revenue (Million), by Product 2024 & 2032
- Figure 43: Middle East and Africa Enteral Feeding Formula Industry Revenue Share (%), by Product 2024 & 2032
- Figure 44: Middle East and Africa Enteral Feeding Formula Industry Revenue (Million), by Application 2024 & 2032
- Figure 45: Middle East and Africa Enteral Feeding Formula Industry Revenue Share (%), by Application 2024 & 2032
- Figure 46: Middle East and Africa Enteral Feeding Formula Industry Revenue (Million), by End User 2024 & 2032
- Figure 47: Middle East and Africa Enteral Feeding Formula Industry Revenue Share (%), by End User 2024 & 2032
- Figure 48: Middle East and Africa Enteral Feeding Formula Industry Revenue (Million), by Distributuion Channel 2024 & 2032
- Figure 49: Middle East and Africa Enteral Feeding Formula Industry Revenue Share (%), by Distributuion Channel 2024 & 2032
- Figure 50: Middle East and Africa Enteral Feeding Formula Industry Revenue (Million), by Country 2024 & 2032
- Figure 51: Middle East and Africa Enteral Feeding Formula Industry Revenue Share (%), by Country 2024 & 2032
- Figure 52: South America Enteral Feeding Formula Industry Revenue (Million), by Product 2024 & 2032
- Figure 53: South America Enteral Feeding Formula Industry Revenue Share (%), by Product 2024 & 2032
- Figure 54: South America Enteral Feeding Formula Industry Revenue (Million), by Application 2024 & 2032
- Figure 55: South America Enteral Feeding Formula Industry Revenue Share (%), by Application 2024 & 2032
- Figure 56: South America Enteral Feeding Formula Industry Revenue (Million), by End User 2024 & 2032
- Figure 57: South America Enteral Feeding Formula Industry Revenue Share (%), by End User 2024 & 2032
- Figure 58: South America Enteral Feeding Formula Industry Revenue (Million), by Distributuion Channel 2024 & 2032
- Figure 59: South America Enteral Feeding Formula Industry Revenue Share (%), by Distributuion Channel 2024 & 2032
- Figure 60: South America Enteral Feeding Formula Industry Revenue (Million), by Country 2024 & 2032
- Figure 61: South America Enteral Feeding Formula Industry Revenue Share (%), by Country 2024 & 2032
List of Tables
- Table 1: Global Enteral Feeding Formula Industry Revenue Million Forecast, by Region 2019 & 2032
- Table 2: Global Enteral Feeding Formula Industry Revenue Million Forecast, by Product 2019 & 2032
- Table 3: Global Enteral Feeding Formula Industry Revenue Million Forecast, by Application 2019 & 2032
- Table 4: Global Enteral Feeding Formula Industry Revenue Million Forecast, by End User 2019 & 2032
- Table 5: Global Enteral Feeding Formula Industry Revenue Million Forecast, by Distributuion Channel 2019 & 2032
- Table 6: Global Enteral Feeding Formula Industry Revenue Million Forecast, by Region 2019 & 2032
- Table 7: Global Enteral Feeding Formula Industry Revenue Million Forecast, by Country 2019 & 2032
- Table 8: United States Enteral Feeding Formula Industry Revenue (Million) Forecast, by Application 2019 & 2032
- Table 9: Canada Enteral Feeding Formula Industry Revenue (Million) Forecast, by Application 2019 & 2032
- Table 10: Mexico Enteral Feeding Formula Industry Revenue (Million) Forecast, by Application 2019 & 2032
- Table 11: Global Enteral Feeding Formula Industry Revenue Million Forecast, by Country 2019 & 2032
- Table 12: Brazil Enteral Feeding Formula Industry Revenue (Million) Forecast, by Application 2019 & 2032
- Table 13: Mexico Enteral Feeding Formula Industry Revenue (Million) Forecast, by Application 2019 & 2032
- Table 14: Rest of South America Enteral Feeding Formula Industry Revenue (Million) Forecast, by Application 2019 & 2032
- Table 15: Global Enteral Feeding Formula Industry Revenue Million Forecast, by Country 2019 & 2032
- Table 16: United Kingdom Enteral Feeding Formula Industry Revenue (Million) Forecast, by Application 2019 & 2032
- Table 17: Germany Enteral Feeding Formula Industry Revenue (Million) Forecast, by Application 2019 & 2032
- Table 18: France Enteral Feeding Formula Industry Revenue (Million) Forecast, by Application 2019 & 2032
- Table 19: Italy Enteral Feeding Formula Industry Revenue (Million) Forecast, by Application 2019 & 2032
- Table 20: Spain Enteral Feeding Formula Industry Revenue (Million) Forecast, by Application 2019 & 2032
- Table 21: Russia Enteral Feeding Formula Industry Revenue (Million) Forecast, by Application 2019 & 2032
- Table 22: Rest of Europe Enteral Feeding Formula Industry Revenue (Million) Forecast, by Application 2019 & 2032
- Table 23: Global Enteral Feeding Formula Industry Revenue Million Forecast, by Country 2019 & 2032
- Table 24: China Enteral Feeding Formula Industry Revenue (Million) Forecast, by Application 2019 & 2032
- Table 25: Japan Enteral Feeding Formula Industry Revenue (Million) Forecast, by Application 2019 & 2032
- Table 26: India Enteral Feeding Formula Industry Revenue (Million) Forecast, by Application 2019 & 2032
- Table 27: South Korea Enteral Feeding Formula Industry Revenue (Million) Forecast, by Application 2019 & 2032
- Table 28: Taiwan Enteral Feeding Formula Industry Revenue (Million) Forecast, by Application 2019 & 2032
- Table 29: Australia Enteral Feeding Formula Industry Revenue (Million) Forecast, by Application 2019 & 2032
- Table 30: Rest of Asia-Pacific Enteral Feeding Formula Industry Revenue (Million) Forecast, by Application 2019 & 2032
- Table 31: Global Enteral Feeding Formula Industry Revenue Million Forecast, by Country 2019 & 2032
- Table 32: Middle East Enteral Feeding Formula Industry Revenue (Million) Forecast, by Application 2019 & 2032
- Table 33: Africa Enteral Feeding Formula Industry Revenue (Million) Forecast, by Application 2019 & 2032
- Table 34: Global Enteral Feeding Formula Industry Revenue Million Forecast, by Product 2019 & 2032
- Table 35: Global Enteral Feeding Formula Industry Revenue Million Forecast, by Application 2019 & 2032
- Table 36: Global Enteral Feeding Formula Industry Revenue Million Forecast, by End User 2019 & 2032
- Table 37: Global Enteral Feeding Formula Industry Revenue Million Forecast, by Distributuion Channel 2019 & 2032
- Table 38: Global Enteral Feeding Formula Industry Revenue Million Forecast, by Country 2019 & 2032
- Table 39: United States Enteral Feeding Formula Industry Revenue (Million) Forecast, by Application 2019 & 2032
- Table 40: Canada Enteral Feeding Formula Industry Revenue (Million) Forecast, by Application 2019 & 2032
- Table 41: Mexico Enteral Feeding Formula Industry Revenue (Million) Forecast, by Application 2019 & 2032
- Table 42: Global Enteral Feeding Formula Industry Revenue Million Forecast, by Product 2019 & 2032
- Table 43: Global Enteral Feeding Formula Industry Revenue Million Forecast, by Application 2019 & 2032
- Table 44: Global Enteral Feeding Formula Industry Revenue Million Forecast, by End User 2019 & 2032
- Table 45: Global Enteral Feeding Formula Industry Revenue Million Forecast, by Distributuion Channel 2019 & 2032
- Table 46: Global Enteral Feeding Formula Industry Revenue Million Forecast, by Country 2019 & 2032
- Table 47: Germany Enteral Feeding Formula Industry Revenue (Million) Forecast, by Application 2019 & 2032
- Table 48: United Kingdom Enteral Feeding Formula Industry Revenue (Million) Forecast, by Application 2019 & 2032
- Table 49: France Enteral Feeding Formula Industry Revenue (Million) Forecast, by Application 2019 & 2032
- Table 50: Italy Enteral Feeding Formula Industry Revenue (Million) Forecast, by Application 2019 & 2032
- Table 51: Spain Enteral Feeding Formula Industry Revenue (Million) Forecast, by Application 2019 & 2032
- Table 52: Rest of Europe Enteral Feeding Formula Industry Revenue (Million) Forecast, by Application 2019 & 2032
- Table 53: Global Enteral Feeding Formula Industry Revenue Million Forecast, by Product 2019 & 2032
- Table 54: Global Enteral Feeding Formula Industry Revenue Million Forecast, by Application 2019 & 2032
- Table 55: Global Enteral Feeding Formula Industry Revenue Million Forecast, by End User 2019 & 2032
- Table 56: Global Enteral Feeding Formula Industry Revenue Million Forecast, by Distributuion Channel 2019 & 2032
- Table 57: Global Enteral Feeding Formula Industry Revenue Million Forecast, by Country 2019 & 2032
- Table 58: China Enteral Feeding Formula Industry Revenue (Million) Forecast, by Application 2019 & 2032
- Table 59: Japan Enteral Feeding Formula Industry Revenue (Million) Forecast, by Application 2019 & 2032
- Table 60: India Enteral Feeding Formula Industry Revenue (Million) Forecast, by Application 2019 & 2032
- Table 61: Australia Enteral Feeding Formula Industry Revenue (Million) Forecast, by Application 2019 & 2032
- Table 62: South Korea Enteral Feeding Formula Industry Revenue (Million) Forecast, by Application 2019 & 2032
- Table 63: Rest of Asia Pacific Enteral Feeding Formula Industry Revenue (Million) Forecast, by Application 2019 & 2032
- Table 64: Global Enteral Feeding Formula Industry Revenue Million Forecast, by Product 2019 & 2032
- Table 65: Global Enteral Feeding Formula Industry Revenue Million Forecast, by Application 2019 & 2032
- Table 66: Global Enteral Feeding Formula Industry Revenue Million Forecast, by End User 2019 & 2032
- Table 67: Global Enteral Feeding Formula Industry Revenue Million Forecast, by Distributuion Channel 2019 & 2032
- Table 68: Global Enteral Feeding Formula Industry Revenue Million Forecast, by Country 2019 & 2032
- Table 69: GCC Enteral Feeding Formula Industry Revenue (Million) Forecast, by Application 2019 & 2032
- Table 70: South Africa Enteral Feeding Formula Industry Revenue (Million) Forecast, by Application 2019 & 2032
- Table 71: Rest of Middle East and Africa Enteral Feeding Formula Industry Revenue (Million) Forecast, by Application 2019 & 2032
- Table 72: Global Enteral Feeding Formula Industry Revenue Million Forecast, by Product 2019 & 2032
- Table 73: Global Enteral Feeding Formula Industry Revenue Million Forecast, by Application 2019 & 2032
- Table 74: Global Enteral Feeding Formula Industry Revenue Million Forecast, by End User 2019 & 2032
- Table 75: Global Enteral Feeding Formula Industry Revenue Million Forecast, by Distributuion Channel 2019 & 2032
- Table 76: Global Enteral Feeding Formula Industry Revenue Million Forecast, by Country 2019 & 2032
- Table 77: Brazil Enteral Feeding Formula Industry Revenue (Million) Forecast, by Application 2019 & 2032
- Table 78: Argentina Enteral Feeding Formula Industry Revenue (Million) Forecast, by Application 2019 & 2032
- Table 79: Rest of South America Enteral Feeding Formula Industry Revenue (Million) Forecast, by Application 2019 & 2032
Frequently Asked Questions
1. What is the projected Compound Annual Growth Rate (CAGR) of the Enteral Feeding Formula Industry?
The projected CAGR is approximately 5.18%.
2. Which companies are prominent players in the Enteral Feeding Formula Industry?
Key companies in the market include Nestle SA, Fresenius SE & Co KgaA (Fresenius Kabi AG), Meiji Holdings Co Ltd, Global Health Product Inc, Abbott Laboratories, Danone SA (Nutricia), Functional Formularies*List Not Exhaustive, Hormel Foods Corporation, B Braun Melsungen AG, Victus Inc, Reckitt Benckiser Group plc (Mead Johnson), Kate Farms.
3. What are the main segments of the Enteral Feeding Formula Industry?
The market segments include Product, Application, End User, Distributuion Channel.
4. Can you provide details about the market size?
The market size is estimated to be USD 8.77 Million as of 2022.
5. What are some drivers contributing to market growth?
Increasing Prevalence of Metabolic and Chronic Diseases; Increasing Spending on Patient Care; Growing Geriatric Population.
6. What are the notable trends driving market growth?
Oncology Segment is Expected to Hold a Significant Market Share in the Enteral Feeding Formulas Market.
7. Are there any restraints impacting market growth?
Complications Associated with Enteral Nutrition; High Cost and Low Adherence Rates in Developing Countries.
8. Can you provide examples of recent developments in the market?
September 2022: Kate Farms raised USD 75 million in a Series C funding round led by life-science investor Novo Holdings. With this, Kate Farms will be able to increase its efforts in developing plant-based clinical nutrition research, product innovation, and development into more channels.
9. What pricing options are available for accessing the report?
Pricing options include single-user, multi-user, and enterprise licenses priced at USD 4750, USD 5250, and USD 8750 respectively.
10. Is the market size provided in terms of value or volume?
The market size is provided in terms of value, measured in Million.
11. Are there any specific market keywords associated with the report?
Yes, the market keyword associated with the report is "Enteral Feeding Formula Industry," which aids in identifying and referencing the specific market segment covered.
12. How do I determine which pricing option suits my needs best?
The pricing options vary based on user requirements and access needs. Individual users may opt for single-user licenses, while businesses requiring broader access may choose multi-user or enterprise licenses for cost-effective access to the report.
13. Are there any additional resources or data provided in the Enteral Feeding Formula Industry report?
While the report offers comprehensive insights, it's advisable to review the specific contents or supplementary materials provided to ascertain if additional resources or data are available.
14. How can I stay updated on further developments or reports in the Enteral Feeding Formula Industry?
To stay informed about further developments, trends, and reports in the Enteral Feeding Formula Industry, consider subscribing to industry newsletters, following relevant companies and organizations, or regularly checking reputable industry news sources and publications.
Methodology
Step 1 - Identification of Relevant Samples Size from Population Database


Step 2 - Approaches for Defining Global Market Size (Value, Volume* & Price*)

Note*: In applicable scenarios
Step 3 - Data Sources
Primary Research
- Web Analytics
- Survey Reports
- Research Institute
- Latest Research Reports
- Opinion Leaders
Secondary Research
- Annual Reports
- White Paper
- Latest Press Release
- Industry Association
- Paid Database
- Investor Presentations

Step 4 - Data Triangulation
Involves using different sources of information in order to increase the validity of a study
These sources are likely to be stakeholders in a program - participants, other researchers, program staff, other community members, and so on.
Then we put all data in single framework & apply various statistical tools to find out the dynamic on the market.
During the analysis stage, feedback from the stakeholder groups would be compared to determine areas of agreement as well as areas of divergence


