
Key Insights
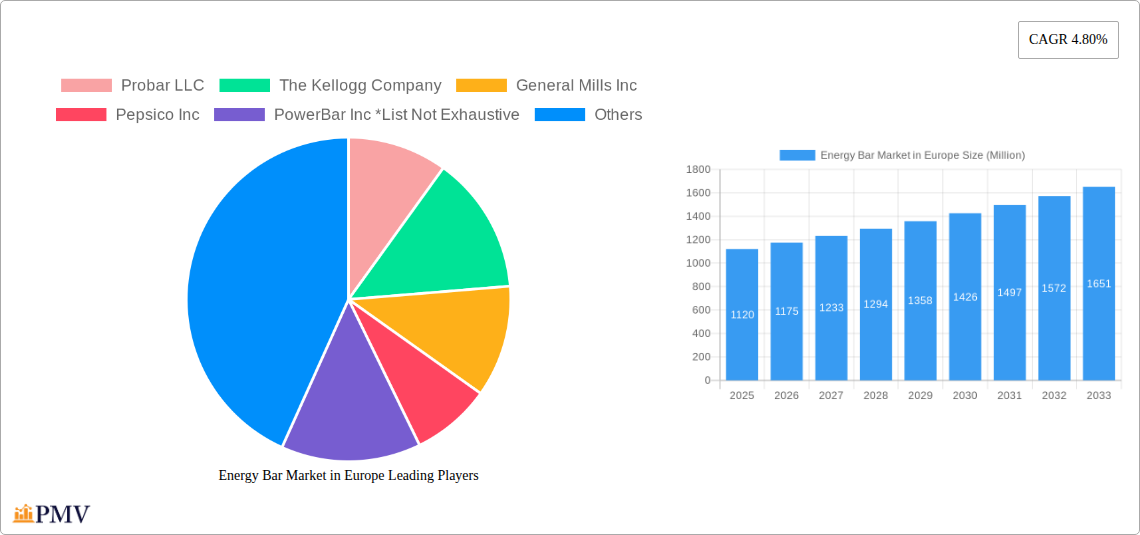
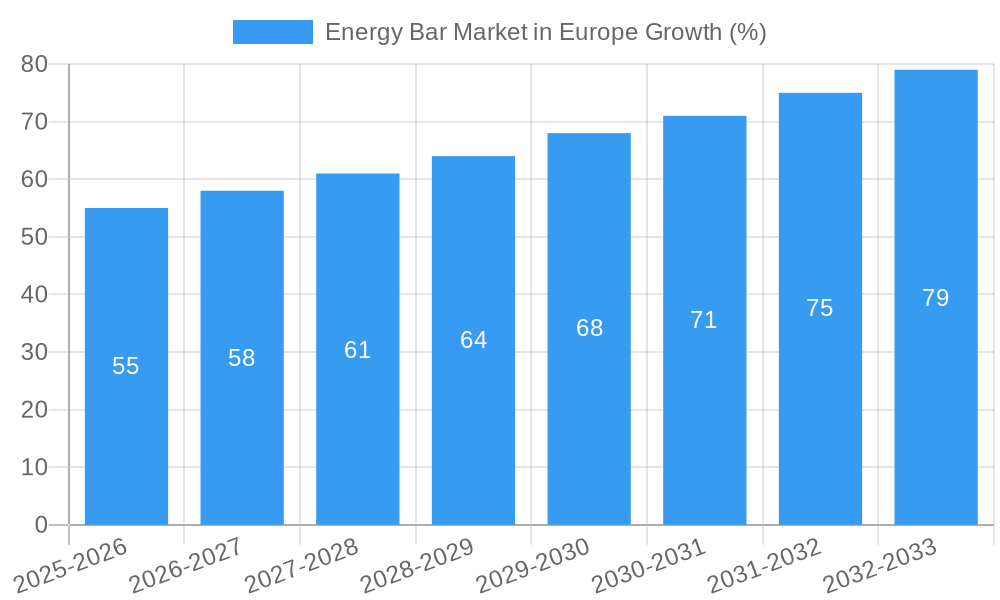
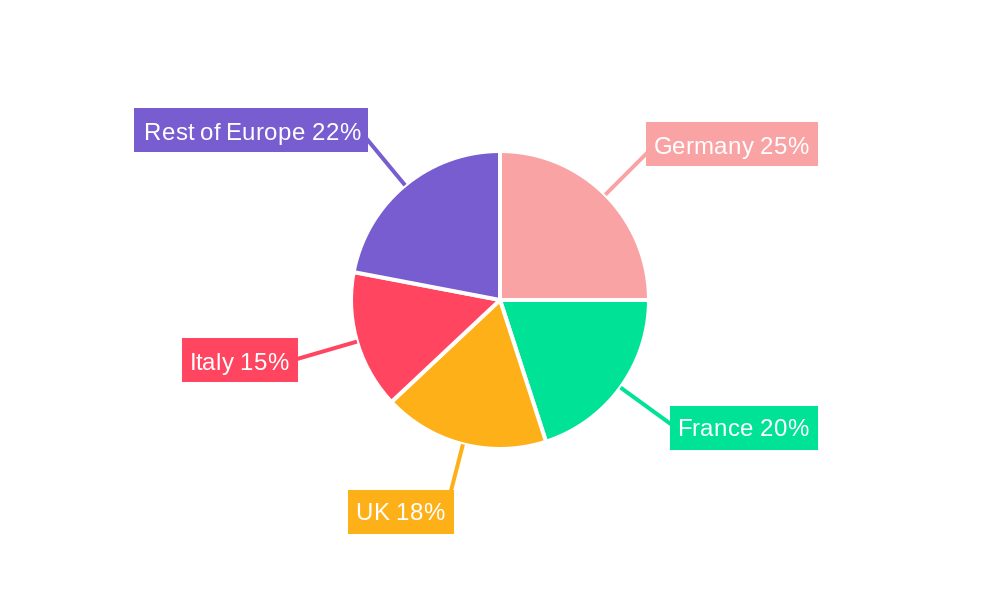
The European energy bar market, valued at €1120 million in 2025, is projected to experience robust growth, driven by increasing health consciousness among consumers and the convenience offered by these bars. The market's Compound Annual Growth Rate (CAGR) of 4.80% from 2025 to 2033 signifies a steady expansion, with projections suggesting a market value exceeding €1600 million by 2033. Key drivers include the rising popularity of fitness and active lifestyles, growing demand for on-the-go nutritious snacks, and increased product innovation focusing on natural ingredients, functional benefits (such as added protein or fiber), and diverse flavors. The market is segmented by distribution channels, with supermarkets/hypermarkets holding a significant share, followed by convenience stores and online retail, reflecting changing consumer shopping habits. Leading brands such as Probar, Kellogg's, General Mills, and PepsiCo are actively competing in this space through product diversification and strategic marketing efforts. However, market growth might be slightly tempered by factors such as fluctuating raw material prices and increased competition from other healthy snack options. The continued growth of online retail presents a significant opportunity for expansion, while effectively addressing consumer concerns about ingredient transparency and sustainability will be crucial for long-term success. Germany, France, the UK, and Italy are anticipated to remain major contributors to the overall market size due to their sizable populations and established health and wellness markets.
The European energy bar market's growth is fueled by several interconnected factors. The rising prevalence of health-conscious lifestyles across Europe is a significant catalyst, prompting consumers to seek convenient and nutritious snacking options. This trend is particularly evident among younger demographics and working professionals who value time efficiency. Furthermore, the burgeoning fitness industry, with its emphasis on performance and recovery, strongly supports demand for energy bars. The market's segmentation by distribution channels reflects evolving consumer behavior, with the rise of e-commerce significantly influencing market dynamics. While established players dominate the market, new entrants with innovative products and unique value propositions continue to emerge. The competitive landscape is likely to remain dynamic, with companies focusing on product differentiation, strategic partnerships, and effective brand building to maintain a strong market presence. Sustained growth will also depend on addressing concerns regarding sugar content, artificial ingredients, and environmental sustainability, necessitating greater transparency and responsible sourcing practices.
Energy Bar Market in Europe: A Comprehensive Market Report (2019-2033)
This comprehensive report provides an in-depth analysis of the Energy Bar Market in Europe, covering market size, growth drivers, competitive landscape, and future outlook. With a study period spanning 2019-2033, a base year of 2025, and a forecast period of 2025-2033, this report offers invaluable insights for businesses, investors, and stakeholders in the European energy bar sector. The report utilizes data from the historical period (2019-2024) to provide a robust foundation for future projections. The estimated market size for 2025 is xx Million.
Energy Bar Market in Europe Market Structure & Competitive Dynamics
The European energy bar market is characterized by a moderately concentrated structure, with several key players holding significant market share. However, the market also demonstrates a dynamic competitive landscape, fueled by continuous product innovation, strategic acquisitions, and evolving consumer preferences. Key players such as Probar LLC, The Kellogg Company, General Mills Inc, Pepsico Inc, and PowerBar Inc, alongside other significant players like QuestNutrition LLC, Oatein, Clif Bar & Company, Nestlé S.A., and Mars, Incorporated, actively compete for market dominance. The market exhibits a robust innovation ecosystem, with companies continuously introducing new product variants to cater to diverse consumer needs and preferences, including organic, vegan, and protein-enriched options. Regulatory frameworks pertaining to food labeling, ingredients, and health claims significantly influence product development and marketing strategies. The existence of substitute products, such as protein shakes and other snack bars, adds further complexity to the competitive dynamics. Mergers and acquisitions (M&A) activities have significantly shaped the market structure, with deal values ranging from xx Million to xx Million in recent years. For instance, Clif Bar & Company's acquisition of Bioenergy in 2022 exemplifies the trend of strategic expansion within the sector.
- Market Concentration: Moderately concentrated, with top 5 players holding approximately xx% market share (estimated).
- Innovation Ecosystem: High, driven by new product development and reformulations.
- Regulatory Framework: Significant influence on ingredient selection and labeling.
- Product Substitutes: Protein shakes, other snack bars exert competitive pressure.
- M&A Activity: Active, with notable deals impacting market share and distribution.
Energy Bar Market in Europe Industry Trends & Insights
The European energy bar market exhibits robust growth, driven primarily by the rising health-conscious consumer base, increased demand for convenient and nutritious snacks, and the growing popularity of fitness and sports activities. The market has witnessed a Compound Annual Growth Rate (CAGR) of xx% during the historical period (2019-2024) and is projected to maintain a CAGR of xx% during the forecast period (2025-2033). Technological advancements in food processing and packaging have further propelled market growth. This includes innovations like improved texture, longer shelf life, and sustainable packaging options. Changing consumer preferences, such as demand for organic, vegan, and gluten-free energy bars, present both opportunities and challenges for manufacturers. Market penetration of energy bars within specific demographic segments, such as young adults and athletes, remains high, however, ongoing competition and evolving consumer needs continue to shape the market dynamics. The premium segment is showing a higher rate of growth than the standard segment reflecting a willingness of many customers to pay a premium for higher-quality ingredients and enhanced nutritional benefits.
Dominant Markets & Segments in Energy Bar Market in Europe
The Supermarkets/Hypermarkets segment dominates the European energy bar market distribution channels. This dominance stems from the wide reach and established distribution networks of these channels, offering energy bars to a large consumer base. However, the online retail segment shows significant growth potential, driven by the increasing preference for e-commerce and online grocery shopping.
Supermarkets/Hypermarkets:
- Key Drivers: Wide reach, established distribution networks, strong brand presence.
- Dominance Analysis: Holds the largest market share due to established infrastructure and consumer purchasing habits.
Convenience Stores:
- Key Drivers: Convenient location, impulse purchases, high foot traffic.
- Dominance Analysis: Significant but smaller than supermarkets/hypermarkets, particularly in densely populated urban areas.
Specialist Stores:
- Key Drivers: Focus on niche products, cater to specific consumer preferences.
- Dominance Analysis: Holds a smaller but growing market share due to its capacity to offer organic or specialized energy bars.
Online Retail Stores:
- Key Drivers: Growing e-commerce, convenience, wider product selection.
- Dominance Analysis: Rapidly expanding market share driven by technological advancements in logistics.
Other Distribution Channels:
- Key Drivers: Direct-to-consumer sales, gym memberships and fitness studios.
- Dominance Analysis: Holds a modest market share, representing a supplementary distribution channel.
Germany and the UK are the leading national markets within Europe, driven by factors such as high disposable incomes, health-conscious populations, and a well-established retail infrastructure.
Energy Bar Market in Europe Product Innovations
Recent innovations in the European energy bar market focus on improving nutritional profiles, enhancing taste and texture, and incorporating sustainable packaging solutions. Manufacturers are developing products with higher protein content, added vitamins and minerals, and organic ingredients. The use of natural sweeteners and reduced sugar content is a major trend, catering to the growing health-conscious consumer base. Technological advancements in extrusion technology and processing methods allow for greater flexibility in terms of texture and taste profiles. This innovation focuses on creating products that meet the demands of different consumer lifestyles and dietary preferences whilst maintaining an eye on sustainability.
Report Segmentation & Scope
This report segments the European energy bar market by distribution channel:
Supermarkets/Hypermarkets: This segment is expected to maintain its leading position due to its established infrastructure and wide reach. Growth is projected to be steady, driven by new product launches and promotions. Competitive intensity is high.
Convenience Stores: This segment benefits from convenient locations and impulse purchases. Growth will be moderate, driven by increasing demand for on-the-go snacking options. Competitive dynamics are moderate.
Specialist Stores: This segment caters to specific dietary needs and preferences, offering niche products. Growth is projected to be strong, driven by rising health consciousness and increasing demand for organic and specialized bars. Competition is moderate.
Online Retail Stores: This segment is experiencing rapid growth due to e-commerce expansion and convenience. Growth will be high, driven by increased online shopping and the rising reach of e-commerce platforms. Competitive dynamics are increasing.
Other Distribution Channels: This segment encompasses smaller channels, and growth will be slow, driven by limited reach and scale. Competitive dynamics are low.
Key Drivers of Energy Bar Market in Europe Growth
The growth of the European energy bar market is fueled by several key drivers. The rising health-conscious population is actively seeking convenient and nutritious snack options, driving strong demand for energy bars. The increasing popularity of fitness and sports activities further contributes to market expansion. Economic factors, particularly disposable incomes, play a role in consumer purchasing decisions. Technological advancements in manufacturing and packaging lead to improved product quality, extended shelf life, and sustainable solutions.
Challenges in the Energy Bar Market in Europe Sector
The European energy bar market faces several challenges. Fluctuating raw material prices and supply chain disruptions impact production costs and profitability. Stringent regulatory requirements concerning food safety, labeling, and health claims pose compliance challenges. Intense competition from established players and new entrants puts pressure on market share and pricing. Consumer preferences are constantly evolving, requiring manufacturers to adapt to changing dietary trends and preferences.
Leading Players in the Energy Bar Market in Europe Market
- Probar LLC
- The Kellogg Company
- General Mills Inc
- Pepsico Inc
- PowerBar Inc
- QuestNutrition LLC
- Oatein
- Clif Bar & Company
- Nestlé S.A.
- Mars, Incorporated
Key Developments in Energy Bar Market in Europe Sector
- 2022: Clif Bar & Company acquired a majority stake in UK-based Bioenergy, expanding its European presence.
- 2023: (Example - add further real examples here of product launches, acquisitions etc. Use Month Year format) xx Company launched a new line of vegan energy bars.
- 2024: xx Company announced a strategic partnership to expand distribution networks in Eastern Europe.
Strategic Energy Bar Market in Europe Market Outlook
The European energy bar market presents significant growth opportunities in the coming years. The continued rise in health consciousness, coupled with the expanding fitness and sports sector, will drive market expansion. Product innovation, particularly in organic, vegan, and functional ingredients, will be crucial for capturing market share. Companies focusing on sustainable and ethical sourcing will gain a competitive advantage. The online retail channel holds immense potential for growth, and strategic investments in digital marketing and e-commerce will be essential. The premium segment, with its focus on high-quality ingredients and specialized formulations, is set for significant expansion.
Energy Bar Market in Europe Segmentation
-
1. Distribution Channel
- 1.1. Supermarkets/Hypermarkets
- 1.2. Convenience Stores
- 1.3. Specialist stores
- 1.4. Online Retail Stores
- 1.5. Other Distribution Channels
Energy Bar Market in Europe Segmentation By Geography
-
1. Europe
- 1.1. Spain
- 1.2. United Kingdom
- 1.3. Germany
- 1.4. France
- 1.5. Italy
- 1.6. Russia
- 1.7. Rest of Europe
Energy Bar Market in Europe REPORT HIGHLIGHTS
| Aspects | Details |
|---|---|
| Study Period | 2019-2033 |
| Base Year | 2024 |
| Estimated Year | 2025 |
| Forecast Period | 2025-2033 |
| Historical Period | 2019-2024 |
| Growth Rate | CAGR of 4.80% from 2019-2033 |
| Segmentation |
|
Table of Contents
- 1. Introduction
- 1.1. Research Scope
- 1.2. Market Segmentation
- 1.3. Research Methodology
- 1.4. Definitions and Assumptions
- 2. Executive Summary
- 2.1. Introduction
- 3. Market Dynamics
- 3.1. Introduction
- 3.2. Market Drivers
- 3.2.1. Increasing Demand for Clean Label Ingredients; Growing Health Consciousness of Consumers
- 3.3. Market Restrains
- 3.3.1. Higher Manufacturing Cost
- 3.4. Market Trends
- 3.4.1. United Kingdom Dominating the Market
- 4. Market Factor Analysis
- 4.1. Porters Five Forces
- 4.2. Supply/Value Chain
- 4.3. PESTEL analysis
- 4.4. Market Entropy
- 4.5. Patent/Trademark Analysis
- 5. Energy Bar Market in Europe Analysis, Insights and Forecast, 2019-2031
- 5.1. Market Analysis, Insights and Forecast - by Distribution Channel
- 5.1.1. Supermarkets/Hypermarkets
- 5.1.2. Convenience Stores
- 5.1.3. Specialist stores
- 5.1.4. Online Retail Stores
- 5.1.5. Other Distribution Channels
- 5.2. Market Analysis, Insights and Forecast - by Region
- 5.2.1. Europe
- 5.1. Market Analysis, Insights and Forecast - by Distribution Channel
- 6. Germany Energy Bar Market in Europe Analysis, Insights and Forecast, 2019-2031
- 7. France Energy Bar Market in Europe Analysis, Insights and Forecast, 2019-2031
- 8. Italy Energy Bar Market in Europe Analysis, Insights and Forecast, 2019-2031
- 9. United Kingdom Energy Bar Market in Europe Analysis, Insights and Forecast, 2019-2031
- 10. Netherlands Energy Bar Market in Europe Analysis, Insights and Forecast, 2019-2031
- 11. Sweden Energy Bar Market in Europe Analysis, Insights and Forecast, 2019-2031
- 12. Rest of Europe Energy Bar Market in Europe Analysis, Insights and Forecast, 2019-2031
- 13. Competitive Analysis
- 13.1. Market Share Analysis 2024
- 13.2. Company Profiles
- 13.2.1 Probar LLC
- 13.2.1.1. Overview
- 13.2.1.2. Products
- 13.2.1.3. SWOT Analysis
- 13.2.1.4. Recent Developments
- 13.2.1.5. Financials (Based on Availability)
- 13.2.2 The Kellogg Company
- 13.2.2.1. Overview
- 13.2.2.2. Products
- 13.2.2.3. SWOT Analysis
- 13.2.2.4. Recent Developments
- 13.2.2.5. Financials (Based on Availability)
- 13.2.3 General Mills Inc
- 13.2.3.1. Overview
- 13.2.3.2. Products
- 13.2.3.3. SWOT Analysis
- 13.2.3.4. Recent Developments
- 13.2.3.5. Financials (Based on Availability)
- 13.2.4 Pepsico Inc
- 13.2.4.1. Overview
- 13.2.4.2. Products
- 13.2.4.3. SWOT Analysis
- 13.2.4.4. Recent Developments
- 13.2.4.5. Financials (Based on Availability)
- 13.2.5 PowerBar Inc *List Not Exhaustive
- 13.2.5.1. Overview
- 13.2.5.2. Products
- 13.2.5.3. SWOT Analysis
- 13.2.5.4. Recent Developments
- 13.2.5.5. Financials (Based on Availability)
- 13.2.6 QuestNutrition LLC
- 13.2.6.1. Overview
- 13.2.6.2. Products
- 13.2.6.3. SWOT Analysis
- 13.2.6.4. Recent Developments
- 13.2.6.5. Financials (Based on Availability)
- 13.2.7 Oatein
- 13.2.7.1. Overview
- 13.2.7.2. Products
- 13.2.7.3. SWOT Analysis
- 13.2.7.4. Recent Developments
- 13.2.7.5. Financials (Based on Availability)
- 13.2.8 Clif Bar & Company
- 13.2.8.1. Overview
- 13.2.8.2. Products
- 13.2.8.3. SWOT Analysis
- 13.2.8.4. Recent Developments
- 13.2.8.5. Financials (Based on Availability)
- 13.2.9 Nestlé S.A.
- 13.2.9.1. Overview
- 13.2.9.2. Products
- 13.2.9.3. SWOT Analysis
- 13.2.9.4. Recent Developments
- 13.2.9.5. Financials (Based on Availability)
- 13.2.10 Mars Incorporated
- 13.2.10.1. Overview
- 13.2.10.2. Products
- 13.2.10.3. SWOT Analysis
- 13.2.10.4. Recent Developments
- 13.2.10.5. Financials (Based on Availability)
- 13.2.1 Probar LLC
List of Figures
- Figure 1: Energy Bar Market in Europe Revenue Breakdown (Million, %) by Product 2024 & 2032
- Figure 2: Energy Bar Market in Europe Share (%) by Company 2024
List of Tables
- Table 1: Energy Bar Market in Europe Revenue Million Forecast, by Region 2019 & 2032
- Table 2: Energy Bar Market in Europe Volume K Tons Forecast, by Region 2019 & 2032
- Table 3: Energy Bar Market in Europe Revenue Million Forecast, by Distribution Channel 2019 & 2032
- Table 4: Energy Bar Market in Europe Volume K Tons Forecast, by Distribution Channel 2019 & 2032
- Table 5: Energy Bar Market in Europe Revenue Million Forecast, by Region 2019 & 2032
- Table 6: Energy Bar Market in Europe Volume K Tons Forecast, by Region 2019 & 2032
- Table 7: Energy Bar Market in Europe Revenue Million Forecast, by Country 2019 & 2032
- Table 8: Energy Bar Market in Europe Volume K Tons Forecast, by Country 2019 & 2032
- Table 9: Germany Energy Bar Market in Europe Revenue (Million) Forecast, by Application 2019 & 2032
- Table 10: Germany Energy Bar Market in Europe Volume (K Tons) Forecast, by Application 2019 & 2032
- Table 11: France Energy Bar Market in Europe Revenue (Million) Forecast, by Application 2019 & 2032
- Table 12: France Energy Bar Market in Europe Volume (K Tons) Forecast, by Application 2019 & 2032
- Table 13: Italy Energy Bar Market in Europe Revenue (Million) Forecast, by Application 2019 & 2032
- Table 14: Italy Energy Bar Market in Europe Volume (K Tons) Forecast, by Application 2019 & 2032
- Table 15: United Kingdom Energy Bar Market in Europe Revenue (Million) Forecast, by Application 2019 & 2032
- Table 16: United Kingdom Energy Bar Market in Europe Volume (K Tons) Forecast, by Application 2019 & 2032
- Table 17: Netherlands Energy Bar Market in Europe Revenue (Million) Forecast, by Application 2019 & 2032
- Table 18: Netherlands Energy Bar Market in Europe Volume (K Tons) Forecast, by Application 2019 & 2032
- Table 19: Sweden Energy Bar Market in Europe Revenue (Million) Forecast, by Application 2019 & 2032
- Table 20: Sweden Energy Bar Market in Europe Volume (K Tons) Forecast, by Application 2019 & 2032
- Table 21: Rest of Europe Energy Bar Market in Europe Revenue (Million) Forecast, by Application 2019 & 2032
- Table 22: Rest of Europe Energy Bar Market in Europe Volume (K Tons) Forecast, by Application 2019 & 2032
- Table 23: Energy Bar Market in Europe Revenue Million Forecast, by Distribution Channel 2019 & 2032
- Table 24: Energy Bar Market in Europe Volume K Tons Forecast, by Distribution Channel 2019 & 2032
- Table 25: Energy Bar Market in Europe Revenue Million Forecast, by Country 2019 & 2032
- Table 26: Energy Bar Market in Europe Volume K Tons Forecast, by Country 2019 & 2032
- Table 27: Spain Energy Bar Market in Europe Revenue (Million) Forecast, by Application 2019 & 2032
- Table 28: Spain Energy Bar Market in Europe Volume (K Tons) Forecast, by Application 2019 & 2032
- Table 29: United Kingdom Energy Bar Market in Europe Revenue (Million) Forecast, by Application 2019 & 2032
- Table 30: United Kingdom Energy Bar Market in Europe Volume (K Tons) Forecast, by Application 2019 & 2032
- Table 31: Germany Energy Bar Market in Europe Revenue (Million) Forecast, by Application 2019 & 2032
- Table 32: Germany Energy Bar Market in Europe Volume (K Tons) Forecast, by Application 2019 & 2032
- Table 33: France Energy Bar Market in Europe Revenue (Million) Forecast, by Application 2019 & 2032
- Table 34: France Energy Bar Market in Europe Volume (K Tons) Forecast, by Application 2019 & 2032
- Table 35: Italy Energy Bar Market in Europe Revenue (Million) Forecast, by Application 2019 & 2032
- Table 36: Italy Energy Bar Market in Europe Volume (K Tons) Forecast, by Application 2019 & 2032
- Table 37: Russia Energy Bar Market in Europe Revenue (Million) Forecast, by Application 2019 & 2032
- Table 38: Russia Energy Bar Market in Europe Volume (K Tons) Forecast, by Application 2019 & 2032
- Table 39: Rest of Europe Energy Bar Market in Europe Revenue (Million) Forecast, by Application 2019 & 2032
- Table 40: Rest of Europe Energy Bar Market in Europe Volume (K Tons) Forecast, by Application 2019 & 2032
Frequently Asked Questions
1. What is the projected Compound Annual Growth Rate (CAGR) of the Energy Bar Market in Europe?
The projected CAGR is approximately 4.80%.
2. Which companies are prominent players in the Energy Bar Market in Europe?
Key companies in the market include Probar LLC, The Kellogg Company, General Mills Inc, Pepsico Inc, PowerBar Inc *List Not Exhaustive, QuestNutrition LLC, Oatein, Clif Bar & Company, Nestlé S.A. , Mars, Incorporated.
3. What are the main segments of the Energy Bar Market in Europe?
The market segments include Distribution Channel.
4. Can you provide details about the market size?
The market size is estimated to be USD 1120 Million as of 2022.
5. What are some drivers contributing to market growth?
Increasing Demand for Clean Label Ingredients; Growing Health Consciousness of Consumers.
6. What are the notable trends driving market growth?
United Kingdom Dominating the Market.
7. Are there any restraints impacting market growth?
Higher Manufacturing Cost.
8. Can you provide examples of recent developments in the market?
Recent developments in the Energy Bar Market in Europe include product launches, mergers and acquisitions, and strategic partnerships. For instance, in 2022, Clif Bar & Company acquired a majority stake in UK-based energy bar manufacturer, Bioenergy. This acquisition expanded Clif Bar's presence in the European market and strengthened its product portfolio.
9. What pricing options are available for accessing the report?
Pricing options include single-user, multi-user, and enterprise licenses priced at USD 4750, USD 5250, and USD 8750 respectively.
10. Is the market size provided in terms of value or volume?
The market size is provided in terms of value, measured in Million and volume, measured in K Tons.
11. Are there any specific market keywords associated with the report?
Yes, the market keyword associated with the report is "Energy Bar Market in Europe," which aids in identifying and referencing the specific market segment covered.
12. How do I determine which pricing option suits my needs best?
The pricing options vary based on user requirements and access needs. Individual users may opt for single-user licenses, while businesses requiring broader access may choose multi-user or enterprise licenses for cost-effective access to the report.
13. Are there any additional resources or data provided in the Energy Bar Market in Europe report?
While the report offers comprehensive insights, it's advisable to review the specific contents or supplementary materials provided to ascertain if additional resources or data are available.
14. How can I stay updated on further developments or reports in the Energy Bar Market in Europe?
To stay informed about further developments, trends, and reports in the Energy Bar Market in Europe, consider subscribing to industry newsletters, following relevant companies and organizations, or regularly checking reputable industry news sources and publications.
Methodology
Step 1 - Identification of Relevant Samples Size from Population Database


Step 2 - Approaches for Defining Global Market Size (Value, Volume* & Price*)

Note*: In applicable scenarios
Step 3 - Data Sources
Primary Research
- Web Analytics
- Survey Reports
- Research Institute
- Latest Research Reports
- Opinion Leaders
Secondary Research
- Annual Reports
- White Paper
- Latest Press Release
- Industry Association
- Paid Database
- Investor Presentations

Step 4 - Data Triangulation
Involves using different sources of information in order to increase the validity of a study
These sources are likely to be stakeholders in a program - participants, other researchers, program staff, other community members, and so on.
Then we put all data in single framework & apply various statistical tools to find out the dynamic on the market.
During the analysis stage, feedback from the stakeholder groups would be compared to determine areas of agreement as well as areas of divergence


