
Key Insights
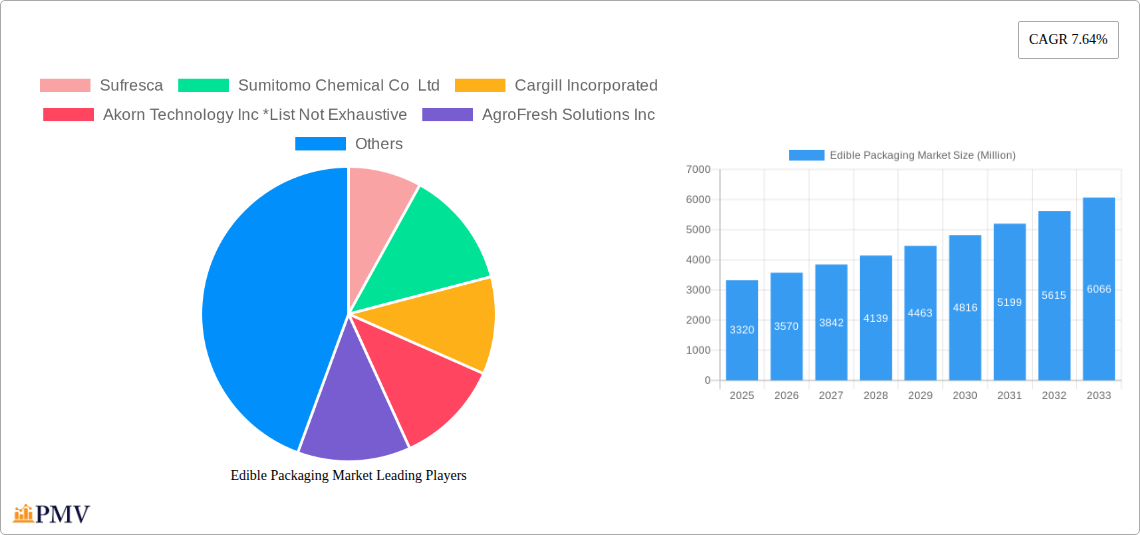
The global edible packaging market, valued at $3.32 billion in 2025, is projected to experience robust growth, driven by escalating consumer demand for sustainable and eco-friendly packaging solutions. The rising awareness of environmental concerns associated with traditional petroleum-based packaging is a key factor fueling market expansion. Consumers are increasingly seeking alternatives that minimize waste and environmental impact, leading to a surge in the adoption of edible films and coatings made from natural ingredients like proteins, polysaccharides, and lipids. This trend is further amplified by the growing popularity of convenient, ready-to-eat foods and the increasing demand for extended shelf life in various food categories, including dairy, bakery, fruits, and vegetables. The market is segmented by ingredient type (protein, polysaccharides, lipids, and composites) and application (dairy, bakery & confectionery, fruits & vegetables, meat, poultry & seafood, and others), reflecting the diverse utilization of edible packaging across the food industry. Technological advancements in creating more durable and functional edible coatings and films are also contributing to market growth. However, challenges remain, including the relatively higher cost of edible packaging compared to conventional options and potential limitations in terms of barrier properties and scalability. Nevertheless, the ongoing innovation and increasing consumer preference for sustainable packaging suggest a promising future for this market.
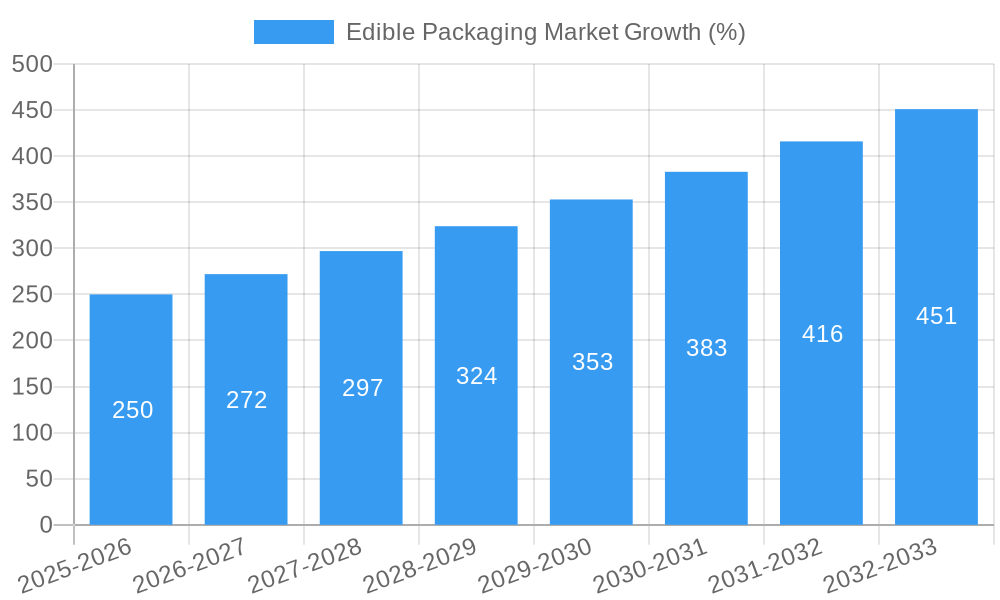
Further market growth is anticipated to be influenced by several factors. The increasing focus on food safety and the ability of edible packaging to enhance product preservation are driving adoption. Furthermore, the expansion of the food and beverage industry, particularly in developing economies, is creating significant opportunities. Key players, including Sufresca, Sumitomo Chemical, Cargill, and others, are actively involved in research and development, focusing on improving the functionality, cost-effectiveness, and versatility of edible packaging solutions. This competitive landscape is likely to further fuel innovation and market growth throughout the forecast period (2025-2033). Regional variations in growth rates are expected, with developing regions in Asia-Pacific showing significant potential due to increasing consumer spending and expanding food processing industries. The market's future trajectory indicates a considerable expansion, bolstered by consumer preferences and industry innovations.
Edible Packaging Market: A Comprehensive Report (2019-2033)
This detailed report provides a comprehensive analysis of the global Edible Packaging Market, offering invaluable insights for stakeholders across the value chain. With a study period spanning 2019-2033, a base year of 2025, and a forecast period of 2025-2033, this report leverages extensive data analysis and industry expertise to deliver actionable intelligence. The market is projected to reach xx Million by 2033, exhibiting a robust CAGR of xx% during the forecast period.
Edible Packaging Market Market Structure & Competitive Dynamics
The edible packaging market exhibits a moderately consolidated structure, with several key players competing fiercely. Market concentration is influenced by factors like technological advancements, regulatory landscapes, and the emergence of innovative substitutes. The market's innovation ecosystem is dynamic, with continuous R&D efforts driving the development of novel materials and applications. Regulatory frameworks, particularly concerning food safety and environmental impact, significantly shape market dynamics. The presence of substitute packaging materials, such as conventional plastics, presents a competitive challenge. However, increasing consumer demand for sustainable and eco-friendly packaging is driving the adoption of edible alternatives. Mergers and acquisitions (M&A) activities have played a significant role in market consolidation, with deal values exceeding xx Million in recent years. Key players are strategically focusing on partnerships and collaborations to expand their market reach and product portfolios.
- Market Share: While precise market share data for each company is proprietary, key players like Cargill Incorporated and DSM hold substantial market share. Smaller, innovative companies are rapidly gaining traction.
- M&A Activity: Recent years have witnessed a surge in M&A activity, with larger companies acquiring smaller firms to gain access to innovative technologies and expand their product portfolios. Deal values vary but significantly impact market consolidation.
Edible Packaging Market Industry Trends & Insights
The edible packaging market is witnessing robust growth, fueled by several key factors. The rising consumer preference for sustainable and eco-friendly packaging is a major driver. Growing concerns about plastic pollution and its environmental consequences are pushing consumers and brands towards more environmentally responsible options. Technological advancements are leading to the development of new and improved edible packaging materials, with enhanced functionalities like extended shelf life and improved product preservation. This has increased market penetration of edible packaging in various applications. Further, the shift towards healthier and more convenient food products is also fueling market expansion. The market is expected to see significant growth in the coming years, driven by the increasing demand for eco-friendly solutions and technological innovation. The CAGR is estimated at xx%, with significant market penetration expected in emerging economies.
Dominant Markets & Segments in Edible Packaging Market
The edible packaging market is witnessing strong growth across various regions and segments. Fruits and Vegetables constitute the largest application segment, driven by the need to extend shelf life and reduce post-harvest losses. The Polysaccharides segment dominates ingredient type, owing to its biodegradability, cost-effectiveness, and versatility.
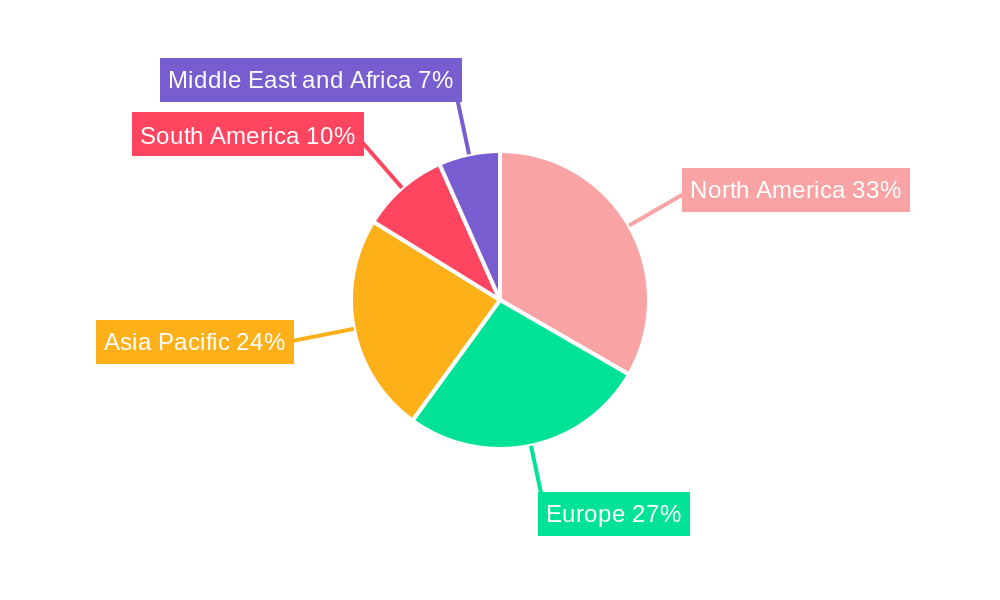
- Leading Region: North America currently leads the market, driven by high consumer awareness of environmental issues and strong regulatory support for sustainable packaging.
- Key Drivers by Segment:
- Fruits and Vegetables: Rising consumer demand for fresh produce and increasing concerns over food waste.
- Polysaccharides: Biodegradability, cost-effectiveness, and versatility in creating various edible films and coatings.
- North America: Stringent environmental regulations, high consumer awareness of sustainability, and a robust food processing industry.
The dominance of these segments reflects the strong consumer preference for sustainable and functional solutions in the food industry.
Edible Packaging Market Product Innovations
Recent years have witnessed significant product innovations in the edible packaging market. Companies are focusing on developing bio-based, biodegradable, and compostable materials with enhanced functionalities. These innovations include edible films and coatings that extend shelf life, enhance product freshness, and improve sensory attributes. The focus is on creating materials that seamlessly integrate with food products, offering a seamless consumer experience, while aligning with the growing demand for eco-friendly solutions.
Report Segmentation & Scope
This report segments the edible packaging market based on ingredient type (Protein, Polysaccharides, Lipids, Composites) and application (Dairy products, Bakery and Confectionery, Fruits and Vegetables, Meat, Poultry, and Seafood, Other Applications). Each segment is analyzed in detail, providing insights into market size, growth projections, and competitive dynamics. The growth projections vary depending on the segment, reflecting differences in market drivers and consumer preferences.
Key Drivers of Edible Packaging Market Growth
Several factors are driving the growth of the edible packaging market. The increasing demand for sustainable packaging solutions is a major driver, as consumers and businesses seek alternatives to traditional plastic packaging. Stricter environmental regulations globally are also contributing to the adoption of edible packaging. Advancements in material science and manufacturing technologies are leading to the development of more cost-effective and functional edible packaging materials. Furthermore, the growing awareness of food safety and quality is driving the adoption of edible packaging, as it minimizes the risk of chemical migration from conventional packaging.
Challenges in the Edible Packaging Market Sector
Despite its growth potential, the edible packaging market faces several challenges. Cost remains a key barrier, as the production of some edible materials can be more expensive than traditional packaging options. Scalability and production capacity are also concerns, as the market is still relatively nascent. Furthermore, maintaining the structural integrity and functional performance of edible packaging under varying storage conditions presents another challenge. Regulatory approval processes can also be time-consuming and costly.
Leading Players in the Edible Packaging Market Market
- Sufresca
- Sumitomo Chemical Co Ltd
- Cargill Incorporated
- Akorn Technology Inc
- AgroFresh Solutions Inc
- DuPont de Nemours Inc
- Nagase & Co Ltd
- Tate & Lyle PLC
- Koninklijke DSM N V
- RPM International Inc (Mantrose-Haeuser Co Inc )
- Ingredion Incorporated
- Pace International LLC
- DÖHler Group Se
Key Developments in Edible Packaging Market Sector
- January 2022: Akorn Technology launched edible coatings for fresh produce, doubling shelf life and minimizing cold chain losses.
- November 2021: Sufresca launched a biodegradable, water-based edible coating made entirely of natural food ingredients.
- February 2021: Vita Fresh (Agrofresh Solutions Inc.) launched plant-based edible coatings for fresh produce, meeting ISO14001 standards.
Strategic Edible Packaging Market Market Outlook
The future of the edible packaging market is bright, with significant growth potential driven by increasing consumer demand for sustainability and eco-friendly solutions. Strategic opportunities lie in developing innovative materials, expanding applications across different food categories, and addressing cost-related challenges through efficient production methods. The market is expected to witness a surge in collaborations between food producers, packaging companies, and technology providers to develop innovative and sustainable edible packaging solutions.
Edible Packaging Market Segmentation
-
1. Ingredient Type
- 1.1. Protein
- 1.2. Polysaccharides
- 1.3. Lipids
- 1.4. Composites
-
2. Application
- 2.1. Dairy products
- 2.2. Bakery and Confectionery
- 2.3. Fruits and Vegetables
- 2.4. Meat, Poultry, and Seafood
- 2.5. Other Applications
Edible Packaging Market Segmentation By Geography
-
1. North America
- 1.1. United States
- 1.2. Canada
- 1.3. Mexico
- 1.4. Rest of North America
-
2. Europe
- 2.1. United Kingdom
- 2.2. Germany
- 2.3. France
- 2.4. Italy
- 2.5. Spain
- 2.6. Rest of Europe
-
3. Asia Pacific
- 3.1. India
- 3.2. China
- 3.3. Japan
- 3.4. Australia
- 3.5. Rest of Asia Pacific
-
4. South America
- 4.1. Brazil
- 4.2. Argentina
- 4.3. Rest of South America
-
5. Middle East and Africa
- 5.1. South Africa
- 5.2. Saudi Arabia
- 5.3. Rest of Middle East and Africa
Edible Packaging Market REPORT HIGHLIGHTS
| Aspects | Details |
|---|---|
| Study Period | 2019-2033 |
| Base Year | 2024 |
| Estimated Year | 2025 |
| Forecast Period | 2025-2033 |
| Historical Period | 2019-2024 |
| Growth Rate | CAGR of 7.64% from 2019-2033 |
| Segmentation |
|
Table of Contents
- 1. Introduction
- 1.1. Research Scope
- 1.2. Market Segmentation
- 1.3. Research Methodology
- 1.4. Definitions and Assumptions
- 2. Executive Summary
- 2.1. Introduction
- 3. Market Dynamics
- 3.1. Introduction
- 3.2. Market Drivers
- 3.2.1. Surge in Diabetic Population drives sweetener market; Growing demand for natural sweetener-infused beverage products
- 3.3. Market Restrains
- 3.3.1. Stringent government regulations on food product claims
- 3.4. Market Trends
- 3.4.1. Increasing Demand for Edible Packaging from Natural Resources
- 4. Market Factor Analysis
- 4.1. Porters Five Forces
- 4.2. Supply/Value Chain
- 4.3. PESTEL analysis
- 4.4. Market Entropy
- 4.5. Patent/Trademark Analysis
- 5. Global Edible Packaging Market Analysis, Insights and Forecast, 2019-2031
- 5.1. Market Analysis, Insights and Forecast - by Ingredient Type
- 5.1.1. Protein
- 5.1.2. Polysaccharides
- 5.1.3. Lipids
- 5.1.4. Composites
- 5.2. Market Analysis, Insights and Forecast - by Application
- 5.2.1. Dairy products
- 5.2.2. Bakery and Confectionery
- 5.2.3. Fruits and Vegetables
- 5.2.4. Meat, Poultry, and Seafood
- 5.2.5. Other Applications
- 5.3. Market Analysis, Insights and Forecast - by Region
- 5.3.1. North America
- 5.3.2. Europe
- 5.3.3. Asia Pacific
- 5.3.4. South America
- 5.3.5. Middle East and Africa
- 5.1. Market Analysis, Insights and Forecast - by Ingredient Type
- 6. North America Edible Packaging Market Analysis, Insights and Forecast, 2019-2031
- 6.1. Market Analysis, Insights and Forecast - by Ingredient Type
- 6.1.1. Protein
- 6.1.2. Polysaccharides
- 6.1.3. Lipids
- 6.1.4. Composites
- 6.2. Market Analysis, Insights and Forecast - by Application
- 6.2.1. Dairy products
- 6.2.2. Bakery and Confectionery
- 6.2.3. Fruits and Vegetables
- 6.2.4. Meat, Poultry, and Seafood
- 6.2.5. Other Applications
- 6.1. Market Analysis, Insights and Forecast - by Ingredient Type
- 7. Europe Edible Packaging Market Analysis, Insights and Forecast, 2019-2031
- 7.1. Market Analysis, Insights and Forecast - by Ingredient Type
- 7.1.1. Protein
- 7.1.2. Polysaccharides
- 7.1.3. Lipids
- 7.1.4. Composites
- 7.2. Market Analysis, Insights and Forecast - by Application
- 7.2.1. Dairy products
- 7.2.2. Bakery and Confectionery
- 7.2.3. Fruits and Vegetables
- 7.2.4. Meat, Poultry, and Seafood
- 7.2.5. Other Applications
- 7.1. Market Analysis, Insights and Forecast - by Ingredient Type
- 8. Asia Pacific Edible Packaging Market Analysis, Insights and Forecast, 2019-2031
- 8.1. Market Analysis, Insights and Forecast - by Ingredient Type
- 8.1.1. Protein
- 8.1.2. Polysaccharides
- 8.1.3. Lipids
- 8.1.4. Composites
- 8.2. Market Analysis, Insights and Forecast - by Application
- 8.2.1. Dairy products
- 8.2.2. Bakery and Confectionery
- 8.2.3. Fruits and Vegetables
- 8.2.4. Meat, Poultry, and Seafood
- 8.2.5. Other Applications
- 8.1. Market Analysis, Insights and Forecast - by Ingredient Type
- 9. South America Edible Packaging Market Analysis, Insights and Forecast, 2019-2031
- 9.1. Market Analysis, Insights and Forecast - by Ingredient Type
- 9.1.1. Protein
- 9.1.2. Polysaccharides
- 9.1.3. Lipids
- 9.1.4. Composites
- 9.2. Market Analysis, Insights and Forecast - by Application
- 9.2.1. Dairy products
- 9.2.2. Bakery and Confectionery
- 9.2.3. Fruits and Vegetables
- 9.2.4. Meat, Poultry, and Seafood
- 9.2.5. Other Applications
- 9.1. Market Analysis, Insights and Forecast - by Ingredient Type
- 10. Middle East and Africa Edible Packaging Market Analysis, Insights and Forecast, 2019-2031
- 10.1. Market Analysis, Insights and Forecast - by Ingredient Type
- 10.1.1. Protein
- 10.1.2. Polysaccharides
- 10.1.3. Lipids
- 10.1.4. Composites
- 10.2. Market Analysis, Insights and Forecast - by Application
- 10.2.1. Dairy products
- 10.2.2. Bakery and Confectionery
- 10.2.3. Fruits and Vegetables
- 10.2.4. Meat, Poultry, and Seafood
- 10.2.5. Other Applications
- 10.1. Market Analysis, Insights and Forecast - by Ingredient Type
- 11. North America Edible Packaging Market Analysis, Insights and Forecast, 2019-2031
- 11.1. Market Analysis, Insights and Forecast - By Country/Sub-region
- 11.1.1 United States
- 11.1.2 Canada
- 11.1.3 Mexico
- 11.1.4 Rest of North America
- 12. Europe Edible Packaging Market Analysis, Insights and Forecast, 2019-2031
- 12.1. Market Analysis, Insights and Forecast - By Country/Sub-region
- 12.1.1 United Kingdom
- 12.1.2 Germany
- 12.1.3 France
- 12.1.4 Italy
- 12.1.5 Spain
- 12.1.6 Rest of Europe
- 13. Asia Pacific Edible Packaging Market Analysis, Insights and Forecast, 2019-2031
- 13.1. Market Analysis, Insights and Forecast - By Country/Sub-region
- 13.1.1 India
- 13.1.2 China
- 13.1.3 Japan
- 13.1.4 Australia
- 13.1.5 Rest of Asia Pacific
- 14. South America Edible Packaging Market Analysis, Insights and Forecast, 2019-2031
- 14.1. Market Analysis, Insights and Forecast - By Country/Sub-region
- 14.1.1 Brazil
- 14.1.2 Argentina
- 14.1.3 Rest of South America
- 15. Middle East and Africa Edible Packaging Market Analysis, Insights and Forecast, 2019-2031
- 15.1. Market Analysis, Insights and Forecast - By Country/Sub-region
- 15.1.1 South Africa
- 15.1.2 Saudi Arabia
- 15.1.3 Rest of Middle East and Africa
- 16. Competitive Analysis
- 16.1. Global Market Share Analysis 2024
- 16.2. Company Profiles
- 16.2.1 Sufresca
- 16.2.1.1. Overview
- 16.2.1.2. Products
- 16.2.1.3. SWOT Analysis
- 16.2.1.4. Recent Developments
- 16.2.1.5. Financials (Based on Availability)
- 16.2.2 Sumitomo Chemical Co Ltd
- 16.2.2.1. Overview
- 16.2.2.2. Products
- 16.2.2.3. SWOT Analysis
- 16.2.2.4. Recent Developments
- 16.2.2.5. Financials (Based on Availability)
- 16.2.3 Cargill Incorporated
- 16.2.3.1. Overview
- 16.2.3.2. Products
- 16.2.3.3. SWOT Analysis
- 16.2.3.4. Recent Developments
- 16.2.3.5. Financials (Based on Availability)
- 16.2.4 Akorn Technology Inc *List Not Exhaustive
- 16.2.4.1. Overview
- 16.2.4.2. Products
- 16.2.4.3. SWOT Analysis
- 16.2.4.4. Recent Developments
- 16.2.4.5. Financials (Based on Availability)
- 16.2.5 AgroFresh Solutions Inc
- 16.2.5.1. Overview
- 16.2.5.2. Products
- 16.2.5.3. SWOT Analysis
- 16.2.5.4. Recent Developments
- 16.2.5.5. Financials (Based on Availability)
- 16.2.6 DuPont de Nemours Inc
- 16.2.6.1. Overview
- 16.2.6.2. Products
- 16.2.6.3. SWOT Analysis
- 16.2.6.4. Recent Developments
- 16.2.6.5. Financials (Based on Availability)
- 16.2.7 Nagase & Co Ltd
- 16.2.7.1. Overview
- 16.2.7.2. Products
- 16.2.7.3. SWOT Analysis
- 16.2.7.4. Recent Developments
- 16.2.7.5. Financials (Based on Availability)
- 16.2.8 Tate & Lyle PLC
- 16.2.8.1. Overview
- 16.2.8.2. Products
- 16.2.8.3. SWOT Analysis
- 16.2.8.4. Recent Developments
- 16.2.8.5. Financials (Based on Availability)
- 16.2.9 Koninklijke DSM N V
- 16.2.9.1. Overview
- 16.2.9.2. Products
- 16.2.9.3. SWOT Analysis
- 16.2.9.4. Recent Developments
- 16.2.9.5. Financials (Based on Availability)
- 16.2.10 RPM International Inc (Mantrose-Haeuser Co Inc )
- 16.2.10.1. Overview
- 16.2.10.2. Products
- 16.2.10.3. SWOT Analysis
- 16.2.10.4. Recent Developments
- 16.2.10.5. Financials (Based on Availability)
- 16.2.11 Ingredion Incorporated
- 16.2.11.1. Overview
- 16.2.11.2. Products
- 16.2.11.3. SWOT Analysis
- 16.2.11.4. Recent Developments
- 16.2.11.5. Financials (Based on Availability)
- 16.2.12 Pace International LLC
- 16.2.12.1. Overview
- 16.2.12.2. Products
- 16.2.12.3. SWOT Analysis
- 16.2.12.4. Recent Developments
- 16.2.12.5. Financials (Based on Availability)
- 16.2.13 DÖHler Group Se
- 16.2.13.1. Overview
- 16.2.13.2. Products
- 16.2.13.3. SWOT Analysis
- 16.2.13.4. Recent Developments
- 16.2.13.5. Financials (Based on Availability)
- 16.2.1 Sufresca
List of Figures
- Figure 1: Global Edible Packaging Market Revenue Breakdown (Million, %) by Region 2024 & 2032
- Figure 2: North America Edible Packaging Market Revenue (Million), by Country 2024 & 2032
- Figure 3: North America Edible Packaging Market Revenue Share (%), by Country 2024 & 2032
- Figure 4: Europe Edible Packaging Market Revenue (Million), by Country 2024 & 2032
- Figure 5: Europe Edible Packaging Market Revenue Share (%), by Country 2024 & 2032
- Figure 6: Asia Pacific Edible Packaging Market Revenue (Million), by Country 2024 & 2032
- Figure 7: Asia Pacific Edible Packaging Market Revenue Share (%), by Country 2024 & 2032
- Figure 8: South America Edible Packaging Market Revenue (Million), by Country 2024 & 2032
- Figure 9: South America Edible Packaging Market Revenue Share (%), by Country 2024 & 2032
- Figure 10: Middle East and Africa Edible Packaging Market Revenue (Million), by Country 2024 & 2032
- Figure 11: Middle East and Africa Edible Packaging Market Revenue Share (%), by Country 2024 & 2032
- Figure 12: North America Edible Packaging Market Revenue (Million), by Ingredient Type 2024 & 2032
- Figure 13: North America Edible Packaging Market Revenue Share (%), by Ingredient Type 2024 & 2032
- Figure 14: North America Edible Packaging Market Revenue (Million), by Application 2024 & 2032
- Figure 15: North America Edible Packaging Market Revenue Share (%), by Application 2024 & 2032
- Figure 16: North America Edible Packaging Market Revenue (Million), by Country 2024 & 2032
- Figure 17: North America Edible Packaging Market Revenue Share (%), by Country 2024 & 2032
- Figure 18: Europe Edible Packaging Market Revenue (Million), by Ingredient Type 2024 & 2032
- Figure 19: Europe Edible Packaging Market Revenue Share (%), by Ingredient Type 2024 & 2032
- Figure 20: Europe Edible Packaging Market Revenue (Million), by Application 2024 & 2032
- Figure 21: Europe Edible Packaging Market Revenue Share (%), by Application 2024 & 2032
- Figure 22: Europe Edible Packaging Market Revenue (Million), by Country 2024 & 2032
- Figure 23: Europe Edible Packaging Market Revenue Share (%), by Country 2024 & 2032
- Figure 24: Asia Pacific Edible Packaging Market Revenue (Million), by Ingredient Type 2024 & 2032
- Figure 25: Asia Pacific Edible Packaging Market Revenue Share (%), by Ingredient Type 2024 & 2032
- Figure 26: Asia Pacific Edible Packaging Market Revenue (Million), by Application 2024 & 2032
- Figure 27: Asia Pacific Edible Packaging Market Revenue Share (%), by Application 2024 & 2032
- Figure 28: Asia Pacific Edible Packaging Market Revenue (Million), by Country 2024 & 2032
- Figure 29: Asia Pacific Edible Packaging Market Revenue Share (%), by Country 2024 & 2032
- Figure 30: South America Edible Packaging Market Revenue (Million), by Ingredient Type 2024 & 2032
- Figure 31: South America Edible Packaging Market Revenue Share (%), by Ingredient Type 2024 & 2032
- Figure 32: South America Edible Packaging Market Revenue (Million), by Application 2024 & 2032
- Figure 33: South America Edible Packaging Market Revenue Share (%), by Application 2024 & 2032
- Figure 34: South America Edible Packaging Market Revenue (Million), by Country 2024 & 2032
- Figure 35: South America Edible Packaging Market Revenue Share (%), by Country 2024 & 2032
- Figure 36: Middle East and Africa Edible Packaging Market Revenue (Million), by Ingredient Type 2024 & 2032
- Figure 37: Middle East and Africa Edible Packaging Market Revenue Share (%), by Ingredient Type 2024 & 2032
- Figure 38: Middle East and Africa Edible Packaging Market Revenue (Million), by Application 2024 & 2032
- Figure 39: Middle East and Africa Edible Packaging Market Revenue Share (%), by Application 2024 & 2032
- Figure 40: Middle East and Africa Edible Packaging Market Revenue (Million), by Country 2024 & 2032
- Figure 41: Middle East and Africa Edible Packaging Market Revenue Share (%), by Country 2024 & 2032
List of Tables
- Table 1: Global Edible Packaging Market Revenue Million Forecast, by Region 2019 & 2032
- Table 2: Global Edible Packaging Market Revenue Million Forecast, by Ingredient Type 2019 & 2032
- Table 3: Global Edible Packaging Market Revenue Million Forecast, by Application 2019 & 2032
- Table 4: Global Edible Packaging Market Revenue Million Forecast, by Region 2019 & 2032
- Table 5: Global Edible Packaging Market Revenue Million Forecast, by Country 2019 & 2032
- Table 6: United States Edible Packaging Market Revenue (Million) Forecast, by Application 2019 & 2032
- Table 7: Canada Edible Packaging Market Revenue (Million) Forecast, by Application 2019 & 2032
- Table 8: Mexico Edible Packaging Market Revenue (Million) Forecast, by Application 2019 & 2032
- Table 9: Rest of North America Edible Packaging Market Revenue (Million) Forecast, by Application 2019 & 2032
- Table 10: Global Edible Packaging Market Revenue Million Forecast, by Country 2019 & 2032
- Table 11: United Kingdom Edible Packaging Market Revenue (Million) Forecast, by Application 2019 & 2032
- Table 12: Germany Edible Packaging Market Revenue (Million) Forecast, by Application 2019 & 2032
- Table 13: France Edible Packaging Market Revenue (Million) Forecast, by Application 2019 & 2032
- Table 14: Italy Edible Packaging Market Revenue (Million) Forecast, by Application 2019 & 2032
- Table 15: Spain Edible Packaging Market Revenue (Million) Forecast, by Application 2019 & 2032
- Table 16: Rest of Europe Edible Packaging Market Revenue (Million) Forecast, by Application 2019 & 2032
- Table 17: Global Edible Packaging Market Revenue Million Forecast, by Country 2019 & 2032
- Table 18: India Edible Packaging Market Revenue (Million) Forecast, by Application 2019 & 2032
- Table 19: China Edible Packaging Market Revenue (Million) Forecast, by Application 2019 & 2032
- Table 20: Japan Edible Packaging Market Revenue (Million) Forecast, by Application 2019 & 2032
- Table 21: Australia Edible Packaging Market Revenue (Million) Forecast, by Application 2019 & 2032
- Table 22: Rest of Asia Pacific Edible Packaging Market Revenue (Million) Forecast, by Application 2019 & 2032
- Table 23: Global Edible Packaging Market Revenue Million Forecast, by Country 2019 & 2032
- Table 24: Brazil Edible Packaging Market Revenue (Million) Forecast, by Application 2019 & 2032
- Table 25: Argentina Edible Packaging Market Revenue (Million) Forecast, by Application 2019 & 2032
- Table 26: Rest of South America Edible Packaging Market Revenue (Million) Forecast, by Application 2019 & 2032
- Table 27: Global Edible Packaging Market Revenue Million Forecast, by Country 2019 & 2032
- Table 28: South Africa Edible Packaging Market Revenue (Million) Forecast, by Application 2019 & 2032
- Table 29: Saudi Arabia Edible Packaging Market Revenue (Million) Forecast, by Application 2019 & 2032
- Table 30: Rest of Middle East and Africa Edible Packaging Market Revenue (Million) Forecast, by Application 2019 & 2032
- Table 31: Global Edible Packaging Market Revenue Million Forecast, by Ingredient Type 2019 & 2032
- Table 32: Global Edible Packaging Market Revenue Million Forecast, by Application 2019 & 2032
- Table 33: Global Edible Packaging Market Revenue Million Forecast, by Country 2019 & 2032
- Table 34: United States Edible Packaging Market Revenue (Million) Forecast, by Application 2019 & 2032
- Table 35: Canada Edible Packaging Market Revenue (Million) Forecast, by Application 2019 & 2032
- Table 36: Mexico Edible Packaging Market Revenue (Million) Forecast, by Application 2019 & 2032
- Table 37: Rest of North America Edible Packaging Market Revenue (Million) Forecast, by Application 2019 & 2032
- Table 38: Global Edible Packaging Market Revenue Million Forecast, by Ingredient Type 2019 & 2032
- Table 39: Global Edible Packaging Market Revenue Million Forecast, by Application 2019 & 2032
- Table 40: Global Edible Packaging Market Revenue Million Forecast, by Country 2019 & 2032
- Table 41: United Kingdom Edible Packaging Market Revenue (Million) Forecast, by Application 2019 & 2032
- Table 42: Germany Edible Packaging Market Revenue (Million) Forecast, by Application 2019 & 2032
- Table 43: France Edible Packaging Market Revenue (Million) Forecast, by Application 2019 & 2032
- Table 44: Italy Edible Packaging Market Revenue (Million) Forecast, by Application 2019 & 2032
- Table 45: Spain Edible Packaging Market Revenue (Million) Forecast, by Application 2019 & 2032
- Table 46: Rest of Europe Edible Packaging Market Revenue (Million) Forecast, by Application 2019 & 2032
- Table 47: Global Edible Packaging Market Revenue Million Forecast, by Ingredient Type 2019 & 2032
- Table 48: Global Edible Packaging Market Revenue Million Forecast, by Application 2019 & 2032
- Table 49: Global Edible Packaging Market Revenue Million Forecast, by Country 2019 & 2032
- Table 50: India Edible Packaging Market Revenue (Million) Forecast, by Application 2019 & 2032
- Table 51: China Edible Packaging Market Revenue (Million) Forecast, by Application 2019 & 2032
- Table 52: Japan Edible Packaging Market Revenue (Million) Forecast, by Application 2019 & 2032
- Table 53: Australia Edible Packaging Market Revenue (Million) Forecast, by Application 2019 & 2032
- Table 54: Rest of Asia Pacific Edible Packaging Market Revenue (Million) Forecast, by Application 2019 & 2032
- Table 55: Global Edible Packaging Market Revenue Million Forecast, by Ingredient Type 2019 & 2032
- Table 56: Global Edible Packaging Market Revenue Million Forecast, by Application 2019 & 2032
- Table 57: Global Edible Packaging Market Revenue Million Forecast, by Country 2019 & 2032
- Table 58: Brazil Edible Packaging Market Revenue (Million) Forecast, by Application 2019 & 2032
- Table 59: Argentina Edible Packaging Market Revenue (Million) Forecast, by Application 2019 & 2032
- Table 60: Rest of South America Edible Packaging Market Revenue (Million) Forecast, by Application 2019 & 2032
- Table 61: Global Edible Packaging Market Revenue Million Forecast, by Ingredient Type 2019 & 2032
- Table 62: Global Edible Packaging Market Revenue Million Forecast, by Application 2019 & 2032
- Table 63: Global Edible Packaging Market Revenue Million Forecast, by Country 2019 & 2032
- Table 64: South Africa Edible Packaging Market Revenue (Million) Forecast, by Application 2019 & 2032
- Table 65: Saudi Arabia Edible Packaging Market Revenue (Million) Forecast, by Application 2019 & 2032
- Table 66: Rest of Middle East and Africa Edible Packaging Market Revenue (Million) Forecast, by Application 2019 & 2032
Frequently Asked Questions
1. What is the projected Compound Annual Growth Rate (CAGR) of the Edible Packaging Market?
The projected CAGR is approximately 7.64%.
2. Which companies are prominent players in the Edible Packaging Market?
Key companies in the market include Sufresca, Sumitomo Chemical Co Ltd, Cargill Incorporated, Akorn Technology Inc *List Not Exhaustive, AgroFresh Solutions Inc, DuPont de Nemours Inc, Nagase & Co Ltd, Tate & Lyle PLC, Koninklijke DSM N V, RPM International Inc (Mantrose-Haeuser Co Inc ), Ingredion Incorporated, Pace International LLC, DÖHler Group Se.
3. What are the main segments of the Edible Packaging Market?
The market segments include Ingredient Type, Application.
4. Can you provide details about the market size?
The market size is estimated to be USD 3.32 Million as of 2022.
5. What are some drivers contributing to market growth?
Surge in Diabetic Population drives sweetener market; Growing demand for natural sweetener-infused beverage products.
6. What are the notable trends driving market growth?
Increasing Demand for Edible Packaging from Natural Resources.
7. Are there any restraints impacting market growth?
Stringent government regulations on food product claims.
8. Can you provide examples of recent developments in the market?
In January 2022, In the United States, Akorn Technology announced the commercial launch of its edible coatings for fresh produce. Akorn's smart and multi-functional edible food coatings double the shelf life of most fruits and vegetables, minimize cold chain losses by 30% or more and provide products with better flavor, texture, and appearance.
9. What pricing options are available for accessing the report?
Pricing options include single-user, multi-user, and enterprise licenses priced at USD 4750, USD 5250, and USD 8750 respectively.
10. Is the market size provided in terms of value or volume?
The market size is provided in terms of value, measured in Million.
11. Are there any specific market keywords associated with the report?
Yes, the market keyword associated with the report is "Edible Packaging Market," which aids in identifying and referencing the specific market segment covered.
12. How do I determine which pricing option suits my needs best?
The pricing options vary based on user requirements and access needs. Individual users may opt for single-user licenses, while businesses requiring broader access may choose multi-user or enterprise licenses for cost-effective access to the report.
13. Are there any additional resources or data provided in the Edible Packaging Market report?
While the report offers comprehensive insights, it's advisable to review the specific contents or supplementary materials provided to ascertain if additional resources or data are available.
14. How can I stay updated on further developments or reports in the Edible Packaging Market?
To stay informed about further developments, trends, and reports in the Edible Packaging Market, consider subscribing to industry newsletters, following relevant companies and organizations, or regularly checking reputable industry news sources and publications.
Methodology
Step 1 - Identification of Relevant Samples Size from Population Database


Step 2 - Approaches for Defining Global Market Size (Value, Volume* & Price*)

Note*: In applicable scenarios
Step 3 - Data Sources
Primary Research
- Web Analytics
- Survey Reports
- Research Institute
- Latest Research Reports
- Opinion Leaders
Secondary Research
- Annual Reports
- White Paper
- Latest Press Release
- Industry Association
- Paid Database
- Investor Presentations

Step 4 - Data Triangulation
Involves using different sources of information in order to increase the validity of a study
These sources are likely to be stakeholders in a program - participants, other researchers, program staff, other community members, and so on.
Then we put all data in single framework & apply various statistical tools to find out the dynamic on the market.
During the analysis stage, feedback from the stakeholder groups would be compared to determine areas of agreement as well as areas of divergence


