
Key Insights
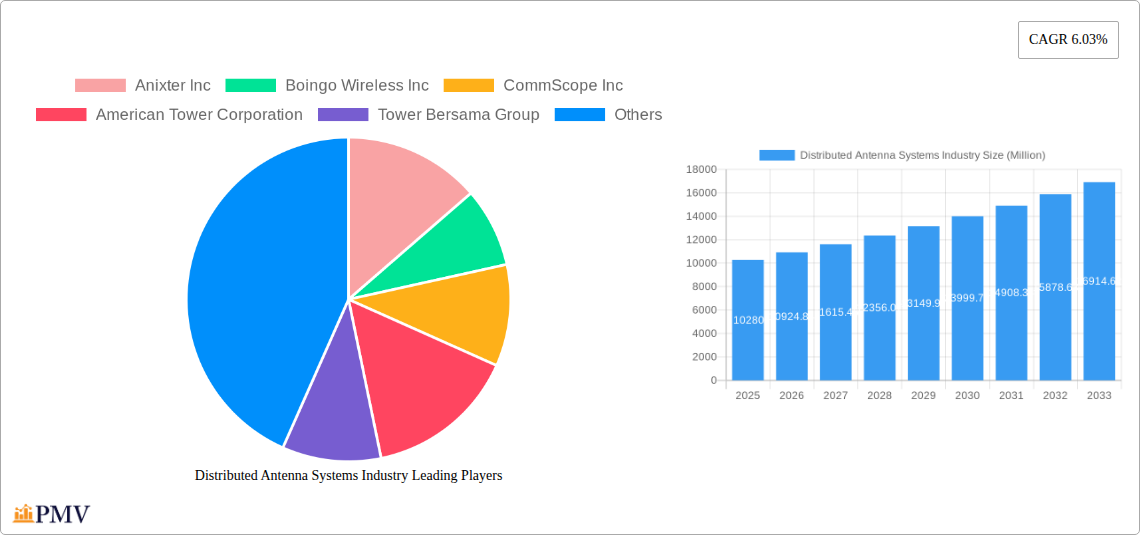
The Distributed Antenna System (DAS) market is experiencing robust growth, projected to reach a market size of $10.28 billion in 2025, exhibiting a Compound Annual Growth Rate (CAGR) of 6.03%. This expansion is fueled by several key drivers. The increasing demand for high-speed mobile broadband connectivity, particularly in densely populated urban areas and large venues, is a primary catalyst. Furthermore, the rising adoption of 5G technology necessitates DAS solutions to ensure optimal signal coverage and capacity. This is especially true in challenging environments like stadiums, hospitals, and transportation hubs. The proliferation of IoT devices also contributes significantly to the expanding market, as it increases the overall demand for reliable wireless infrastructure. Finally, stringent government regulations aimed at improving wireless coverage and quality are driving adoption, particularly in public safety applications.
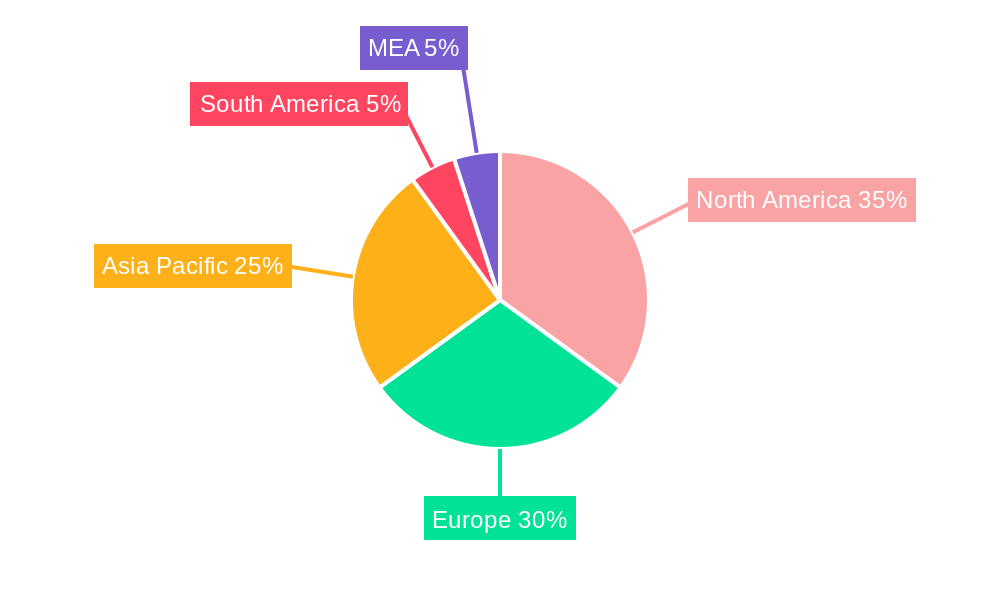
Segmentation analysis reveals a dynamic landscape. The Enterprise DAS segment dominates, driven by the need for reliable in-building communication for businesses. Active DAS solutions are currently preferred for their superior performance and flexibility, while the adoption of digital and hybrid DAS systems is projected to increase due to their improved efficiency and cost-effectiveness. Geographically, North America and Europe currently hold significant market shares, but the Asia-Pacific region is anticipated to witness rapid growth fueled by increasing urbanization and infrastructure development. Competitive landscape is characterized by a mix of established players such as CommScope, Corning, and American Tower, alongside emerging technology providers constantly innovating with new solutions and deployments. This competitive landscape encourages continuous improvement and innovation within the DAS industry, leading to more efficient and cost-effective solutions.
Distributed Antenna Systems (DAS) Industry: A Comprehensive Market Report (2019-2033)
This in-depth report provides a comprehensive analysis of the Distributed Antenna Systems (DAS) industry, covering market size, growth projections, competitive landscape, and key technological trends from 2019 to 2033. The report offers actionable insights for industry stakeholders, investors, and businesses seeking to navigate this dynamic market. With a base year of 2025 and a forecast period spanning 2025-2033, this report leverages historical data (2019-2024) to predict future market trajectories. The total market value is predicted to reach xx Million by 2033.
Distributed Antenna Systems Industry Market Structure & Competitive Dynamics
The Distributed Antenna Systems (DAS) market exhibits a moderately concentrated structure, with several key players holding significant market share. The industry is characterized by ongoing innovation, driven by the demand for improved wireless coverage and capacity. Regulatory frameworks, varying by region, influence deployment and standardization. Product substitution is limited, with DAS primarily competing with traditional cell tower infrastructure for improved indoor and dense urban coverage. End-user trends strongly favor DAS adoption across diverse sectors, fueled by increasing mobile data consumption and the rollout of 5G networks. Mergers and acquisitions (M&A) activity has been moderate, with larger players seeking to expand their market reach and technology portfolios. Estimated M&A deal values in the last 5 years totaled approximately xx Million. Market share data for key players (Anixter Inc, Boingo Wireless Inc, CommScope Inc, American Tower Corporation, Tower Bersama Group, Corning Inc, TE Connectivity Ltd, Comba Telecom Systems Holdings Ltd, Antenna Products Corporation, Cobham PLC, SOLiD Inc) is presented in the full report.
- Market Concentration: Moderate, with a few dominant players.
- Innovation Ecosystems: Strong, with ongoing R&D in 5G and beyond.
- Regulatory Frameworks: Varying by region, impacting deployment strategies.
- Product Substitutes: Limited; mainly traditional cell towers.
- End-User Trends: Strong growth across multiple sectors.
- M&A Activity: Moderate, with strategic acquisitions driving consolidation.
Distributed Antenna Systems Industry Industry Trends & Insights
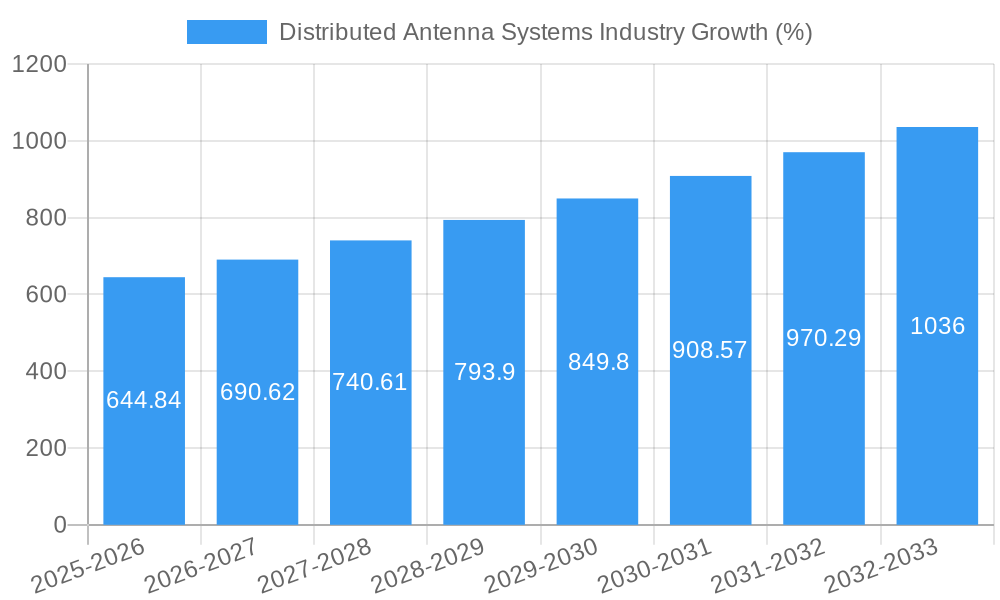
The DAS industry is experiencing robust growth, driven by the exponential increase in mobile data traffic, the widespread adoption of 5G networks, and the growing demand for reliable indoor and outdoor wireless connectivity. The Compound Annual Growth Rate (CAGR) is projected to be xx% during the forecast period (2025-2033). Technological disruptions, particularly in antenna design and signal processing, are enhancing DAS performance and efficiency. Consumer preferences are shifting toward seamless connectivity experiences, fueling demand for high-performance DAS solutions. Competitive dynamics are shaped by technological advancements, pricing strategies, and service offerings. Market penetration is increasing steadily, particularly in densely populated areas and high-traffic locations.
Dominant Markets & Segments in Distributed Antenna Systems Industry
The North American market currently holds a significant share of the global DAS market, driven by robust 5G deployment and a strong focus on public safety communication infrastructure. Within segments, the Enterprise DAS segment is experiencing the fastest growth due to the increasing demand for reliable connectivity in corporate settings and industrial facilities. The Public Safety DAS segment is also a key driver of market expansion, owing to the critical need for dependable communication systems in emergency response scenarios.
- Leading Region: North America
- Key Application Segments: Enterprise DAS, Public Safety DAS
- Key Type Segments: Active DAS, Hybrid DAS
- Key End-Users: Telecommunications, Healthcare, Government, Transportation
- Drivers:
- Economic Policies: Government initiatives supporting 5G infrastructure.
- Infrastructure Development: Expansion of transportation systems and smart city projects.
- Technological Advancements: Development of higher capacity, more energy efficient DAS solutions.
Distributed Antenna Systems Industry Product Innovations
Recent advancements in DAS technology focus on miniaturization, improved signal processing, and increased capacity. The integration of 5G and future wireless technologies is a key area of innovation, enabling higher data rates and improved network performance. These innovations address market demands for improved network coverage, capacity, and reliability. The move toward software-defined and cloud-based DAS systems is also gaining momentum, offering greater flexibility and scalability.
Report Segmentation & Scope
This report segments the DAS market by application (Enterprise DAS, Public Safety DAS, Other Applications), type (Active, Passive, Digital, Hybrid), and end-user (Manufacturing, Healthcare, Government, Transportation, Sports and Entertainment, Telecommunications, Other End-Users). Each segment is analyzed in terms of market size, growth projections, and competitive dynamics. For example, the Enterprise DAS segment is expected to witness significant growth due to increased demand for reliable in-building wireless coverage. The Public Safety DAS segment is experiencing strong growth driven by the importance of dependable communications in emergency response. The Hybrid DAS segment is gaining traction due to its ability to optimize performance and cost-efficiency.
Key Drivers of Distributed Antenna Systems Industry Growth
The DAS industry's growth is propelled by several factors: The rising adoption of 5G technology significantly boosts demand for DAS solutions to ensure effective coverage in dense urban environments and indoor settings. The growing need for reliable wireless connectivity across various sectors, including healthcare, transportation, and public safety, further fuels the expansion. Stringent government regulations mandating improved wireless coverage in certain areas also contribute to the market's growth.
Challenges in the Distributed Antenna Systems Industry Sector
The DAS market faces challenges, including high initial investment costs, complex deployment processes, and potential regulatory hurdles. Supply chain disruptions can impact component availability and manufacturing costs. Intense competition among DAS providers also poses a significant challenge, forcing companies to differentiate their offerings and optimize pricing strategies. These factors can influence market growth and profitability.
Leading Players in the Distributed Antenna Systems Industry Market
- Anixter Inc
- Boingo Wireless Inc
- CommScope Inc
- American Tower Corporation
- Tower Bersama Group
- Corning Incorporated
- TE Connectivity Ltd
- Comba Telecom Systems Holdings Ltd
- Antenna Products Corporation
- Cobham PLC
- SOLiD Inc
Key Developments in Distributed Antenna Systems Industry Sector
- July 2023: American Tower Corporation and Xcel Energy Center deployed a 5G DAS solution at the arena, enhancing fan engagement.
- October 2022: PROSE Technologies launched a new Active DAS system for 5G networks, including its first 5G in-building DAS in a major Mumbai commercial complex.
Strategic Distributed Antenna Systems Industry Market Outlook
The future of the DAS industry looks promising, with continued growth fueled by technological advancements, increasing demand for seamless connectivity, and expanding 5G deployments. Strategic opportunities lie in developing innovative DAS solutions for emerging applications, such as smart cities and industrial IoT deployments. Companies focusing on providing tailored solutions, optimizing deployment processes, and offering comprehensive service packages are expected to gain a competitive advantage in the long term.
Distributed Antenna Systems Industry Segmentation
-
1. Type
- 1.1. Active
- 1.2. Passive
- 1.3. Digital
- 1.4. Hybrid
-
2. End-User
- 2.1. Manufacturing
- 2.2. Healthcare
- 2.3. Government
- 2.4. Transportation
- 2.5. Sports and Entertainment
- 2.6. Telecommunications
- 2.7. Other End-Users
-
3. Application
- 3.1. Enterprise DAS
- 3.2. Public Safety DAS
- 3.3. Other Applications
Distributed Antenna Systems Industry Segmentation By Geography
- 1. North America
- 2. Europe
- 3. Asia
- 4. Australia and New Zealand
- 5. Latin America
- 6. Middle East and Africa
Distributed Antenna Systems Industry REPORT HIGHLIGHTS
| Aspects | Details |
|---|---|
| Study Period | 2019-2033 |
| Base Year | 2024 |
| Estimated Year | 2025 |
| Forecast Period | 2025-2033 |
| Historical Period | 2019-2024 |
| Growth Rate | CAGR of 6.03% from 2019-2033 |
| Segmentation |
|
Table of Contents
- 1. Introduction
- 1.1. Research Scope
- 1.2. Market Segmentation
- 1.3. Research Methodology
- 1.4. Definitions and Assumptions
- 2. Executive Summary
- 2.1. Introduction
- 3. Market Dynamics
- 3.1. Introduction
- 3.2. Market Drivers
- 3.2.1. DAS Ability to Support Multiple Telecom Carriers and Upcoming Technologies
- 3.3. Market Restrains
- 3.3.1. Lack of Awareness About Intellectual Property Outsourcing
- 3.4. Market Trends
- 3.4.1. Sport and Entertainment Segment to Hold a Significant Market Share
- 4. Market Factor Analysis
- 4.1. Porters Five Forces
- 4.2. Supply/Value Chain
- 4.3. PESTEL analysis
- 4.4. Market Entropy
- 4.5. Patent/Trademark Analysis
- 5. Global Distributed Antenna Systems Industry Analysis, Insights and Forecast, 2019-2031
- 5.1. Market Analysis, Insights and Forecast - by Type
- 5.1.1. Active
- 5.1.2. Passive
- 5.1.3. Digital
- 5.1.4. Hybrid
- 5.2. Market Analysis, Insights and Forecast - by End-User
- 5.2.1. Manufacturing
- 5.2.2. Healthcare
- 5.2.3. Government
- 5.2.4. Transportation
- 5.2.5. Sports and Entertainment
- 5.2.6. Telecommunications
- 5.2.7. Other End-Users
- 5.3. Market Analysis, Insights and Forecast - by Application
- 5.3.1. Enterprise DAS
- 5.3.2. Public Safety DAS
- 5.3.3. Other Applications
- 5.4. Market Analysis, Insights and Forecast - by Region
- 5.4.1. North America
- 5.4.2. Europe
- 5.4.3. Asia
- 5.4.4. Australia and New Zealand
- 5.4.5. Latin America
- 5.4.6. Middle East and Africa
- 5.1. Market Analysis, Insights and Forecast - by Type
- 6. North America Distributed Antenna Systems Industry Analysis, Insights and Forecast, 2019-2031
- 6.1. Market Analysis, Insights and Forecast - by Type
- 6.1.1. Active
- 6.1.2. Passive
- 6.1.3. Digital
- 6.1.4. Hybrid
- 6.2. Market Analysis, Insights and Forecast - by End-User
- 6.2.1. Manufacturing
- 6.2.2. Healthcare
- 6.2.3. Government
- 6.2.4. Transportation
- 6.2.5. Sports and Entertainment
- 6.2.6. Telecommunications
- 6.2.7. Other End-Users
- 6.3. Market Analysis, Insights and Forecast - by Application
- 6.3.1. Enterprise DAS
- 6.3.2. Public Safety DAS
- 6.3.3. Other Applications
- 6.1. Market Analysis, Insights and Forecast - by Type
- 7. Europe Distributed Antenna Systems Industry Analysis, Insights and Forecast, 2019-2031
- 7.1. Market Analysis, Insights and Forecast - by Type
- 7.1.1. Active
- 7.1.2. Passive
- 7.1.3. Digital
- 7.1.4. Hybrid
- 7.2. Market Analysis, Insights and Forecast - by End-User
- 7.2.1. Manufacturing
- 7.2.2. Healthcare
- 7.2.3. Government
- 7.2.4. Transportation
- 7.2.5. Sports and Entertainment
- 7.2.6. Telecommunications
- 7.2.7. Other End-Users
- 7.3. Market Analysis, Insights and Forecast - by Application
- 7.3.1. Enterprise DAS
- 7.3.2. Public Safety DAS
- 7.3.3. Other Applications
- 7.1. Market Analysis, Insights and Forecast - by Type
- 8. Asia Distributed Antenna Systems Industry Analysis, Insights and Forecast, 2019-2031
- 8.1. Market Analysis, Insights and Forecast - by Type
- 8.1.1. Active
- 8.1.2. Passive
- 8.1.3. Digital
- 8.1.4. Hybrid
- 8.2. Market Analysis, Insights and Forecast - by End-User
- 8.2.1. Manufacturing
- 8.2.2. Healthcare
- 8.2.3. Government
- 8.2.4. Transportation
- 8.2.5. Sports and Entertainment
- 8.2.6. Telecommunications
- 8.2.7. Other End-Users
- 8.3. Market Analysis, Insights and Forecast - by Application
- 8.3.1. Enterprise DAS
- 8.3.2. Public Safety DAS
- 8.3.3. Other Applications
- 8.1. Market Analysis, Insights and Forecast - by Type
- 9. Australia and New Zealand Distributed Antenna Systems Industry Analysis, Insights and Forecast, 2019-2031
- 9.1. Market Analysis, Insights and Forecast - by Type
- 9.1.1. Active
- 9.1.2. Passive
- 9.1.3. Digital
- 9.1.4. Hybrid
- 9.2. Market Analysis, Insights and Forecast - by End-User
- 9.2.1. Manufacturing
- 9.2.2. Healthcare
- 9.2.3. Government
- 9.2.4. Transportation
- 9.2.5. Sports and Entertainment
- 9.2.6. Telecommunications
- 9.2.7. Other End-Users
- 9.3. Market Analysis, Insights and Forecast - by Application
- 9.3.1. Enterprise DAS
- 9.3.2. Public Safety DAS
- 9.3.3. Other Applications
- 9.1. Market Analysis, Insights and Forecast - by Type
- 10. Latin America Distributed Antenna Systems Industry Analysis, Insights and Forecast, 2019-2031
- 10.1. Market Analysis, Insights and Forecast - by Type
- 10.1.1. Active
- 10.1.2. Passive
- 10.1.3. Digital
- 10.1.4. Hybrid
- 10.2. Market Analysis, Insights and Forecast - by End-User
- 10.2.1. Manufacturing
- 10.2.2. Healthcare
- 10.2.3. Government
- 10.2.4. Transportation
- 10.2.5. Sports and Entertainment
- 10.2.6. Telecommunications
- 10.2.7. Other End-Users
- 10.3. Market Analysis, Insights and Forecast - by Application
- 10.3.1. Enterprise DAS
- 10.3.2. Public Safety DAS
- 10.3.3. Other Applications
- 10.1. Market Analysis, Insights and Forecast - by Type
- 11. Middle East and Africa Distributed Antenna Systems Industry Analysis, Insights and Forecast, 2019-2031
- 11.1. Market Analysis, Insights and Forecast - by Type
- 11.1.1. Active
- 11.1.2. Passive
- 11.1.3. Digital
- 11.1.4. Hybrid
- 11.2. Market Analysis, Insights and Forecast - by End-User
- 11.2.1. Manufacturing
- 11.2.2. Healthcare
- 11.2.3. Government
- 11.2.4. Transportation
- 11.2.5. Sports and Entertainment
- 11.2.6. Telecommunications
- 11.2.7. Other End-Users
- 11.3. Market Analysis, Insights and Forecast - by Application
- 11.3.1. Enterprise DAS
- 11.3.2. Public Safety DAS
- 11.3.3. Other Applications
- 11.1. Market Analysis, Insights and Forecast - by Type
- 12. North America Distributed Antenna Systems Industry Analysis, Insights and Forecast, 2019-2031
- 12.1. Market Analysis, Insights and Forecast - By Country/Sub-region
- 12.1.1 United States
- 12.1.2 Canada
- 12.1.3 Mexico
- 13. Europe Distributed Antenna Systems Industry Analysis, Insights and Forecast, 2019-2031
- 13.1. Market Analysis, Insights and Forecast - By Country/Sub-region
- 13.1.1 Germany
- 13.1.2 United Kingdom
- 13.1.3 France
- 13.1.4 Spain
- 13.1.5 Italy
- 13.1.6 Spain
- 13.1.7 Belgium
- 13.1.8 Netherland
- 13.1.9 Nordics
- 13.1.10 Rest of Europe
- 14. Asia Pacific Distributed Antenna Systems Industry Analysis, Insights and Forecast, 2019-2031
- 14.1. Market Analysis, Insights and Forecast - By Country/Sub-region
- 14.1.1 China
- 14.1.2 Japan
- 14.1.3 India
- 14.1.4 South Korea
- 14.1.5 Southeast Asia
- 14.1.6 Australia
- 14.1.7 Indonesia
- 14.1.8 Phillipes
- 14.1.9 Singapore
- 14.1.10 Thailandc
- 14.1.11 Rest of Asia Pacific
- 15. South America Distributed Antenna Systems Industry Analysis, Insights and Forecast, 2019-2031
- 15.1. Market Analysis, Insights and Forecast - By Country/Sub-region
- 15.1.1 Brazil
- 15.1.2 Argentina
- 15.1.3 Peru
- 15.1.4 Chile
- 15.1.5 Colombia
- 15.1.6 Ecuador
- 15.1.7 Venezuela
- 15.1.8 Rest of South America
- 16. MEA Distributed Antenna Systems Industry Analysis, Insights and Forecast, 2019-2031
- 16.1. Market Analysis, Insights and Forecast - By Country/Sub-region
- 16.1.1 United Arab Emirates
- 16.1.2 Saudi Arabia
- 16.1.3 South Africa
- 16.1.4 Rest of Middle East and Africa
- 17. Competitive Analysis
- 17.1. Global Market Share Analysis 2024
- 17.2. Company Profiles
- 17.2.1 Anixter Inc
- 17.2.1.1. Overview
- 17.2.1.2. Products
- 17.2.1.3. SWOT Analysis
- 17.2.1.4. Recent Developments
- 17.2.1.5. Financials (Based on Availability)
- 17.2.2 Boingo Wireless Inc
- 17.2.2.1. Overview
- 17.2.2.2. Products
- 17.2.2.3. SWOT Analysis
- 17.2.2.4. Recent Developments
- 17.2.2.5. Financials (Based on Availability)
- 17.2.3 CommScope Inc
- 17.2.3.1. Overview
- 17.2.3.2. Products
- 17.2.3.3. SWOT Analysis
- 17.2.3.4. Recent Developments
- 17.2.3.5. Financials (Based on Availability)
- 17.2.4 American Tower Corporation
- 17.2.4.1. Overview
- 17.2.4.2. Products
- 17.2.4.3. SWOT Analysis
- 17.2.4.4. Recent Developments
- 17.2.4.5. Financials (Based on Availability)
- 17.2.5 Tower Bersama Group
- 17.2.5.1. Overview
- 17.2.5.2. Products
- 17.2.5.3. SWOT Analysis
- 17.2.5.4. Recent Developments
- 17.2.5.5. Financials (Based on Availability)
- 17.2.6 Corning Inc
- 17.2.6.1. Overview
- 17.2.6.2. Products
- 17.2.6.3. SWOT Analysis
- 17.2.6.4. Recent Developments
- 17.2.6.5. Financials (Based on Availability)
- 17.2.7 TE Connectivity Ltd
- 17.2.7.1. Overview
- 17.2.7.2. Products
- 17.2.7.3. SWOT Analysis
- 17.2.7.4. Recent Developments
- 17.2.7.5. Financials (Based on Availability)
- 17.2.8 Comba Telecom Systems Holdings Ltd
- 17.2.8.1. Overview
- 17.2.8.2. Products
- 17.2.8.3. SWOT Analysis
- 17.2.8.4. Recent Developments
- 17.2.8.5. Financials (Based on Availability)
- 17.2.9 Antenna Products Corporation
- 17.2.9.1. Overview
- 17.2.9.2. Products
- 17.2.9.3. SWOT Analysis
- 17.2.9.4. Recent Developments
- 17.2.9.5. Financials (Based on Availability)
- 17.2.10 Cobham PLC
- 17.2.10.1. Overview
- 17.2.10.2. Products
- 17.2.10.3. SWOT Analysis
- 17.2.10.4. Recent Developments
- 17.2.10.5. Financials (Based on Availability)
- 17.2.11 SOLiD Inc
- 17.2.11.1. Overview
- 17.2.11.2. Products
- 17.2.11.3. SWOT Analysis
- 17.2.11.4. Recent Developments
- 17.2.11.5. Financials (Based on Availability)
- 17.2.1 Anixter Inc
List of Figures
- Figure 1: Global Distributed Antenna Systems Industry Revenue Breakdown (Million, %) by Region 2024 & 2032
- Figure 2: North America Distributed Antenna Systems Industry Revenue (Million), by Country 2024 & 2032
- Figure 3: North America Distributed Antenna Systems Industry Revenue Share (%), by Country 2024 & 2032
- Figure 4: Europe Distributed Antenna Systems Industry Revenue (Million), by Country 2024 & 2032
- Figure 5: Europe Distributed Antenna Systems Industry Revenue Share (%), by Country 2024 & 2032
- Figure 6: Asia Pacific Distributed Antenna Systems Industry Revenue (Million), by Country 2024 & 2032
- Figure 7: Asia Pacific Distributed Antenna Systems Industry Revenue Share (%), by Country 2024 & 2032
- Figure 8: South America Distributed Antenna Systems Industry Revenue (Million), by Country 2024 & 2032
- Figure 9: South America Distributed Antenna Systems Industry Revenue Share (%), by Country 2024 & 2032
- Figure 10: MEA Distributed Antenna Systems Industry Revenue (Million), by Country 2024 & 2032
- Figure 11: MEA Distributed Antenna Systems Industry Revenue Share (%), by Country 2024 & 2032
- Figure 12: North America Distributed Antenna Systems Industry Revenue (Million), by Type 2024 & 2032
- Figure 13: North America Distributed Antenna Systems Industry Revenue Share (%), by Type 2024 & 2032
- Figure 14: North America Distributed Antenna Systems Industry Revenue (Million), by End-User 2024 & 2032
- Figure 15: North America Distributed Antenna Systems Industry Revenue Share (%), by End-User 2024 & 2032
- Figure 16: North America Distributed Antenna Systems Industry Revenue (Million), by Application 2024 & 2032
- Figure 17: North America Distributed Antenna Systems Industry Revenue Share (%), by Application 2024 & 2032
- Figure 18: North America Distributed Antenna Systems Industry Revenue (Million), by Country 2024 & 2032
- Figure 19: North America Distributed Antenna Systems Industry Revenue Share (%), by Country 2024 & 2032
- Figure 20: Europe Distributed Antenna Systems Industry Revenue (Million), by Type 2024 & 2032
- Figure 21: Europe Distributed Antenna Systems Industry Revenue Share (%), by Type 2024 & 2032
- Figure 22: Europe Distributed Antenna Systems Industry Revenue (Million), by End-User 2024 & 2032
- Figure 23: Europe Distributed Antenna Systems Industry Revenue Share (%), by End-User 2024 & 2032
- Figure 24: Europe Distributed Antenna Systems Industry Revenue (Million), by Application 2024 & 2032
- Figure 25: Europe Distributed Antenna Systems Industry Revenue Share (%), by Application 2024 & 2032
- Figure 26: Europe Distributed Antenna Systems Industry Revenue (Million), by Country 2024 & 2032
- Figure 27: Europe Distributed Antenna Systems Industry Revenue Share (%), by Country 2024 & 2032
- Figure 28: Asia Distributed Antenna Systems Industry Revenue (Million), by Type 2024 & 2032
- Figure 29: Asia Distributed Antenna Systems Industry Revenue Share (%), by Type 2024 & 2032
- Figure 30: Asia Distributed Antenna Systems Industry Revenue (Million), by End-User 2024 & 2032
- Figure 31: Asia Distributed Antenna Systems Industry Revenue Share (%), by End-User 2024 & 2032
- Figure 32: Asia Distributed Antenna Systems Industry Revenue (Million), by Application 2024 & 2032
- Figure 33: Asia Distributed Antenna Systems Industry Revenue Share (%), by Application 2024 & 2032
- Figure 34: Asia Distributed Antenna Systems Industry Revenue (Million), by Country 2024 & 2032
- Figure 35: Asia Distributed Antenna Systems Industry Revenue Share (%), by Country 2024 & 2032
- Figure 36: Australia and New Zealand Distributed Antenna Systems Industry Revenue (Million), by Type 2024 & 2032
- Figure 37: Australia and New Zealand Distributed Antenna Systems Industry Revenue Share (%), by Type 2024 & 2032
- Figure 38: Australia and New Zealand Distributed Antenna Systems Industry Revenue (Million), by End-User 2024 & 2032
- Figure 39: Australia and New Zealand Distributed Antenna Systems Industry Revenue Share (%), by End-User 2024 & 2032
- Figure 40: Australia and New Zealand Distributed Antenna Systems Industry Revenue (Million), by Application 2024 & 2032
- Figure 41: Australia and New Zealand Distributed Antenna Systems Industry Revenue Share (%), by Application 2024 & 2032
- Figure 42: Australia and New Zealand Distributed Antenna Systems Industry Revenue (Million), by Country 2024 & 2032
- Figure 43: Australia and New Zealand Distributed Antenna Systems Industry Revenue Share (%), by Country 2024 & 2032
- Figure 44: Latin America Distributed Antenna Systems Industry Revenue (Million), by Type 2024 & 2032
- Figure 45: Latin America Distributed Antenna Systems Industry Revenue Share (%), by Type 2024 & 2032
- Figure 46: Latin America Distributed Antenna Systems Industry Revenue (Million), by End-User 2024 & 2032
- Figure 47: Latin America Distributed Antenna Systems Industry Revenue Share (%), by End-User 2024 & 2032
- Figure 48: Latin America Distributed Antenna Systems Industry Revenue (Million), by Application 2024 & 2032
- Figure 49: Latin America Distributed Antenna Systems Industry Revenue Share (%), by Application 2024 & 2032
- Figure 50: Latin America Distributed Antenna Systems Industry Revenue (Million), by Country 2024 & 2032
- Figure 51: Latin America Distributed Antenna Systems Industry Revenue Share (%), by Country 2024 & 2032
- Figure 52: Middle East and Africa Distributed Antenna Systems Industry Revenue (Million), by Type 2024 & 2032
- Figure 53: Middle East and Africa Distributed Antenna Systems Industry Revenue Share (%), by Type 2024 & 2032
- Figure 54: Middle East and Africa Distributed Antenna Systems Industry Revenue (Million), by End-User 2024 & 2032
- Figure 55: Middle East and Africa Distributed Antenna Systems Industry Revenue Share (%), by End-User 2024 & 2032
- Figure 56: Middle East and Africa Distributed Antenna Systems Industry Revenue (Million), by Application 2024 & 2032
- Figure 57: Middle East and Africa Distributed Antenna Systems Industry Revenue Share (%), by Application 2024 & 2032
- Figure 58: Middle East and Africa Distributed Antenna Systems Industry Revenue (Million), by Country 2024 & 2032
- Figure 59: Middle East and Africa Distributed Antenna Systems Industry Revenue Share (%), by Country 2024 & 2032
List of Tables
- Table 1: Global Distributed Antenna Systems Industry Revenue Million Forecast, by Region 2019 & 2032
- Table 2: Global Distributed Antenna Systems Industry Revenue Million Forecast, by Type 2019 & 2032
- Table 3: Global Distributed Antenna Systems Industry Revenue Million Forecast, by End-User 2019 & 2032
- Table 4: Global Distributed Antenna Systems Industry Revenue Million Forecast, by Application 2019 & 2032
- Table 5: Global Distributed Antenna Systems Industry Revenue Million Forecast, by Region 2019 & 2032
- Table 6: Global Distributed Antenna Systems Industry Revenue Million Forecast, by Country 2019 & 2032
- Table 7: United States Distributed Antenna Systems Industry Revenue (Million) Forecast, by Application 2019 & 2032
- Table 8: Canada Distributed Antenna Systems Industry Revenue (Million) Forecast, by Application 2019 & 2032
- Table 9: Mexico Distributed Antenna Systems Industry Revenue (Million) Forecast, by Application 2019 & 2032
- Table 10: Global Distributed Antenna Systems Industry Revenue Million Forecast, by Country 2019 & 2032
- Table 11: Germany Distributed Antenna Systems Industry Revenue (Million) Forecast, by Application 2019 & 2032
- Table 12: United Kingdom Distributed Antenna Systems Industry Revenue (Million) Forecast, by Application 2019 & 2032
- Table 13: France Distributed Antenna Systems Industry Revenue (Million) Forecast, by Application 2019 & 2032
- Table 14: Spain Distributed Antenna Systems Industry Revenue (Million) Forecast, by Application 2019 & 2032
- Table 15: Italy Distributed Antenna Systems Industry Revenue (Million) Forecast, by Application 2019 & 2032
- Table 16: Spain Distributed Antenna Systems Industry Revenue (Million) Forecast, by Application 2019 & 2032
- Table 17: Belgium Distributed Antenna Systems Industry Revenue (Million) Forecast, by Application 2019 & 2032
- Table 18: Netherland Distributed Antenna Systems Industry Revenue (Million) Forecast, by Application 2019 & 2032
- Table 19: Nordics Distributed Antenna Systems Industry Revenue (Million) Forecast, by Application 2019 & 2032
- Table 20: Rest of Europe Distributed Antenna Systems Industry Revenue (Million) Forecast, by Application 2019 & 2032
- Table 21: Global Distributed Antenna Systems Industry Revenue Million Forecast, by Country 2019 & 2032
- Table 22: China Distributed Antenna Systems Industry Revenue (Million) Forecast, by Application 2019 & 2032
- Table 23: Japan Distributed Antenna Systems Industry Revenue (Million) Forecast, by Application 2019 & 2032
- Table 24: India Distributed Antenna Systems Industry Revenue (Million) Forecast, by Application 2019 & 2032
- Table 25: South Korea Distributed Antenna Systems Industry Revenue (Million) Forecast, by Application 2019 & 2032
- Table 26: Southeast Asia Distributed Antenna Systems Industry Revenue (Million) Forecast, by Application 2019 & 2032
- Table 27: Australia Distributed Antenna Systems Industry Revenue (Million) Forecast, by Application 2019 & 2032
- Table 28: Indonesia Distributed Antenna Systems Industry Revenue (Million) Forecast, by Application 2019 & 2032
- Table 29: Phillipes Distributed Antenna Systems Industry Revenue (Million) Forecast, by Application 2019 & 2032
- Table 30: Singapore Distributed Antenna Systems Industry Revenue (Million) Forecast, by Application 2019 & 2032
- Table 31: Thailandc Distributed Antenna Systems Industry Revenue (Million) Forecast, by Application 2019 & 2032
- Table 32: Rest of Asia Pacific Distributed Antenna Systems Industry Revenue (Million) Forecast, by Application 2019 & 2032
- Table 33: Global Distributed Antenna Systems Industry Revenue Million Forecast, by Country 2019 & 2032
- Table 34: Brazil Distributed Antenna Systems Industry Revenue (Million) Forecast, by Application 2019 & 2032
- Table 35: Argentina Distributed Antenna Systems Industry Revenue (Million) Forecast, by Application 2019 & 2032
- Table 36: Peru Distributed Antenna Systems Industry Revenue (Million) Forecast, by Application 2019 & 2032
- Table 37: Chile Distributed Antenna Systems Industry Revenue (Million) Forecast, by Application 2019 & 2032
- Table 38: Colombia Distributed Antenna Systems Industry Revenue (Million) Forecast, by Application 2019 & 2032
- Table 39: Ecuador Distributed Antenna Systems Industry Revenue (Million) Forecast, by Application 2019 & 2032
- Table 40: Venezuela Distributed Antenna Systems Industry Revenue (Million) Forecast, by Application 2019 & 2032
- Table 41: Rest of South America Distributed Antenna Systems Industry Revenue (Million) Forecast, by Application 2019 & 2032
- Table 42: Global Distributed Antenna Systems Industry Revenue Million Forecast, by Country 2019 & 2032
- Table 43: United Arab Emirates Distributed Antenna Systems Industry Revenue (Million) Forecast, by Application 2019 & 2032
- Table 44: Saudi Arabia Distributed Antenna Systems Industry Revenue (Million) Forecast, by Application 2019 & 2032
- Table 45: South Africa Distributed Antenna Systems Industry Revenue (Million) Forecast, by Application 2019 & 2032
- Table 46: Rest of Middle East and Africa Distributed Antenna Systems Industry Revenue (Million) Forecast, by Application 2019 & 2032
- Table 47: Global Distributed Antenna Systems Industry Revenue Million Forecast, by Type 2019 & 2032
- Table 48: Global Distributed Antenna Systems Industry Revenue Million Forecast, by End-User 2019 & 2032
- Table 49: Global Distributed Antenna Systems Industry Revenue Million Forecast, by Application 2019 & 2032
- Table 50: Global Distributed Antenna Systems Industry Revenue Million Forecast, by Country 2019 & 2032
- Table 51: Global Distributed Antenna Systems Industry Revenue Million Forecast, by Type 2019 & 2032
- Table 52: Global Distributed Antenna Systems Industry Revenue Million Forecast, by End-User 2019 & 2032
- Table 53: Global Distributed Antenna Systems Industry Revenue Million Forecast, by Application 2019 & 2032
- Table 54: Global Distributed Antenna Systems Industry Revenue Million Forecast, by Country 2019 & 2032
- Table 55: Global Distributed Antenna Systems Industry Revenue Million Forecast, by Type 2019 & 2032
- Table 56: Global Distributed Antenna Systems Industry Revenue Million Forecast, by End-User 2019 & 2032
- Table 57: Global Distributed Antenna Systems Industry Revenue Million Forecast, by Application 2019 & 2032
- Table 58: Global Distributed Antenna Systems Industry Revenue Million Forecast, by Country 2019 & 2032
- Table 59: Global Distributed Antenna Systems Industry Revenue Million Forecast, by Type 2019 & 2032
- Table 60: Global Distributed Antenna Systems Industry Revenue Million Forecast, by End-User 2019 & 2032
- Table 61: Global Distributed Antenna Systems Industry Revenue Million Forecast, by Application 2019 & 2032
- Table 62: Global Distributed Antenna Systems Industry Revenue Million Forecast, by Country 2019 & 2032
- Table 63: Global Distributed Antenna Systems Industry Revenue Million Forecast, by Type 2019 & 2032
- Table 64: Global Distributed Antenna Systems Industry Revenue Million Forecast, by End-User 2019 & 2032
- Table 65: Global Distributed Antenna Systems Industry Revenue Million Forecast, by Application 2019 & 2032
- Table 66: Global Distributed Antenna Systems Industry Revenue Million Forecast, by Country 2019 & 2032
- Table 67: Global Distributed Antenna Systems Industry Revenue Million Forecast, by Type 2019 & 2032
- Table 68: Global Distributed Antenna Systems Industry Revenue Million Forecast, by End-User 2019 & 2032
- Table 69: Global Distributed Antenna Systems Industry Revenue Million Forecast, by Application 2019 & 2032
- Table 70: Global Distributed Antenna Systems Industry Revenue Million Forecast, by Country 2019 & 2032
Frequently Asked Questions
1. What is the projected Compound Annual Growth Rate (CAGR) of the Distributed Antenna Systems Industry?
The projected CAGR is approximately 6.03%.
2. Which companies are prominent players in the Distributed Antenna Systems Industry?
Key companies in the market include Anixter Inc, Boingo Wireless Inc, CommScope Inc, American Tower Corporation, Tower Bersama Group, Corning Inc, TE Connectivity Ltd, Comba Telecom Systems Holdings Ltd, Antenna Products Corporation, Cobham PLC, SOLiD Inc.
3. What are the main segments of the Distributed Antenna Systems Industry?
The market segments include Type, End-User, Application.
4. Can you provide details about the market size?
The market size is estimated to be USD 10.28 Million as of 2022.
5. What are some drivers contributing to market growth?
DAS Ability to Support Multiple Telecom Carriers and Upcoming Technologies.
6. What are the notable trends driving market growth?
Sport and Entertainment Segment to Hold a Significant Market Share.
7. Are there any restraints impacting market growth?
Lack of Awareness About Intellectual Property Outsourcing.
8. Can you provide examples of recent developments in the market?
July 2023: American Tower Corporation and Xcel Energy Center announced the deployment of a Distributed Antenna System (DAS) solution that will bring 5G technology to the arena. The company enters a new era of fan engagement and provides cutting-edge applications for the Minnesota Wild fans, with an updated, neutral-host 5G DAS.
9. What pricing options are available for accessing the report?
Pricing options include single-user, multi-user, and enterprise licenses priced at USD 4750, USD 5250, and USD 8750 respectively.
10. Is the market size provided in terms of value or volume?
The market size is provided in terms of value, measured in Million.
11. Are there any specific market keywords associated with the report?
Yes, the market keyword associated with the report is "Distributed Antenna Systems Industry," which aids in identifying and referencing the specific market segment covered.
12. How do I determine which pricing option suits my needs best?
The pricing options vary based on user requirements and access needs. Individual users may opt for single-user licenses, while businesses requiring broader access may choose multi-user or enterprise licenses for cost-effective access to the report.
13. Are there any additional resources or data provided in the Distributed Antenna Systems Industry report?
While the report offers comprehensive insights, it's advisable to review the specific contents or supplementary materials provided to ascertain if additional resources or data are available.
14. How can I stay updated on further developments or reports in the Distributed Antenna Systems Industry?
To stay informed about further developments, trends, and reports in the Distributed Antenna Systems Industry, consider subscribing to industry newsletters, following relevant companies and organizations, or regularly checking reputable industry news sources and publications.
Methodology
Step 1 - Identification of Relevant Samples Size from Population Database


Step 2 - Approaches for Defining Global Market Size (Value, Volume* & Price*)

Note*: In applicable scenarios
Step 3 - Data Sources
Primary Research
- Web Analytics
- Survey Reports
- Research Institute
- Latest Research Reports
- Opinion Leaders
Secondary Research
- Annual Reports
- White Paper
- Latest Press Release
- Industry Association
- Paid Database
- Investor Presentations

Step 4 - Data Triangulation
Involves using different sources of information in order to increase the validity of a study
These sources are likely to be stakeholders in a program - participants, other researchers, program staff, other community members, and so on.
Then we put all data in single framework & apply various statistical tools to find out the dynamic on the market.
During the analysis stage, feedback from the stakeholder groups would be compared to determine areas of agreement as well as areas of divergence


