
Key Insights
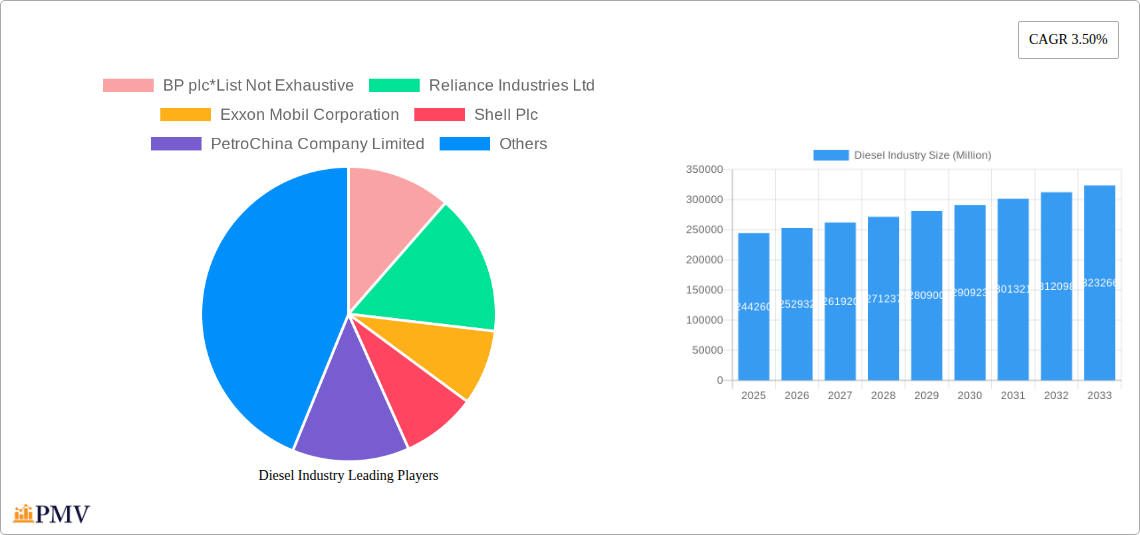
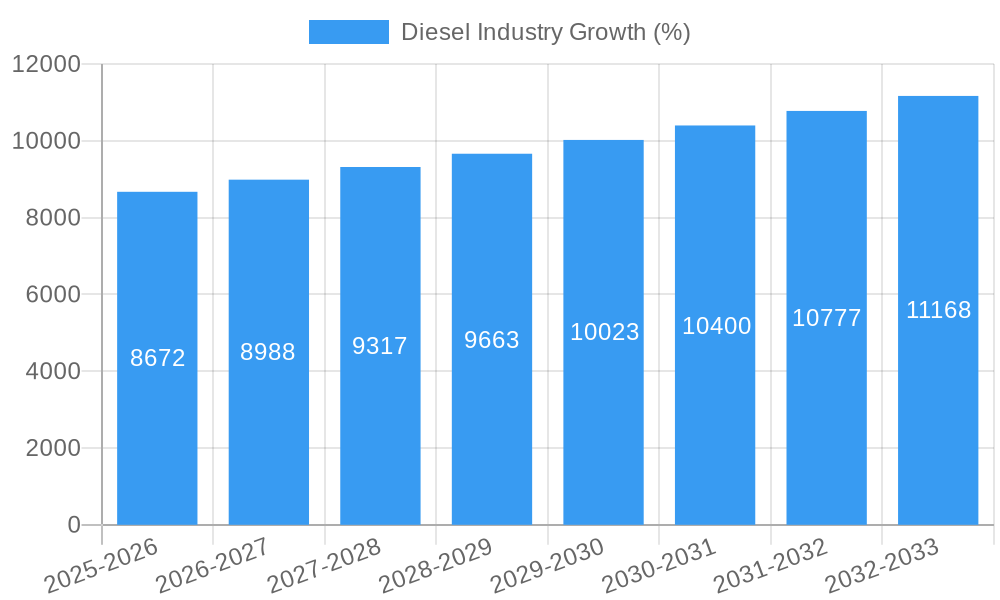
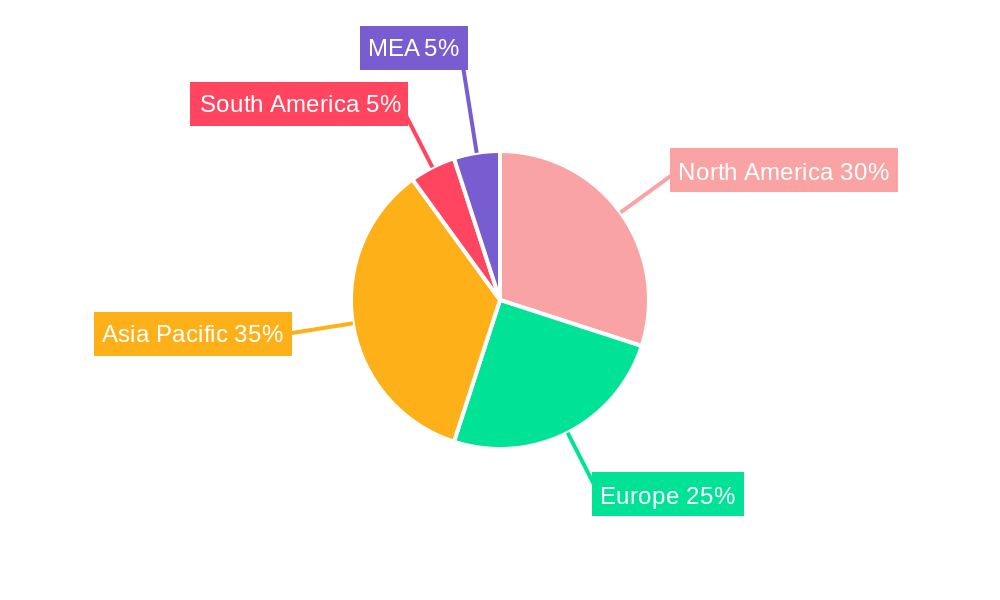
The global diesel fuel market, valued at $244.26 billion in 2025, is projected to experience steady growth, driven primarily by the robust transportation and industrial sectors. A compound annual growth rate (CAGR) of 3.50% from 2025 to 2033 indicates a continuous, albeit moderate, expansion. Key growth drivers include increasing global freight transportation needs, particularly in emerging economies experiencing rapid industrialization. This necessitates higher diesel consumption for trucking, shipping, and construction activities. Furthermore, the lack of readily available and cost-effective alternatives in many heavy-duty applications continues to support diesel demand. However, stringent emission regulations and growing environmental concerns are acting as significant restraints, pushing the industry towards cleaner fuel technologies and potentially slowing growth in the long term. The market is segmented by end-user, with transportation holding the largest share followed by the industrial sector. Major players like BP, Reliance Industries, ExxonMobil, and Shell are shaping the market through their production capabilities, distribution networks, and investments in research and development of more sustainable diesel alternatives. Regional analysis indicates North America and Asia Pacific as significant markets due to their strong industrial and transportation activities, while the Middle East and Africa also contribute substantially due to its extensive reliance on diesel-powered vehicles and equipment.
The market's future trajectory will significantly depend on the adoption rate of alternative fuels and the stringency of environmental regulations. While the current forecast points to continued growth, the industry is under pressure to innovate and adapt. Investments in cleaner diesel technologies, such as biofuels and advanced emission control systems, are becoming crucial for long-term sustainability and market competitiveness. Government policies and incentives promoting alternative energy sources will also greatly influence the market’s evolution in the coming years. Despite these challenges, the consistent demand from the industrial and transportation sectors suggests a stable outlook, with growth potentially accelerating if emerging economies continue their rapid development and urbanization.
This comprehensive report provides a detailed analysis of the global diesel industry, offering invaluable insights for businesses, investors, and policymakers. With a study period spanning 2019-2033, a base year of 2025, and a forecast period of 2025-2033, this report leverages historical data (2019-2024) to project future trends and opportunities within the dynamic diesel market, valued at xx Million in 2025 and projected to reach xx Million by 2033. The report delves into market structure, competitive dynamics, industry trends, key segments, and leading players, providing actionable intelligence to navigate the complexities of this evolving sector.
Diesel Industry Market Structure & Competitive Dynamics
The global diesel industry is characterized by a high degree of concentration, with a few major players controlling a significant market share. Companies like BP plc, Reliance Industries Ltd, Exxon Mobil Corporation, Shell Plc, PetroChina Company Limited, NK Rosneft' PAO, Chevron Corporation, Saudi Arabian Oil Co, Qatar Petroleum, and SK energy Co Ltd dominate the landscape. The market share of these companies varies across regions and segments, with ongoing M&A activities reshaping the competitive landscape. Deal values in recent years have totalled xx Million, impacting market concentration and influencing innovation ecosystems.
- Market Concentration: High, with top 10 players holding xx% of market share in 2025.
- Innovation Ecosystems: Primarily focused on efficiency improvements, emissions reduction technologies, and alternative fuel development.
- Regulatory Frameworks: Stringent emission standards and fuel quality regulations drive innovation and shape market dynamics.
- Product Substitutes: Growing adoption of electric vehicles and alternative fuels poses a significant threat to the diesel market.
- End-User Trends: A shift towards stricter emission norms and increasing demand for fuel efficiency are influencing consumer preferences.
- M&A Activities: Recent mergers and acquisitions have focused on consolidating market share, expanding geographic reach, and acquiring new technologies.
Diesel Industry Industry Trends & Insights
The diesel industry is experiencing a period of significant transformation. While the historical period (2019-2024) saw steady growth, driven primarily by industrial and transportation demand, the forecast period (2025-2033) will be marked by challenges and opportunities. The industry’s CAGR is projected to be xx% during the forecast period. Factors such as stringent environmental regulations, the rising adoption of electric vehicles, and fluctuations in crude oil prices significantly influence market growth. Technological advancements in engine efficiency and emission control technologies are critical to mitigating the impact of these challenges. Market penetration of advanced diesel technologies is expected to reach xx% by 2033. The evolving consumer preference for sustainable and efficient transportation solutions poses both opportunities and risks for existing diesel players.
Dominant Markets & Segments in Diesel Industry
The transportation sector remains the dominant end-user segment for diesel fuel, followed by industrial applications and other niche uses. Asia-Pacific is projected to be the leading region for diesel consumption in 2025 and beyond, driven by robust economic growth, expanding infrastructure projects, and increasing industrialization.
- Transportation: Key drivers include growing vehicle populations, freight transport needs, and limited availability of alternative fuels in some regions.
- Industrial: Diesel fuel is crucial for various industrial processes, including power generation, construction, and agriculture. This sector's growth is intertwined with overall industrial output and manufacturing expansion.
- Others: This segment encompasses various applications, including off-road machinery and marine transport. Growth hinges on the performance of specific sectors such as construction and shipping.
Dominance Analysis: The continued dominance of the transportation segment is projected, though the rate of growth is expected to slow down in the coming years due to the increasing adoption of electric vehicles. This shift presents a considerable challenge for the industry.
Diesel Industry Product Innovations
Recent innovations in diesel technology focus on improving fuel efficiency, reducing emissions (particularly NOx and particulate matter), and enhancing engine performance. Advanced fuel injection systems, optimized combustion strategies, and selective catalytic reduction (SCR) technologies are key advancements addressing stricter emission standards and enhancing market competitiveness. The development of biodiesel and other alternative diesel fuels is also a significant area of focus, catering to growing environmental concerns.
Report Segmentation & Scope
The report segments the diesel industry based on the end-user applications.
Transportation: This segment covers on-road and off-road vehicles, including cars, trucks, buses, and construction equipment. Growth projections are linked to vehicle sales, economic activity, and fuel efficiency standards. Competition is intense, with a focus on cost-effectiveness and emission compliance.
Industrial: This segment includes various industrial applications, such as power generation, mining, and manufacturing. Growth projections are tied to industrial production and the use of diesel engines in stationary and mobile applications. The segment is characterized by competition among engine manufacturers and diesel fuel suppliers.
Others: This category encompasses various applications with varying growth potential, ranging from marine transport and rail to agriculture and specialized equipment. Competitive dynamics are influenced by sector-specific needs and technological advancements.
Key Drivers of Diesel Industry Growth
Key growth drivers include increasing industrialization in developing economies, growth in global freight transportation, and the continued dominance of diesel in heavy-duty vehicles. Continued demand for reliable and cost-effective energy sources contributes significantly to diesel consumption. Technological advancements focusing on enhanced efficiency and reduced emissions are also fostering industry expansion.
Challenges in the Diesel Industry Sector
The diesel industry faces significant challenges, including stringent emission regulations leading to increased manufacturing costs, volatile crude oil prices impacting profitability, and the growing adoption of electric and alternative fuel vehicles posing a competitive threat. Supply chain disruptions can cause instability, and competition from other fuel types exerts downward pressure on prices.
Leading Players in the Diesel Industry Market
- BP plc
- Reliance Industries Ltd
- Exxon Mobil Corporation
- Shell Plc
- PetroChina Company Limited
- NK Rosneft' PAO
- Chevron Corporation
- Saudi Arabian Oil Co
- Qatar Petroleum
- SK energy Co Ltd
Key Developments in Diesel Industry Sector
- May 2023: Petrobras' revised fuel pricing policy led to a nearly 13% reduction in gasoline and diesel prices in Brazil, impacting market dynamics significantly.
- February 2023: The European Union's ban on new petrol and diesel car sales starting in 2035 will significantly impact future diesel demand in the region, accelerating the shift towards alternative fuel vehicles.
Strategic Diesel Industry Market Outlook
The future of the diesel industry hinges on adapting to stricter environmental regulations and the rise of alternative fuels. Opportunities lie in developing more efficient and cleaner diesel technologies, expanding into niche applications where diesel remains essential, and exploring partnerships in the production of biodiesel and other sustainable diesel alternatives. Growth will depend on the balance between meeting evolving emission standards and maintaining cost competitiveness.
Diesel Industry Segmentation
-
1. End-User
- 1.1. Transporation
- 1.2. Industrial
- 1.3. Others
Diesel Industry Segmentation By Geography
-
1. North America
- 1.1. United States
- 1.2. Canada
- 1.3. Rest of North America
-
2. Europe
- 2.1. United Kingdom
- 2.2. Russia
- 2.3. Germany
- 2.4. Norway
- 2.5. Rest of Europe
-
3. Asia Pacific
- 3.1. China
- 3.2. India
- 3.3. Indonesia
- 3.4. Malaysia
- 3.5. Vietnam
-
4. Middle East and Africa
- 4.1. Saudi Arabia
- 4.2. United Arab Emirates
- 4.3. South Africa
- 4.4. Nigeria
- 4.5. Egypt
- 4.6. Rest of Middle East and Africa
-
5. South America
- 5.1. Argentina
- 5.2. Brazil
- 5.3. Venezuela
- 5.4. Rest of South America
Diesel Industry REPORT HIGHLIGHTS
| Aspects | Details |
|---|---|
| Study Period | 2019-2033 |
| Base Year | 2024 |
| Estimated Year | 2025 |
| Forecast Period | 2025-2033 |
| Historical Period | 2019-2024 |
| Growth Rate | CAGR of 3.50% from 2019-2033 |
| Segmentation |
|
Table of Contents
- 1. Introduction
- 1.1. Research Scope
- 1.2. Market Segmentation
- 1.3. Research Methodology
- 1.4. Definitions and Assumptions
- 2. Executive Summary
- 2.1. Introduction
- 3. Market Dynamics
- 3.1. Introduction
- 3.2. Market Drivers
- 3.2.1. Increasing Demand from Industrial Applications4.; Growing Infrastructure Across the World
- 3.3. Market Restrains
- 3.3.1. A Rise in Concerns Related to Carbon Emissions and A Shift Towards Electric Vehicles and Renewable Sources of Energy
- 3.4. Market Trends
- 3.4.1. Transportation Segment is to Expected to Dominate in the Market
- 4. Market Factor Analysis
- 4.1. Porters Five Forces
- 4.2. Supply/Value Chain
- 4.3. PESTEL analysis
- 4.4. Market Entropy
- 4.5. Patent/Trademark Analysis
- 5. Global Diesel Industry Analysis, Insights and Forecast, 2019-2031
- 5.1. Market Analysis, Insights and Forecast - by End-User
- 5.1.1. Transporation
- 5.1.2. Industrial
- 5.1.3. Others
- 5.2. Market Analysis, Insights and Forecast - by Region
- 5.2.1. North America
- 5.2.2. Europe
- 5.2.3. Asia Pacific
- 5.2.4. Middle East and Africa
- 5.2.5. South America
- 5.1. Market Analysis, Insights and Forecast - by End-User
- 6. North America Diesel Industry Analysis, Insights and Forecast, 2019-2031
- 6.1. Market Analysis, Insights and Forecast - by End-User
- 6.1.1. Transporation
- 6.1.2. Industrial
- 6.1.3. Others
- 6.1. Market Analysis, Insights and Forecast - by End-User
- 7. Europe Diesel Industry Analysis, Insights and Forecast, 2019-2031
- 7.1. Market Analysis, Insights and Forecast - by End-User
- 7.1.1. Transporation
- 7.1.2. Industrial
- 7.1.3. Others
- 7.1. Market Analysis, Insights and Forecast - by End-User
- 8. Asia Pacific Diesel Industry Analysis, Insights and Forecast, 2019-2031
- 8.1. Market Analysis, Insights and Forecast - by End-User
- 8.1.1. Transporation
- 8.1.2. Industrial
- 8.1.3. Others
- 8.1. Market Analysis, Insights and Forecast - by End-User
- 9. Middle East and Africa Diesel Industry Analysis, Insights and Forecast, 2019-2031
- 9.1. Market Analysis, Insights and Forecast - by End-User
- 9.1.1. Transporation
- 9.1.2. Industrial
- 9.1.3. Others
- 9.1. Market Analysis, Insights and Forecast - by End-User
- 10. South America Diesel Industry Analysis, Insights and Forecast, 2019-2031
- 10.1. Market Analysis, Insights and Forecast - by End-User
- 10.1.1. Transporation
- 10.1.2. Industrial
- 10.1.3. Others
- 10.1. Market Analysis, Insights and Forecast - by End-User
- 11. North America Diesel Industry Analysis, Insights and Forecast, 2019-2031
- 11.1. Market Analysis, Insights and Forecast - By Country/Sub-region
- 11.1.1 United States
- 11.1.2 Canada
- 11.1.3 Mexico
- 12. Europe Diesel Industry Analysis, Insights and Forecast, 2019-2031
- 12.1. Market Analysis, Insights and Forecast - By Country/Sub-region
- 12.1.1 Germany
- 12.1.2 United Kingdom
- 12.1.3 France
- 12.1.4 Spain
- 12.1.5 Italy
- 12.1.6 Spain
- 12.1.7 Belgium
- 12.1.8 Netherland
- 12.1.9 Nordics
- 12.1.10 Rest of Europe
- 13. Asia Pacific Diesel Industry Analysis, Insights and Forecast, 2019-2031
- 13.1. Market Analysis, Insights and Forecast - By Country/Sub-region
- 13.1.1 China
- 13.1.2 Japan
- 13.1.3 India
- 13.1.4 South Korea
- 13.1.5 Southeast Asia
- 13.1.6 Australia
- 13.1.7 Indonesia
- 13.1.8 Phillipes
- 13.1.9 Singapore
- 13.1.10 Thailandc
- 13.1.11 Rest of Asia Pacific
- 14. South America Diesel Industry Analysis, Insights and Forecast, 2019-2031
- 14.1. Market Analysis, Insights and Forecast - By Country/Sub-region
- 14.1.1 Brazil
- 14.1.2 Argentina
- 14.1.3 Peru
- 14.1.4 Chile
- 14.1.5 Colombia
- 14.1.6 Ecuador
- 14.1.7 Venezuela
- 14.1.8 Rest of South America
- 15. North America Diesel Industry Analysis, Insights and Forecast, 2019-2031
- 15.1. Market Analysis, Insights and Forecast - By Country/Sub-region
- 15.1.1 United States
- 15.1.2 Canada
- 15.1.3 Mexico
- 16. MEA Diesel Industry Analysis, Insights and Forecast, 2019-2031
- 16.1. Market Analysis, Insights and Forecast - By Country/Sub-region
- 16.1.1 United Arab Emirates
- 16.1.2 Saudi Arabia
- 16.1.3 South Africa
- 16.1.4 Rest of Middle East and Africa
- 17. Competitive Analysis
- 17.1. Global Market Share Analysis 2024
- 17.2. Company Profiles
- 17.2.1 BP plc*List Not Exhaustive
- 17.2.1.1. Overview
- 17.2.1.2. Products
- 17.2.1.3. SWOT Analysis
- 17.2.1.4. Recent Developments
- 17.2.1.5. Financials (Based on Availability)
- 17.2.2 Reliance Industries Ltd
- 17.2.2.1. Overview
- 17.2.2.2. Products
- 17.2.2.3. SWOT Analysis
- 17.2.2.4. Recent Developments
- 17.2.2.5. Financials (Based on Availability)
- 17.2.3 Exxon Mobil Corporation
- 17.2.3.1. Overview
- 17.2.3.2. Products
- 17.2.3.3. SWOT Analysis
- 17.2.3.4. Recent Developments
- 17.2.3.5. Financials (Based on Availability)
- 17.2.4 Shell Plc
- 17.2.4.1. Overview
- 17.2.4.2. Products
- 17.2.4.3. SWOT Analysis
- 17.2.4.4. Recent Developments
- 17.2.4.5. Financials (Based on Availability)
- 17.2.5 PetroChina Company Limited
- 17.2.5.1. Overview
- 17.2.5.2. Products
- 17.2.5.3. SWOT Analysis
- 17.2.5.4. Recent Developments
- 17.2.5.5. Financials (Based on Availability)
- 17.2.6 NK Rosneft' PAO
- 17.2.6.1. Overview
- 17.2.6.2. Products
- 17.2.6.3. SWOT Analysis
- 17.2.6.4. Recent Developments
- 17.2.6.5. Financials (Based on Availability)
- 17.2.7 Chevron Corporation
- 17.2.7.1. Overview
- 17.2.7.2. Products
- 17.2.7.3. SWOT Analysis
- 17.2.7.4. Recent Developments
- 17.2.7.5. Financials (Based on Availability)
- 17.2.8 Saudi Arabian Oil Co
- 17.2.8.1. Overview
- 17.2.8.2. Products
- 17.2.8.3. SWOT Analysis
- 17.2.8.4. Recent Developments
- 17.2.8.5. Financials (Based on Availability)
- 17.2.9 Qatar Petroleum
- 17.2.9.1. Overview
- 17.2.9.2. Products
- 17.2.9.3. SWOT Analysis
- 17.2.9.4. Recent Developments
- 17.2.9.5. Financials (Based on Availability)
- 17.2.10 SK energy Co Ltd
- 17.2.10.1. Overview
- 17.2.10.2. Products
- 17.2.10.3. SWOT Analysis
- 17.2.10.4. Recent Developments
- 17.2.10.5. Financials (Based on Availability)
- 17.2.1 BP plc*List Not Exhaustive
List of Figures
- Figure 1: Global Diesel Industry Revenue Breakdown (Million, %) by Region 2024 & 2032
- Figure 2: Global Diesel Industry Volume Breakdown (Litre, %) by Region 2024 & 2032
- Figure 3: North America Diesel Industry Revenue (Million), by Country 2024 & 2032
- Figure 4: North America Diesel Industry Volume (Litre), by Country 2024 & 2032
- Figure 5: North America Diesel Industry Revenue Share (%), by Country 2024 & 2032
- Figure 6: North America Diesel Industry Volume Share (%), by Country 2024 & 2032
- Figure 7: Europe Diesel Industry Revenue (Million), by Country 2024 & 2032
- Figure 8: Europe Diesel Industry Volume (Litre), by Country 2024 & 2032
- Figure 9: Europe Diesel Industry Revenue Share (%), by Country 2024 & 2032
- Figure 10: Europe Diesel Industry Volume Share (%), by Country 2024 & 2032
- Figure 11: Asia Pacific Diesel Industry Revenue (Million), by Country 2024 & 2032
- Figure 12: Asia Pacific Diesel Industry Volume (Litre), by Country 2024 & 2032
- Figure 13: Asia Pacific Diesel Industry Revenue Share (%), by Country 2024 & 2032
- Figure 14: Asia Pacific Diesel Industry Volume Share (%), by Country 2024 & 2032
- Figure 15: South America Diesel Industry Revenue (Million), by Country 2024 & 2032
- Figure 16: South America Diesel Industry Volume (Litre), by Country 2024 & 2032
- Figure 17: South America Diesel Industry Revenue Share (%), by Country 2024 & 2032
- Figure 18: South America Diesel Industry Volume Share (%), by Country 2024 & 2032
- Figure 19: North America Diesel Industry Revenue (Million), by Country 2024 & 2032
- Figure 20: North America Diesel Industry Volume (Litre), by Country 2024 & 2032
- Figure 21: North America Diesel Industry Revenue Share (%), by Country 2024 & 2032
- Figure 22: North America Diesel Industry Volume Share (%), by Country 2024 & 2032
- Figure 23: MEA Diesel Industry Revenue (Million), by Country 2024 & 2032
- Figure 24: MEA Diesel Industry Volume (Litre), by Country 2024 & 2032
- Figure 25: MEA Diesel Industry Revenue Share (%), by Country 2024 & 2032
- Figure 26: MEA Diesel Industry Volume Share (%), by Country 2024 & 2032
- Figure 27: North America Diesel Industry Revenue (Million), by End-User 2024 & 2032
- Figure 28: North America Diesel Industry Volume (Litre), by End-User 2024 & 2032
- Figure 29: North America Diesel Industry Revenue Share (%), by End-User 2024 & 2032
- Figure 30: North America Diesel Industry Volume Share (%), by End-User 2024 & 2032
- Figure 31: North America Diesel Industry Revenue (Million), by Country 2024 & 2032
- Figure 32: North America Diesel Industry Volume (Litre), by Country 2024 & 2032
- Figure 33: North America Diesel Industry Revenue Share (%), by Country 2024 & 2032
- Figure 34: North America Diesel Industry Volume Share (%), by Country 2024 & 2032
- Figure 35: Europe Diesel Industry Revenue (Million), by End-User 2024 & 2032
- Figure 36: Europe Diesel Industry Volume (Litre), by End-User 2024 & 2032
- Figure 37: Europe Diesel Industry Revenue Share (%), by End-User 2024 & 2032
- Figure 38: Europe Diesel Industry Volume Share (%), by End-User 2024 & 2032
- Figure 39: Europe Diesel Industry Revenue (Million), by Country 2024 & 2032
- Figure 40: Europe Diesel Industry Volume (Litre), by Country 2024 & 2032
- Figure 41: Europe Diesel Industry Revenue Share (%), by Country 2024 & 2032
- Figure 42: Europe Diesel Industry Volume Share (%), by Country 2024 & 2032
- Figure 43: Asia Pacific Diesel Industry Revenue (Million), by End-User 2024 & 2032
- Figure 44: Asia Pacific Diesel Industry Volume (Litre), by End-User 2024 & 2032
- Figure 45: Asia Pacific Diesel Industry Revenue Share (%), by End-User 2024 & 2032
- Figure 46: Asia Pacific Diesel Industry Volume Share (%), by End-User 2024 & 2032
- Figure 47: Asia Pacific Diesel Industry Revenue (Million), by Country 2024 & 2032
- Figure 48: Asia Pacific Diesel Industry Volume (Litre), by Country 2024 & 2032
- Figure 49: Asia Pacific Diesel Industry Revenue Share (%), by Country 2024 & 2032
- Figure 50: Asia Pacific Diesel Industry Volume Share (%), by Country 2024 & 2032
- Figure 51: Middle East and Africa Diesel Industry Revenue (Million), by End-User 2024 & 2032
- Figure 52: Middle East and Africa Diesel Industry Volume (Litre), by End-User 2024 & 2032
- Figure 53: Middle East and Africa Diesel Industry Revenue Share (%), by End-User 2024 & 2032
- Figure 54: Middle East and Africa Diesel Industry Volume Share (%), by End-User 2024 & 2032
- Figure 55: Middle East and Africa Diesel Industry Revenue (Million), by Country 2024 & 2032
- Figure 56: Middle East and Africa Diesel Industry Volume (Litre), by Country 2024 & 2032
- Figure 57: Middle East and Africa Diesel Industry Revenue Share (%), by Country 2024 & 2032
- Figure 58: Middle East and Africa Diesel Industry Volume Share (%), by Country 2024 & 2032
- Figure 59: South America Diesel Industry Revenue (Million), by End-User 2024 & 2032
- Figure 60: South America Diesel Industry Volume (Litre), by End-User 2024 & 2032
- Figure 61: South America Diesel Industry Revenue Share (%), by End-User 2024 & 2032
- Figure 62: South America Diesel Industry Volume Share (%), by End-User 2024 & 2032
- Figure 63: South America Diesel Industry Revenue (Million), by Country 2024 & 2032
- Figure 64: South America Diesel Industry Volume (Litre), by Country 2024 & 2032
- Figure 65: South America Diesel Industry Revenue Share (%), by Country 2024 & 2032
- Figure 66: South America Diesel Industry Volume Share (%), by Country 2024 & 2032
List of Tables
- Table 1: Global Diesel Industry Revenue Million Forecast, by Region 2019 & 2032
- Table 2: Global Diesel Industry Volume Litre Forecast, by Region 2019 & 2032
- Table 3: Global Diesel Industry Revenue Million Forecast, by End-User 2019 & 2032
- Table 4: Global Diesel Industry Volume Litre Forecast, by End-User 2019 & 2032
- Table 5: Global Diesel Industry Revenue Million Forecast, by Region 2019 & 2032
- Table 6: Global Diesel Industry Volume Litre Forecast, by Region 2019 & 2032
- Table 7: Global Diesel Industry Revenue Million Forecast, by Country 2019 & 2032
- Table 8: Global Diesel Industry Volume Litre Forecast, by Country 2019 & 2032
- Table 9: United States Diesel Industry Revenue (Million) Forecast, by Application 2019 & 2032
- Table 10: United States Diesel Industry Volume (Litre) Forecast, by Application 2019 & 2032
- Table 11: Canada Diesel Industry Revenue (Million) Forecast, by Application 2019 & 2032
- Table 12: Canada Diesel Industry Volume (Litre) Forecast, by Application 2019 & 2032
- Table 13: Mexico Diesel Industry Revenue (Million) Forecast, by Application 2019 & 2032
- Table 14: Mexico Diesel Industry Volume (Litre) Forecast, by Application 2019 & 2032
- Table 15: Global Diesel Industry Revenue Million Forecast, by Country 2019 & 2032
- Table 16: Global Diesel Industry Volume Litre Forecast, by Country 2019 & 2032
- Table 17: Germany Diesel Industry Revenue (Million) Forecast, by Application 2019 & 2032
- Table 18: Germany Diesel Industry Volume (Litre) Forecast, by Application 2019 & 2032
- Table 19: United Kingdom Diesel Industry Revenue (Million) Forecast, by Application 2019 & 2032
- Table 20: United Kingdom Diesel Industry Volume (Litre) Forecast, by Application 2019 & 2032
- Table 21: France Diesel Industry Revenue (Million) Forecast, by Application 2019 & 2032
- Table 22: France Diesel Industry Volume (Litre) Forecast, by Application 2019 & 2032
- Table 23: Spain Diesel Industry Revenue (Million) Forecast, by Application 2019 & 2032
- Table 24: Spain Diesel Industry Volume (Litre) Forecast, by Application 2019 & 2032
- Table 25: Italy Diesel Industry Revenue (Million) Forecast, by Application 2019 & 2032
- Table 26: Italy Diesel Industry Volume (Litre) Forecast, by Application 2019 & 2032
- Table 27: Spain Diesel Industry Revenue (Million) Forecast, by Application 2019 & 2032
- Table 28: Spain Diesel Industry Volume (Litre) Forecast, by Application 2019 & 2032
- Table 29: Belgium Diesel Industry Revenue (Million) Forecast, by Application 2019 & 2032
- Table 30: Belgium Diesel Industry Volume (Litre) Forecast, by Application 2019 & 2032
- Table 31: Netherland Diesel Industry Revenue (Million) Forecast, by Application 2019 & 2032
- Table 32: Netherland Diesel Industry Volume (Litre) Forecast, by Application 2019 & 2032
- Table 33: Nordics Diesel Industry Revenue (Million) Forecast, by Application 2019 & 2032
- Table 34: Nordics Diesel Industry Volume (Litre) Forecast, by Application 2019 & 2032
- Table 35: Rest of Europe Diesel Industry Revenue (Million) Forecast, by Application 2019 & 2032
- Table 36: Rest of Europe Diesel Industry Volume (Litre) Forecast, by Application 2019 & 2032
- Table 37: Global Diesel Industry Revenue Million Forecast, by Country 2019 & 2032
- Table 38: Global Diesel Industry Volume Litre Forecast, by Country 2019 & 2032
- Table 39: China Diesel Industry Revenue (Million) Forecast, by Application 2019 & 2032
- Table 40: China Diesel Industry Volume (Litre) Forecast, by Application 2019 & 2032
- Table 41: Japan Diesel Industry Revenue (Million) Forecast, by Application 2019 & 2032
- Table 42: Japan Diesel Industry Volume (Litre) Forecast, by Application 2019 & 2032
- Table 43: India Diesel Industry Revenue (Million) Forecast, by Application 2019 & 2032
- Table 44: India Diesel Industry Volume (Litre) Forecast, by Application 2019 & 2032
- Table 45: South Korea Diesel Industry Revenue (Million) Forecast, by Application 2019 & 2032
- Table 46: South Korea Diesel Industry Volume (Litre) Forecast, by Application 2019 & 2032
- Table 47: Southeast Asia Diesel Industry Revenue (Million) Forecast, by Application 2019 & 2032
- Table 48: Southeast Asia Diesel Industry Volume (Litre) Forecast, by Application 2019 & 2032
- Table 49: Australia Diesel Industry Revenue (Million) Forecast, by Application 2019 & 2032
- Table 50: Australia Diesel Industry Volume (Litre) Forecast, by Application 2019 & 2032
- Table 51: Indonesia Diesel Industry Revenue (Million) Forecast, by Application 2019 & 2032
- Table 52: Indonesia Diesel Industry Volume (Litre) Forecast, by Application 2019 & 2032
- Table 53: Phillipes Diesel Industry Revenue (Million) Forecast, by Application 2019 & 2032
- Table 54: Phillipes Diesel Industry Volume (Litre) Forecast, by Application 2019 & 2032
- Table 55: Singapore Diesel Industry Revenue (Million) Forecast, by Application 2019 & 2032
- Table 56: Singapore Diesel Industry Volume (Litre) Forecast, by Application 2019 & 2032
- Table 57: Thailandc Diesel Industry Revenue (Million) Forecast, by Application 2019 & 2032
- Table 58: Thailandc Diesel Industry Volume (Litre) Forecast, by Application 2019 & 2032
- Table 59: Rest of Asia Pacific Diesel Industry Revenue (Million) Forecast, by Application 2019 & 2032
- Table 60: Rest of Asia Pacific Diesel Industry Volume (Litre) Forecast, by Application 2019 & 2032
- Table 61: Global Diesel Industry Revenue Million Forecast, by Country 2019 & 2032
- Table 62: Global Diesel Industry Volume Litre Forecast, by Country 2019 & 2032
- Table 63: Brazil Diesel Industry Revenue (Million) Forecast, by Application 2019 & 2032
- Table 64: Brazil Diesel Industry Volume (Litre) Forecast, by Application 2019 & 2032
- Table 65: Argentina Diesel Industry Revenue (Million) Forecast, by Application 2019 & 2032
- Table 66: Argentina Diesel Industry Volume (Litre) Forecast, by Application 2019 & 2032
- Table 67: Peru Diesel Industry Revenue (Million) Forecast, by Application 2019 & 2032
- Table 68: Peru Diesel Industry Volume (Litre) Forecast, by Application 2019 & 2032
- Table 69: Chile Diesel Industry Revenue (Million) Forecast, by Application 2019 & 2032
- Table 70: Chile Diesel Industry Volume (Litre) Forecast, by Application 2019 & 2032
- Table 71: Colombia Diesel Industry Revenue (Million) Forecast, by Application 2019 & 2032
- Table 72: Colombia Diesel Industry Volume (Litre) Forecast, by Application 2019 & 2032
- Table 73: Ecuador Diesel Industry Revenue (Million) Forecast, by Application 2019 & 2032
- Table 74: Ecuador Diesel Industry Volume (Litre) Forecast, by Application 2019 & 2032
- Table 75: Venezuela Diesel Industry Revenue (Million) Forecast, by Application 2019 & 2032
- Table 76: Venezuela Diesel Industry Volume (Litre) Forecast, by Application 2019 & 2032
- Table 77: Rest of South America Diesel Industry Revenue (Million) Forecast, by Application 2019 & 2032
- Table 78: Rest of South America Diesel Industry Volume (Litre) Forecast, by Application 2019 & 2032
- Table 79: Global Diesel Industry Revenue Million Forecast, by Country 2019 & 2032
- Table 80: Global Diesel Industry Volume Litre Forecast, by Country 2019 & 2032
- Table 81: United States Diesel Industry Revenue (Million) Forecast, by Application 2019 & 2032
- Table 82: United States Diesel Industry Volume (Litre) Forecast, by Application 2019 & 2032
- Table 83: Canada Diesel Industry Revenue (Million) Forecast, by Application 2019 & 2032
- Table 84: Canada Diesel Industry Volume (Litre) Forecast, by Application 2019 & 2032
- Table 85: Mexico Diesel Industry Revenue (Million) Forecast, by Application 2019 & 2032
- Table 86: Mexico Diesel Industry Volume (Litre) Forecast, by Application 2019 & 2032
- Table 87: Global Diesel Industry Revenue Million Forecast, by Country 2019 & 2032
- Table 88: Global Diesel Industry Volume Litre Forecast, by Country 2019 & 2032
- Table 89: United Arab Emirates Diesel Industry Revenue (Million) Forecast, by Application 2019 & 2032
- Table 90: United Arab Emirates Diesel Industry Volume (Litre) Forecast, by Application 2019 & 2032
- Table 91: Saudi Arabia Diesel Industry Revenue (Million) Forecast, by Application 2019 & 2032
- Table 92: Saudi Arabia Diesel Industry Volume (Litre) Forecast, by Application 2019 & 2032
- Table 93: South Africa Diesel Industry Revenue (Million) Forecast, by Application 2019 & 2032
- Table 94: South Africa Diesel Industry Volume (Litre) Forecast, by Application 2019 & 2032
- Table 95: Rest of Middle East and Africa Diesel Industry Revenue (Million) Forecast, by Application 2019 & 2032
- Table 96: Rest of Middle East and Africa Diesel Industry Volume (Litre) Forecast, by Application 2019 & 2032
- Table 97: Global Diesel Industry Revenue Million Forecast, by End-User 2019 & 2032
- Table 98: Global Diesel Industry Volume Litre Forecast, by End-User 2019 & 2032
- Table 99: Global Diesel Industry Revenue Million Forecast, by Country 2019 & 2032
- Table 100: Global Diesel Industry Volume Litre Forecast, by Country 2019 & 2032
- Table 101: United States Diesel Industry Revenue (Million) Forecast, by Application 2019 & 2032
- Table 102: United States Diesel Industry Volume (Litre) Forecast, by Application 2019 & 2032
- Table 103: Canada Diesel Industry Revenue (Million) Forecast, by Application 2019 & 2032
- Table 104: Canada Diesel Industry Volume (Litre) Forecast, by Application 2019 & 2032
- Table 105: Rest of North America Diesel Industry Revenue (Million) Forecast, by Application 2019 & 2032
- Table 106: Rest of North America Diesel Industry Volume (Litre) Forecast, by Application 2019 & 2032
- Table 107: Global Diesel Industry Revenue Million Forecast, by End-User 2019 & 2032
- Table 108: Global Diesel Industry Volume Litre Forecast, by End-User 2019 & 2032
- Table 109: Global Diesel Industry Revenue Million Forecast, by Country 2019 & 2032
- Table 110: Global Diesel Industry Volume Litre Forecast, by Country 2019 & 2032
- Table 111: United Kingdom Diesel Industry Revenue (Million) Forecast, by Application 2019 & 2032
- Table 112: United Kingdom Diesel Industry Volume (Litre) Forecast, by Application 2019 & 2032
- Table 113: Russia Diesel Industry Revenue (Million) Forecast, by Application 2019 & 2032
- Table 114: Russia Diesel Industry Volume (Litre) Forecast, by Application 2019 & 2032
- Table 115: Germany Diesel Industry Revenue (Million) Forecast, by Application 2019 & 2032
- Table 116: Germany Diesel Industry Volume (Litre) Forecast, by Application 2019 & 2032
- Table 117: Norway Diesel Industry Revenue (Million) Forecast, by Application 2019 & 2032
- Table 118: Norway Diesel Industry Volume (Litre) Forecast, by Application 2019 & 2032
- Table 119: Rest of Europe Diesel Industry Revenue (Million) Forecast, by Application 2019 & 2032
- Table 120: Rest of Europe Diesel Industry Volume (Litre) Forecast, by Application 2019 & 2032
- Table 121: Global Diesel Industry Revenue Million Forecast, by End-User 2019 & 2032
- Table 122: Global Diesel Industry Volume Litre Forecast, by End-User 2019 & 2032
- Table 123: Global Diesel Industry Revenue Million Forecast, by Country 2019 & 2032
- Table 124: Global Diesel Industry Volume Litre Forecast, by Country 2019 & 2032
- Table 125: China Diesel Industry Revenue (Million) Forecast, by Application 2019 & 2032
- Table 126: China Diesel Industry Volume (Litre) Forecast, by Application 2019 & 2032
- Table 127: India Diesel Industry Revenue (Million) Forecast, by Application 2019 & 2032
- Table 128: India Diesel Industry Volume (Litre) Forecast, by Application 2019 & 2032
- Table 129: Indonesia Diesel Industry Revenue (Million) Forecast, by Application 2019 & 2032
- Table 130: Indonesia Diesel Industry Volume (Litre) Forecast, by Application 2019 & 2032
- Table 131: Malaysia Diesel Industry Revenue (Million) Forecast, by Application 2019 & 2032
- Table 132: Malaysia Diesel Industry Volume (Litre) Forecast, by Application 2019 & 2032
- Table 133: Vietnam Diesel Industry Revenue (Million) Forecast, by Application 2019 & 2032
- Table 134: Vietnam Diesel Industry Volume (Litre) Forecast, by Application 2019 & 2032
- Table 135: Global Diesel Industry Revenue Million Forecast, by End-User 2019 & 2032
- Table 136: Global Diesel Industry Volume Litre Forecast, by End-User 2019 & 2032
- Table 137: Global Diesel Industry Revenue Million Forecast, by Country 2019 & 2032
- Table 138: Global Diesel Industry Volume Litre Forecast, by Country 2019 & 2032
- Table 139: Saudi Arabia Diesel Industry Revenue (Million) Forecast, by Application 2019 & 2032
- Table 140: Saudi Arabia Diesel Industry Volume (Litre) Forecast, by Application 2019 & 2032
- Table 141: United Arab Emirates Diesel Industry Revenue (Million) Forecast, by Application 2019 & 2032
- Table 142: United Arab Emirates Diesel Industry Volume (Litre) Forecast, by Application 2019 & 2032
- Table 143: South Africa Diesel Industry Revenue (Million) Forecast, by Application 2019 & 2032
- Table 144: South Africa Diesel Industry Volume (Litre) Forecast, by Application 2019 & 2032
- Table 145: Nigeria Diesel Industry Revenue (Million) Forecast, by Application 2019 & 2032
- Table 146: Nigeria Diesel Industry Volume (Litre) Forecast, by Application 2019 & 2032
- Table 147: Egypt Diesel Industry Revenue (Million) Forecast, by Application 2019 & 2032
- Table 148: Egypt Diesel Industry Volume (Litre) Forecast, by Application 2019 & 2032
- Table 149: Rest of Middle East and Africa Diesel Industry Revenue (Million) Forecast, by Application 2019 & 2032
- Table 150: Rest of Middle East and Africa Diesel Industry Volume (Litre) Forecast, by Application 2019 & 2032
- Table 151: Global Diesel Industry Revenue Million Forecast, by End-User 2019 & 2032
- Table 152: Global Diesel Industry Volume Litre Forecast, by End-User 2019 & 2032
- Table 153: Global Diesel Industry Revenue Million Forecast, by Country 2019 & 2032
- Table 154: Global Diesel Industry Volume Litre Forecast, by Country 2019 & 2032
- Table 155: Argentina Diesel Industry Revenue (Million) Forecast, by Application 2019 & 2032
- Table 156: Argentina Diesel Industry Volume (Litre) Forecast, by Application 2019 & 2032
- Table 157: Brazil Diesel Industry Revenue (Million) Forecast, by Application 2019 & 2032
- Table 158: Brazil Diesel Industry Volume (Litre) Forecast, by Application 2019 & 2032
- Table 159: Venezuela Diesel Industry Revenue (Million) Forecast, by Application 2019 & 2032
- Table 160: Venezuela Diesel Industry Volume (Litre) Forecast, by Application 2019 & 2032
- Table 161: Rest of South America Diesel Industry Revenue (Million) Forecast, by Application 2019 & 2032
- Table 162: Rest of South America Diesel Industry Volume (Litre) Forecast, by Application 2019 & 2032
Frequently Asked Questions
1. What is the projected Compound Annual Growth Rate (CAGR) of the Diesel Industry?
The projected CAGR is approximately 3.50%.
2. Which companies are prominent players in the Diesel Industry?
Key companies in the market include BP plc*List Not Exhaustive, Reliance Industries Ltd, Exxon Mobil Corporation, Shell Plc, PetroChina Company Limited, NK Rosneft' PAO, Chevron Corporation, Saudi Arabian Oil Co, Qatar Petroleum, SK energy Co Ltd.
3. What are the main segments of the Diesel Industry?
The market segments include End-User.
4. Can you provide details about the market size?
The market size is estimated to be USD 244.26 Million as of 2022.
5. What are some drivers contributing to market growth?
Increasing Demand from Industrial Applications4.; Growing Infrastructure Across the World.
6. What are the notable trends driving market growth?
Transportation Segment is to Expected to Dominate in the Market.
7. Are there any restraints impacting market growth?
A Rise in Concerns Related to Carbon Emissions and A Shift Towards Electric Vehicles and Renewable Sources of Energy.
8. Can you provide examples of recent developments in the market?
May 2023: Petrobras, the state oil company of Brazil, gave the green light to a revised fuel pricing policy that will result in significant cost reductions for drivers. As per the newly approved strategy, gasoline, and diesel prices will experience a considerable decline, with a nearly 13% reduction.
9. What pricing options are available for accessing the report?
Pricing options include single-user, multi-user, and enterprise licenses priced at USD 4750, USD 5250, and USD 8750 respectively.
10. Is the market size provided in terms of value or volume?
The market size is provided in terms of value, measured in Million and volume, measured in Litre.
11. Are there any specific market keywords associated with the report?
Yes, the market keyword associated with the report is "Diesel Industry," which aids in identifying and referencing the specific market segment covered.
12. How do I determine which pricing option suits my needs best?
The pricing options vary based on user requirements and access needs. Individual users may opt for single-user licenses, while businesses requiring broader access may choose multi-user or enterprise licenses for cost-effective access to the report.
13. Are there any additional resources or data provided in the Diesel Industry report?
While the report offers comprehensive insights, it's advisable to review the specific contents or supplementary materials provided to ascertain if additional resources or data are available.
14. How can I stay updated on further developments or reports in the Diesel Industry?
To stay informed about further developments, trends, and reports in the Diesel Industry, consider subscribing to industry newsletters, following relevant companies and organizations, or regularly checking reputable industry news sources and publications.
Methodology
Step 1 - Identification of Relevant Samples Size from Population Database


Step 2 - Approaches for Defining Global Market Size (Value, Volume* & Price*)

Note*: In applicable scenarios
Step 3 - Data Sources
Primary Research
- Web Analytics
- Survey Reports
- Research Institute
- Latest Research Reports
- Opinion Leaders
Secondary Research
- Annual Reports
- White Paper
- Latest Press Release
- Industry Association
- Paid Database
- Investor Presentations

Step 4 - Data Triangulation
Involves using different sources of information in order to increase the validity of a study
These sources are likely to be stakeholders in a program - participants, other researchers, program staff, other community members, and so on.
Then we put all data in single framework & apply various statistical tools to find out the dynamic on the market.
During the analysis stage, feedback from the stakeholder groups would be compared to determine areas of agreement as well as areas of divergence


