
Key Insights
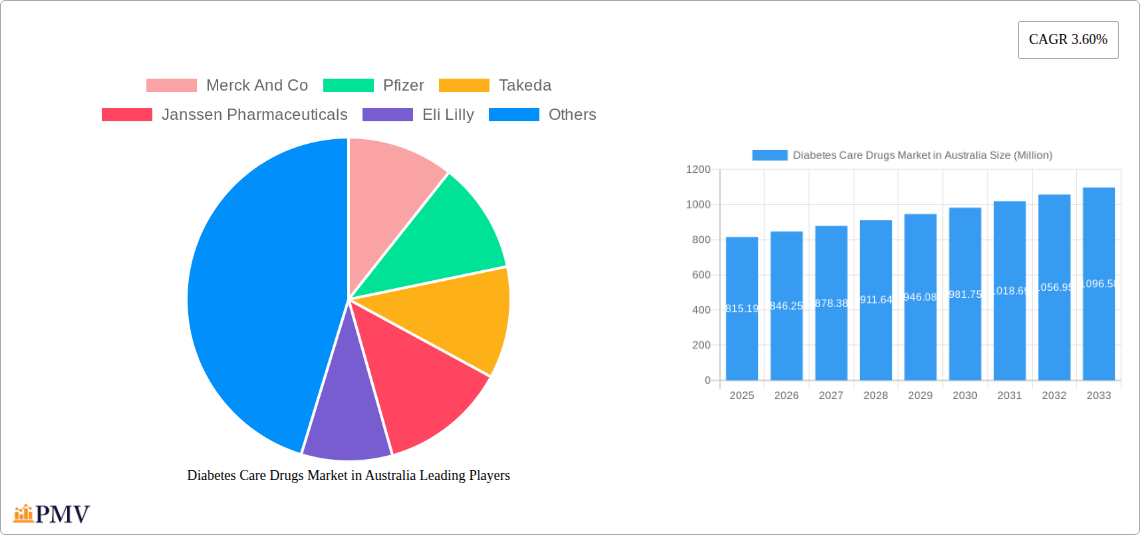
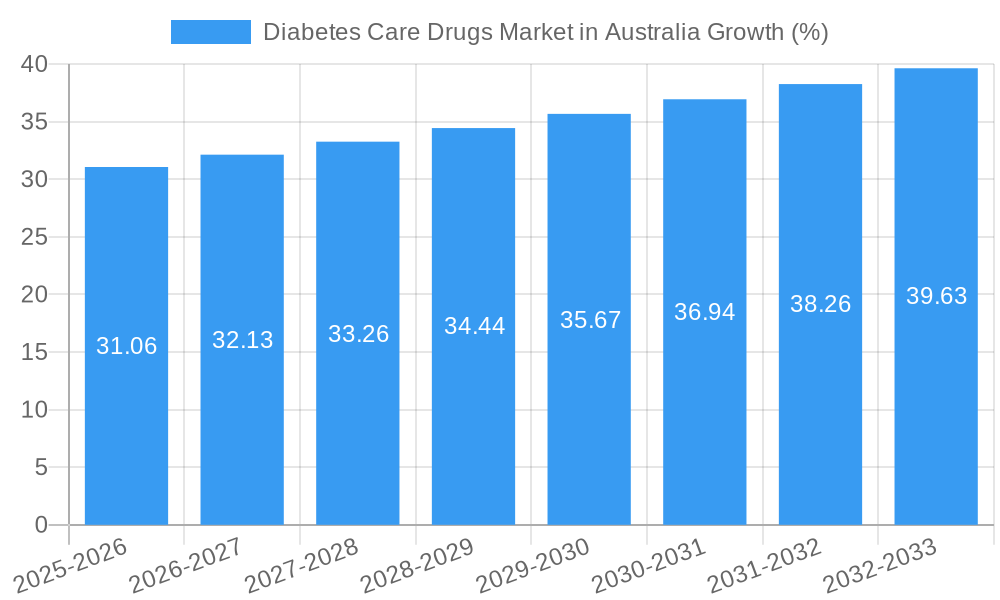
The Australian diabetes care drugs market, valued at $815.19 million in 2025, is projected to experience steady growth, driven by a rising prevalence of diabetes and an aging population. A compound annual growth rate (CAGR) of 3.60% from 2025 to 2033 indicates a significant market expansion over the forecast period. Key market drivers include increased awareness of diabetes management, improved diagnostic capabilities, and the launch of innovative treatment options like GLP-1 receptor agonists and SGLT-2 inhibitors. The market is segmented into various drug classes, including oral anti-diabetic drugs (biguanides, sulfonylureas, meglitinides, etc.), insulins (basal, bolus, biosimilars), and non-insulin injectables. The segment of newer, more effective medications, such as GLP-1 receptor agonists and SGLT-2 inhibitors, is anticipated to exhibit faster growth due to their superior efficacy and reduced side effects compared to older therapies. However, market restraints include the high cost of advanced therapies, potential side effects associated with certain drugs, and the need for continuous patient adherence to treatment regimens. Major players like Novo Nordisk, Sanofi, Eli Lilly, and AstraZeneca are competing fiercely, driving innovation and influencing market dynamics. The increasing focus on preventative care and personalized medicine will further shape the future of the Australian diabetes care drugs market.
This consistent growth is predicted to continue due to ongoing research and development into newer, more effective treatments for diabetes. The market’s evolution will be influenced by factors like government initiatives to improve diabetes management, increasing accessibility to advanced therapies, and the ongoing focus on improving patient outcomes through better disease management and patient education programs. Furthermore, the adoption of biosimilar insulins and the potential entry of new generic medications could impact pricing strategies and market share dynamics within the various segments. The competitive landscape among major pharmaceutical companies will remain intense, with a strong emphasis on research and development to maintain a leading edge in the market. The market's future will likely see a shift towards personalized treatment approaches and an enhanced emphasis on prevention and early detection of diabetes.
Diabetes Care Drugs Market in Australia: A Comprehensive Report (2019-2033)
This comprehensive report provides an in-depth analysis of the Diabetes Care Drugs Market in Australia, covering the period 2019-2033. It offers invaluable insights into market structure, competitive dynamics, industry trends, dominant segments, product innovations, and future outlook, empowering stakeholders to make informed strategic decisions. The report incorporates detailed segmentation, encompassing various drug classes and delivery methods, and examines the impact of key regulatory changes and industry developments. With a base year of 2025 and an estimated year of 2025, the forecast period extends to 2033, providing a long-term perspective on market growth and potential. The report's value is further enhanced by the inclusion of market size data in Millions (AUD).
Diabetes Care Drugs Market in Australia Market Structure & Competitive Dynamics
The Australian diabetes care drugs market exhibits a moderately concentrated structure, dominated by multinational pharmaceutical giants. Key players such as Merck And Co, Pfizer, Takeda, Janssen Pharmaceuticals, Eli Lilly, Novartis, AstraZeneca, Bristol Myers Squibb, Novo Nordisk, Boehringer Ingelheim, Sanofi, and Astellas hold significant market share, driving competition through continuous innovation and product launches.
- Market Concentration: The top five players account for approximately xx% of the market share in 2025.
- Innovation Ecosystems: Significant investment in R&D is driving the development of novel therapies, including GLP-1 receptor agonists and SGLT-2 inhibitors.
- Regulatory Frameworks: The Therapeutic Goods Administration (TGA) plays a crucial role in regulating the market, influencing product approvals and market access. The Pharmaceutical Benefits Scheme (PBS) significantly impacts drug affordability and accessibility.
- Product Substitutes: The market faces competition from generic and biosimilar insulin products, influencing pricing and market share dynamics.
- End-User Trends: Growing awareness of diabetes and increasing prevalence are key drivers of market growth. The aging population contributes to higher demand for diabetes care drugs.
- M&A Activities: The past five years have witnessed xx M&A deals in the Australian diabetes care drugs market, with a total estimated value of xx Million. These transactions have primarily focused on expanding product portfolios and strengthening market presence.
Diabetes Care Drugs Market in Australia Industry Trends & Insights
The Australian diabetes care drugs market is characterized by robust growth, driven by several factors. The rising prevalence of type 1 and type 2 diabetes, coupled with an aging population, significantly fuels demand. Technological advancements, including the development of novel therapies with improved efficacy and safety profiles, are transforming the market landscape. Consumer preferences are shifting towards convenient and user-friendly delivery systems like pre-filled pens and insulin pumps. Competitive dynamics are shaping market pricing and access, while government initiatives, such as the PBS listings, play a vital role in market accessibility. The market is expected to experience a CAGR of xx% during the forecast period (2025-2033), with market penetration projected to reach xx% by 2033. This growth is influenced by factors like increasing healthcare expenditure, government initiatives to improve diabetes management, and the rising adoption of advanced therapies.
Dominant Markets & Segments in Diabetes Care Drugs Market in Australia
The Australian market for diabetes care drugs is largely dominated by the segment of Insulins, particularly Basal or Long Acting Insulins and Bolus or Fast Acting Insulins. Within Oral Anti-diabetic drugs, Metformin remains a dominant force due to its cost-effectiveness and wide usage. The SGLT-2 inhibitors segment is experiencing significant growth driven by the superior efficacy and cardiovascular benefits of newer agents. Regional variations are minimal, with the market largely concentrated in urban areas with higher population density and better access to healthcare facilities.
- Key Drivers:
- Rising prevalence of diabetes
- Increased healthcare expenditure
- Government initiatives to improve diabetes management
- Growing awareness and improved diagnosis rates.
Diabetes Care Drugs Market in Australia Product Innovations
Recent years have witnessed significant advancements in diabetes care drugs. Novel therapies such as GLP-1 receptor agonists and SGLT-2 inhibitors are revolutionizing treatment approaches with improved glycemic control and cardiovascular benefits. Biosimilar insulins are gaining traction, offering cost-effective alternatives to originator brands. Technological innovations in drug delivery systems, including pre-filled pens and insulin pumps, are improving patient adherence and convenience. This innovation pipeline is poised to further enhance market dynamics and patient outcomes.
Report Segmentation & Scope
This report segments the Australian diabetes care drugs market based on drug class and delivery method:
- Oral Anti-diabetic drugs: Biguanides (e.g., Metformin), Sulfonylureas, Meglitinides, DPP-4 inhibitors (e.g., Suglat (Ipragliflozin)), Galvus (Vildagliptin), Alpha-Glucosidase Inhibitors, Oral Combinations (e.g., Xultophy (Insulin Degludec and Liraglutide)). Growth is expected to be driven by the introduction of newer, more effective medications with improved side effect profiles. Market size in 2025: xx Million.
- Insulins: Basal or Long Acting Insulins (e.g., Basaglar (Insulin Glargine)), Bolus or Fast Acting Insulins (e.g., Apidra (Insulin Glulisine)), Traditional Human Insulins, Biosimilar Insulins (e.g., Insuman). Biosimilars are expected to increase market competition and drive down prices. Market size in 2025: xx Million.
- Non-Insulin Injectable drugs: GLP-1 receptor agonists (e.g., Lyxumia (Lixisenatide)), Amylin Analogue. This segment is experiencing rapid growth due to the increasing adoption of these newer, more effective agents. Market size in 2025: xx Million.
- Combination drugs: Insulin combinations. This segment offers advantages in terms of simplified treatment regimens. Market size in 2025: xx Million.
Key Drivers of Diabetes Care Drugs Market in Australia Growth
The Australian diabetes care drugs market is propelled by several key growth drivers. The escalating prevalence of diabetes, particularly type 2, fueled by lifestyle changes and an aging population, is a primary driver. Government initiatives, such as PBS listings and public awareness campaigns, significantly improve market access and patient uptake. Technological advancements in drug development and delivery systems lead to more effective and convenient therapies, boosting market demand. Rising healthcare expenditure contributes to increased spending on diabetes care.
Challenges in the Diabetes Care Drugs Market in Australia Sector
Despite significant growth potential, several challenges hinder market expansion. High drug prices and affordability issues limit accessibility for some patients. The increasing prevalence of generic and biosimilar competition impacts market profitability for originator brands. Regulatory hurdles and lengthy approval processes can delay product launches and market entry for innovative therapies. Supply chain disruptions can affect the availability and distribution of essential diabetes medications.
Leading Players in the Diabetes Care Drugs Market in Australia Market
- Merck And Co
- Pfizer
- Takeda
- Janssen Pharmaceuticals
- Eli Lilly
- Novartis
- AstraZeneca
- Bristol Myers Squibb
- Novo Nordisk
- Boehringer Ingelheim
- Sanofi
- Astellas
Key Developments in Diabetes Care Drugs Market in Australia Sector
- March 2023: The Albanese Government extended access to Fiasp insulin and Fiasp FlexTouch via the Pharmaceutical Benefits Scheme for an additional six months, improving patient access and affordability.
- May 2022: The TGA, in collaboration with Novo Nordisk and health professional organizations, prioritized Ozempic prescriptions for type 2 diabetes patients, influencing prescribing patterns and market share.
Strategic Diabetes Care Drugs Market in Australia Market Outlook
The Australian diabetes care drugs market holds significant future potential. The continued rise in diabetes prevalence, coupled with ongoing innovation in drug development and delivery, will drive market expansion. Strategic opportunities lie in developing and marketing innovative therapies addressing unmet needs, focusing on improved efficacy, safety, and convenience. Leveraging digital health technologies to enhance patient management and adherence can provide a competitive edge. Companies can explore collaborations and partnerships to optimize market access and expand their product portfolios.
Diabetes Care Drugs Market in Australia Segmentation
-
1. Product type
- 1.1. Oral anti-diabetic drugs
- 1.2. insulins
- 1.3. non-insulin injectables
- 1.4. combination drugs
-
2. Distribution channel
- 2.1. Hospitals
- 2.2. pharmacies
- 2.3. clinics
-
3. End-user
- 3.1. Type 1 diabetes patients
- 3.2. type 2 diabetes patients
Diabetes Care Drugs Market in Australia Segmentation By Geography
-
1. North America
- 1.1. United States
- 1.2. Canada
- 1.3. Mexico
-
2. South America
- 2.1. Brazil
- 2.2. Argentina
- 2.3. Rest of South America
-
3. Europe
- 3.1. United Kingdom
- 3.2. Germany
- 3.3. France
- 3.4. Italy
- 3.5. Spain
- 3.6. Russia
- 3.7. Benelux
- 3.8. Nordics
- 3.9. Rest of Europe
-
4. Middle East & Africa
- 4.1. Turkey
- 4.2. Israel
- 4.3. GCC
- 4.4. North Africa
- 4.5. South Africa
- 4.6. Rest of Middle East & Africa
-
5. Asia Pacific
- 5.1. China
- 5.2. India
- 5.3. Japan
- 5.4. South Korea
- 5.5. ASEAN
- 5.6. Oceania
- 5.7. Rest of Asia Pacific
Diabetes Care Drugs Market in Australia REPORT HIGHLIGHTS
| Aspects | Details |
|---|---|
| Study Period | 2019-2033 |
| Base Year | 2024 |
| Estimated Year | 2025 |
| Forecast Period | 2025-2033 |
| Historical Period | 2019-2024 |
| Growth Rate | CAGR of 3.60% from 2019-2033 |
| Segmentation |
|
Table of Contents
- 1. Introduction
- 1.1. Research Scope
- 1.2. Market Segmentation
- 1.3. Research Methodology
- 1.4. Definitions and Assumptions
- 2. Executive Summary
- 2.1. Introduction
- 3. Market Dynamics
- 3.1. Introduction
- 3.2. Market Drivers
- 3.2.1. Increasing Geriatric Population and Changing Dietary Habits; High Prevalence of Irritable bowel syndrome with constipation (IBS-C) and Opioid-induced constipation (OIC) and Chronic Constipation; Development of Latest Drugs and Treatment Procedures
- 3.3. Market Restrains
- 3.3.1. Increasing Dependence on Majority of Over-the-Counter (OTC) Drugs; Lack of Awareness and Reluctance Among Patients due to Adverse Effects of Opioid-Induced Constipation (OIC) Drugs
- 3.4. Market Trends
- 3.4.1. Oral-Anti Diabetes Drugs is Having the Highest Market Share in the Current Year.
- 4. Market Factor Analysis
- 4.1. Porters Five Forces
- 4.2. Supply/Value Chain
- 4.3. PESTEL analysis
- 4.4. Market Entropy
- 4.5. Patent/Trademark Analysis
- 5. Diabetes Care Drugs Market in Australia Analysis, Insights and Forecast, 2019-2031
- 5.1. Market Analysis, Insights and Forecast - by Product type
- 5.1.1. Oral anti-diabetic drugs
- 5.1.2. insulins
- 5.1.3. non-insulin injectables
- 5.1.4. combination drugs
- 5.2. Market Analysis, Insights and Forecast - by Distribution channel
- 5.2.1. Hospitals
- 5.2.2. pharmacies
- 5.2.3. clinics
- 5.3. Market Analysis, Insights and Forecast - by End-user
- 5.3.1. Type 1 diabetes patients
- 5.3.2. type 2 diabetes patients
- 5.4. Market Analysis, Insights and Forecast - by Region
- 5.4.1. North America
- 5.4.2. South America
- 5.4.3. Europe
- 5.4.4. Middle East & Africa
- 5.4.5. Asia Pacific
- 5.1. Market Analysis, Insights and Forecast - by Product type
- 6. North America Diabetes Care Drugs Market in Australia Analysis, Insights and Forecast, 2019-2031
- 6.1. Market Analysis, Insights and Forecast - by Product type
- 6.1.1. Oral anti-diabetic drugs
- 6.1.2. insulins
- 6.1.3. non-insulin injectables
- 6.1.4. combination drugs
- 6.2. Market Analysis, Insights and Forecast - by Distribution channel
- 6.2.1. Hospitals
- 6.2.2. pharmacies
- 6.2.3. clinics
- 6.3. Market Analysis, Insights and Forecast - by End-user
- 6.3.1. Type 1 diabetes patients
- 6.3.2. type 2 diabetes patients
- 6.1. Market Analysis, Insights and Forecast - by Product type
- 7. South America Diabetes Care Drugs Market in Australia Analysis, Insights and Forecast, 2019-2031
- 7.1. Market Analysis, Insights and Forecast - by Product type
- 7.1.1. Oral anti-diabetic drugs
- 7.1.2. insulins
- 7.1.3. non-insulin injectables
- 7.1.4. combination drugs
- 7.2. Market Analysis, Insights and Forecast - by Distribution channel
- 7.2.1. Hospitals
- 7.2.2. pharmacies
- 7.2.3. clinics
- 7.3. Market Analysis, Insights and Forecast - by End-user
- 7.3.1. Type 1 diabetes patients
- 7.3.2. type 2 diabetes patients
- 7.1. Market Analysis, Insights and Forecast - by Product type
- 8. Europe Diabetes Care Drugs Market in Australia Analysis, Insights and Forecast, 2019-2031
- 8.1. Market Analysis, Insights and Forecast - by Product type
- 8.1.1. Oral anti-diabetic drugs
- 8.1.2. insulins
- 8.1.3. non-insulin injectables
- 8.1.4. combination drugs
- 8.2. Market Analysis, Insights and Forecast - by Distribution channel
- 8.2.1. Hospitals
- 8.2.2. pharmacies
- 8.2.3. clinics
- 8.3. Market Analysis, Insights and Forecast - by End-user
- 8.3.1. Type 1 diabetes patients
- 8.3.2. type 2 diabetes patients
- 8.1. Market Analysis, Insights and Forecast - by Product type
- 9. Middle East & Africa Diabetes Care Drugs Market in Australia Analysis, Insights and Forecast, 2019-2031
- 9.1. Market Analysis, Insights and Forecast - by Product type
- 9.1.1. Oral anti-diabetic drugs
- 9.1.2. insulins
- 9.1.3. non-insulin injectables
- 9.1.4. combination drugs
- 9.2. Market Analysis, Insights and Forecast - by Distribution channel
- 9.2.1. Hospitals
- 9.2.2. pharmacies
- 9.2.3. clinics
- 9.3. Market Analysis, Insights and Forecast - by End-user
- 9.3.1. Type 1 diabetes patients
- 9.3.2. type 2 diabetes patients
- 9.1. Market Analysis, Insights and Forecast - by Product type
- 10. Asia Pacific Diabetes Care Drugs Market in Australia Analysis, Insights and Forecast, 2019-2031
- 10.1. Market Analysis, Insights and Forecast - by Product type
- 10.1.1. Oral anti-diabetic drugs
- 10.1.2. insulins
- 10.1.3. non-insulin injectables
- 10.1.4. combination drugs
- 10.2. Market Analysis, Insights and Forecast - by Distribution channel
- 10.2.1. Hospitals
- 10.2.2. pharmacies
- 10.2.3. clinics
- 10.3. Market Analysis, Insights and Forecast - by End-user
- 10.3.1. Type 1 diabetes patients
- 10.3.2. type 2 diabetes patients
- 10.1. Market Analysis, Insights and Forecast - by Product type
- 11. Competitive Analysis
- 11.1. Market Share Analysis 2024
- 11.2. Company Profiles
- 11.2.1 Merck And Co
- 11.2.1.1. Overview
- 11.2.1.2. Products
- 11.2.1.3. SWOT Analysis
- 11.2.1.4. Recent Developments
- 11.2.1.5. Financials (Based on Availability)
- 11.2.2 Pfizer
- 11.2.2.1. Overview
- 11.2.2.2. Products
- 11.2.2.3. SWOT Analysis
- 11.2.2.4. Recent Developments
- 11.2.2.5. Financials (Based on Availability)
- 11.2.3 Takeda
- 11.2.3.1. Overview
- 11.2.3.2. Products
- 11.2.3.3. SWOT Analysis
- 11.2.3.4. Recent Developments
- 11.2.3.5. Financials (Based on Availability)
- 11.2.4 Janssen Pharmaceuticals
- 11.2.4.1. Overview
- 11.2.4.2. Products
- 11.2.4.3. SWOT Analysis
- 11.2.4.4. Recent Developments
- 11.2.4.5. Financials (Based on Availability)
- 11.2.5 Eli Lilly
- 11.2.5.1. Overview
- 11.2.5.2. Products
- 11.2.5.3. SWOT Analysis
- 11.2.5.4. Recent Developments
- 11.2.5.5. Financials (Based on Availability)
- 11.2.6 Novartis
- 11.2.6.1. Overview
- 11.2.6.2. Products
- 11.2.6.3. SWOT Analysis
- 11.2.6.4. Recent Developments
- 11.2.6.5. Financials (Based on Availability)
- 11.2.7 AstraZeneca
- 11.2.7.1. Overview
- 11.2.7.2. Products
- 11.2.7.3. SWOT Analysis
- 11.2.7.4. Recent Developments
- 11.2.7.5. Financials (Based on Availability)
- 11.2.8 Bristol Myers Squibb
- 11.2.8.1. Overview
- 11.2.8.2. Products
- 11.2.8.3. SWOT Analysis
- 11.2.8.4. Recent Developments
- 11.2.8.5. Financials (Based on Availability)
- 11.2.9 Novo Nordisk
- 11.2.9.1. Overview
- 11.2.9.2. Products
- 11.2.9.3. SWOT Analysis
- 11.2.9.4. Recent Developments
- 11.2.9.5. Financials (Based on Availability)
- 11.2.10 Boehringer Ingelheim
- 11.2.10.1. Overview
- 11.2.10.2. Products
- 11.2.10.3. SWOT Analysis
- 11.2.10.4. Recent Developments
- 11.2.10.5. Financials (Based on Availability)
- 11.2.11 Sanofi
- 11.2.11.1. Overview
- 11.2.11.2. Products
- 11.2.11.3. SWOT Analysis
- 11.2.11.4. Recent Developments
- 11.2.11.5. Financials (Based on Availability)
- 11.2.12 Astellas
- 11.2.12.1. Overview
- 11.2.12.2. Products
- 11.2.12.3. SWOT Analysis
- 11.2.12.4. Recent Developments
- 11.2.12.5. Financials (Based on Availability)
- 11.2.1 Merck And Co
List of Figures
- Figure 1: Diabetes Care Drugs Market in Australia Revenue Breakdown (Million, %) by Product 2024 & 2032
- Figure 2: Diabetes Care Drugs Market in Australia Share (%) by Company 2024
List of Tables
- Table 1: Diabetes Care Drugs Market in Australia Revenue Million Forecast, by Region 2019 & 2032
- Table 2: Diabetes Care Drugs Market in Australia Volume K Unit Forecast, by Region 2019 & 2032
- Table 3: Diabetes Care Drugs Market in Australia Revenue Million Forecast, by Product type 2019 & 2032
- Table 4: Diabetes Care Drugs Market in Australia Volume K Unit Forecast, by Product type 2019 & 2032
- Table 5: Diabetes Care Drugs Market in Australia Revenue Million Forecast, by Distribution channel 2019 & 2032
- Table 6: Diabetes Care Drugs Market in Australia Volume K Unit Forecast, by Distribution channel 2019 & 2032
- Table 7: Diabetes Care Drugs Market in Australia Revenue Million Forecast, by End-user 2019 & 2032
- Table 8: Diabetes Care Drugs Market in Australia Volume K Unit Forecast, by End-user 2019 & 2032
- Table 9: Diabetes Care Drugs Market in Australia Revenue Million Forecast, by Region 2019 & 2032
- Table 10: Diabetes Care Drugs Market in Australia Volume K Unit Forecast, by Region 2019 & 2032
- Table 11: Diabetes Care Drugs Market in Australia Revenue Million Forecast, by Country 2019 & 2032
- Table 12: Diabetes Care Drugs Market in Australia Volume K Unit Forecast, by Country 2019 & 2032
- Table 13: Diabetes Care Drugs Market in Australia Revenue Million Forecast, by Product type 2019 & 2032
- Table 14: Diabetes Care Drugs Market in Australia Volume K Unit Forecast, by Product type 2019 & 2032
- Table 15: Diabetes Care Drugs Market in Australia Revenue Million Forecast, by Distribution channel 2019 & 2032
- Table 16: Diabetes Care Drugs Market in Australia Volume K Unit Forecast, by Distribution channel 2019 & 2032
- Table 17: Diabetes Care Drugs Market in Australia Revenue Million Forecast, by End-user 2019 & 2032
- Table 18: Diabetes Care Drugs Market in Australia Volume K Unit Forecast, by End-user 2019 & 2032
- Table 19: Diabetes Care Drugs Market in Australia Revenue Million Forecast, by Country 2019 & 2032
- Table 20: Diabetes Care Drugs Market in Australia Volume K Unit Forecast, by Country 2019 & 2032
- Table 21: United States Diabetes Care Drugs Market in Australia Revenue (Million) Forecast, by Application 2019 & 2032
- Table 22: United States Diabetes Care Drugs Market in Australia Volume (K Unit) Forecast, by Application 2019 & 2032
- Table 23: Canada Diabetes Care Drugs Market in Australia Revenue (Million) Forecast, by Application 2019 & 2032
- Table 24: Canada Diabetes Care Drugs Market in Australia Volume (K Unit) Forecast, by Application 2019 & 2032
- Table 25: Mexico Diabetes Care Drugs Market in Australia Revenue (Million) Forecast, by Application 2019 & 2032
- Table 26: Mexico Diabetes Care Drugs Market in Australia Volume (K Unit) Forecast, by Application 2019 & 2032
- Table 27: Diabetes Care Drugs Market in Australia Revenue Million Forecast, by Product type 2019 & 2032
- Table 28: Diabetes Care Drugs Market in Australia Volume K Unit Forecast, by Product type 2019 & 2032
- Table 29: Diabetes Care Drugs Market in Australia Revenue Million Forecast, by Distribution channel 2019 & 2032
- Table 30: Diabetes Care Drugs Market in Australia Volume K Unit Forecast, by Distribution channel 2019 & 2032
- Table 31: Diabetes Care Drugs Market in Australia Revenue Million Forecast, by End-user 2019 & 2032
- Table 32: Diabetes Care Drugs Market in Australia Volume K Unit Forecast, by End-user 2019 & 2032
- Table 33: Diabetes Care Drugs Market in Australia Revenue Million Forecast, by Country 2019 & 2032
- Table 34: Diabetes Care Drugs Market in Australia Volume K Unit Forecast, by Country 2019 & 2032
- Table 35: Brazil Diabetes Care Drugs Market in Australia Revenue (Million) Forecast, by Application 2019 & 2032
- Table 36: Brazil Diabetes Care Drugs Market in Australia Volume (K Unit) Forecast, by Application 2019 & 2032
- Table 37: Argentina Diabetes Care Drugs Market in Australia Revenue (Million) Forecast, by Application 2019 & 2032
- Table 38: Argentina Diabetes Care Drugs Market in Australia Volume (K Unit) Forecast, by Application 2019 & 2032
- Table 39: Rest of South America Diabetes Care Drugs Market in Australia Revenue (Million) Forecast, by Application 2019 & 2032
- Table 40: Rest of South America Diabetes Care Drugs Market in Australia Volume (K Unit) Forecast, by Application 2019 & 2032
- Table 41: Diabetes Care Drugs Market in Australia Revenue Million Forecast, by Product type 2019 & 2032
- Table 42: Diabetes Care Drugs Market in Australia Volume K Unit Forecast, by Product type 2019 & 2032
- Table 43: Diabetes Care Drugs Market in Australia Revenue Million Forecast, by Distribution channel 2019 & 2032
- Table 44: Diabetes Care Drugs Market in Australia Volume K Unit Forecast, by Distribution channel 2019 & 2032
- Table 45: Diabetes Care Drugs Market in Australia Revenue Million Forecast, by End-user 2019 & 2032
- Table 46: Diabetes Care Drugs Market in Australia Volume K Unit Forecast, by End-user 2019 & 2032
- Table 47: Diabetes Care Drugs Market in Australia Revenue Million Forecast, by Country 2019 & 2032
- Table 48: Diabetes Care Drugs Market in Australia Volume K Unit Forecast, by Country 2019 & 2032
- Table 49: United Kingdom Diabetes Care Drugs Market in Australia Revenue (Million) Forecast, by Application 2019 & 2032
- Table 50: United Kingdom Diabetes Care Drugs Market in Australia Volume (K Unit) Forecast, by Application 2019 & 2032
- Table 51: Germany Diabetes Care Drugs Market in Australia Revenue (Million) Forecast, by Application 2019 & 2032
- Table 52: Germany Diabetes Care Drugs Market in Australia Volume (K Unit) Forecast, by Application 2019 & 2032
- Table 53: France Diabetes Care Drugs Market in Australia Revenue (Million) Forecast, by Application 2019 & 2032
- Table 54: France Diabetes Care Drugs Market in Australia Volume (K Unit) Forecast, by Application 2019 & 2032
- Table 55: Italy Diabetes Care Drugs Market in Australia Revenue (Million) Forecast, by Application 2019 & 2032
- Table 56: Italy Diabetes Care Drugs Market in Australia Volume (K Unit) Forecast, by Application 2019 & 2032
- Table 57: Spain Diabetes Care Drugs Market in Australia Revenue (Million) Forecast, by Application 2019 & 2032
- Table 58: Spain Diabetes Care Drugs Market in Australia Volume (K Unit) Forecast, by Application 2019 & 2032
- Table 59: Russia Diabetes Care Drugs Market in Australia Revenue (Million) Forecast, by Application 2019 & 2032
- Table 60: Russia Diabetes Care Drugs Market in Australia Volume (K Unit) Forecast, by Application 2019 & 2032
- Table 61: Benelux Diabetes Care Drugs Market in Australia Revenue (Million) Forecast, by Application 2019 & 2032
- Table 62: Benelux Diabetes Care Drugs Market in Australia Volume (K Unit) Forecast, by Application 2019 & 2032
- Table 63: Nordics Diabetes Care Drugs Market in Australia Revenue (Million) Forecast, by Application 2019 & 2032
- Table 64: Nordics Diabetes Care Drugs Market in Australia Volume (K Unit) Forecast, by Application 2019 & 2032
- Table 65: Rest of Europe Diabetes Care Drugs Market in Australia Revenue (Million) Forecast, by Application 2019 & 2032
- Table 66: Rest of Europe Diabetes Care Drugs Market in Australia Volume (K Unit) Forecast, by Application 2019 & 2032
- Table 67: Diabetes Care Drugs Market in Australia Revenue Million Forecast, by Product type 2019 & 2032
- Table 68: Diabetes Care Drugs Market in Australia Volume K Unit Forecast, by Product type 2019 & 2032
- Table 69: Diabetes Care Drugs Market in Australia Revenue Million Forecast, by Distribution channel 2019 & 2032
- Table 70: Diabetes Care Drugs Market in Australia Volume K Unit Forecast, by Distribution channel 2019 & 2032
- Table 71: Diabetes Care Drugs Market in Australia Revenue Million Forecast, by End-user 2019 & 2032
- Table 72: Diabetes Care Drugs Market in Australia Volume K Unit Forecast, by End-user 2019 & 2032
- Table 73: Diabetes Care Drugs Market in Australia Revenue Million Forecast, by Country 2019 & 2032
- Table 74: Diabetes Care Drugs Market in Australia Volume K Unit Forecast, by Country 2019 & 2032
- Table 75: Turkey Diabetes Care Drugs Market in Australia Revenue (Million) Forecast, by Application 2019 & 2032
- Table 76: Turkey Diabetes Care Drugs Market in Australia Volume (K Unit) Forecast, by Application 2019 & 2032
- Table 77: Israel Diabetes Care Drugs Market in Australia Revenue (Million) Forecast, by Application 2019 & 2032
- Table 78: Israel Diabetes Care Drugs Market in Australia Volume (K Unit) Forecast, by Application 2019 & 2032
- Table 79: GCC Diabetes Care Drugs Market in Australia Revenue (Million) Forecast, by Application 2019 & 2032
- Table 80: GCC Diabetes Care Drugs Market in Australia Volume (K Unit) Forecast, by Application 2019 & 2032
- Table 81: North Africa Diabetes Care Drugs Market in Australia Revenue (Million) Forecast, by Application 2019 & 2032
- Table 82: North Africa Diabetes Care Drugs Market in Australia Volume (K Unit) Forecast, by Application 2019 & 2032
- Table 83: South Africa Diabetes Care Drugs Market in Australia Revenue (Million) Forecast, by Application 2019 & 2032
- Table 84: South Africa Diabetes Care Drugs Market in Australia Volume (K Unit) Forecast, by Application 2019 & 2032
- Table 85: Rest of Middle East & Africa Diabetes Care Drugs Market in Australia Revenue (Million) Forecast, by Application 2019 & 2032
- Table 86: Rest of Middle East & Africa Diabetes Care Drugs Market in Australia Volume (K Unit) Forecast, by Application 2019 & 2032
- Table 87: Diabetes Care Drugs Market in Australia Revenue Million Forecast, by Product type 2019 & 2032
- Table 88: Diabetes Care Drugs Market in Australia Volume K Unit Forecast, by Product type 2019 & 2032
- Table 89: Diabetes Care Drugs Market in Australia Revenue Million Forecast, by Distribution channel 2019 & 2032
- Table 90: Diabetes Care Drugs Market in Australia Volume K Unit Forecast, by Distribution channel 2019 & 2032
- Table 91: Diabetes Care Drugs Market in Australia Revenue Million Forecast, by End-user 2019 & 2032
- Table 92: Diabetes Care Drugs Market in Australia Volume K Unit Forecast, by End-user 2019 & 2032
- Table 93: Diabetes Care Drugs Market in Australia Revenue Million Forecast, by Country 2019 & 2032
- Table 94: Diabetes Care Drugs Market in Australia Volume K Unit Forecast, by Country 2019 & 2032
- Table 95: China Diabetes Care Drugs Market in Australia Revenue (Million) Forecast, by Application 2019 & 2032
- Table 96: China Diabetes Care Drugs Market in Australia Volume (K Unit) Forecast, by Application 2019 & 2032
- Table 97: India Diabetes Care Drugs Market in Australia Revenue (Million) Forecast, by Application 2019 & 2032
- Table 98: India Diabetes Care Drugs Market in Australia Volume (K Unit) Forecast, by Application 2019 & 2032
- Table 99: Japan Diabetes Care Drugs Market in Australia Revenue (Million) Forecast, by Application 2019 & 2032
- Table 100: Japan Diabetes Care Drugs Market in Australia Volume (K Unit) Forecast, by Application 2019 & 2032
- Table 101: South Korea Diabetes Care Drugs Market in Australia Revenue (Million) Forecast, by Application 2019 & 2032
- Table 102: South Korea Diabetes Care Drugs Market in Australia Volume (K Unit) Forecast, by Application 2019 & 2032
- Table 103: ASEAN Diabetes Care Drugs Market in Australia Revenue (Million) Forecast, by Application 2019 & 2032
- Table 104: ASEAN Diabetes Care Drugs Market in Australia Volume (K Unit) Forecast, by Application 2019 & 2032
- Table 105: Oceania Diabetes Care Drugs Market in Australia Revenue (Million) Forecast, by Application 2019 & 2032
- Table 106: Oceania Diabetes Care Drugs Market in Australia Volume (K Unit) Forecast, by Application 2019 & 2032
- Table 107: Rest of Asia Pacific Diabetes Care Drugs Market in Australia Revenue (Million) Forecast, by Application 2019 & 2032
- Table 108: Rest of Asia Pacific Diabetes Care Drugs Market in Australia Volume (K Unit) Forecast, by Application 2019 & 2032
Frequently Asked Questions
1. What is the projected Compound Annual Growth Rate (CAGR) of the Diabetes Care Drugs Market in Australia?
The projected CAGR is approximately 3.60%.
2. Which companies are prominent players in the Diabetes Care Drugs Market in Australia?
Key companies in the market include Merck And Co, Pfizer, Takeda, Janssen Pharmaceuticals, Eli Lilly, Novartis, AstraZeneca, Bristol Myers Squibb, Novo Nordisk, Boehringer Ingelheim, Sanofi, Astellas.
3. What are the main segments of the Diabetes Care Drugs Market in Australia?
The market segments include Product type, Distribution channel, End-user.
4. Can you provide details about the market size?
The market size is estimated to be USD 815.19 Million as of 2022.
5. What are some drivers contributing to market growth?
Increasing Geriatric Population and Changing Dietary Habits; High Prevalence of Irritable bowel syndrome with constipation (IBS-C) and Opioid-induced constipation (OIC) and Chronic Constipation; Development of Latest Drugs and Treatment Procedures.
6. What are the notable trends driving market growth?
Oral-Anti Diabetes Drugs is Having the Highest Market Share in the Current Year..
7. Are there any restraints impacting market growth?
Increasing Dependence on Majority of Over-the-Counter (OTC) Drugs; Lack of Awareness and Reluctance Among Patients due to Adverse Effects of Opioid-Induced Constipation (OIC) Drugs.
8. Can you provide examples of recent developments in the market?
March 2023: Albanese Government decided to extend access to Fiasp insulin and Fiasp FlexTouch via the Pharmaceutical Benefits Scheme for an additional six months. Under the arrangements, people with a current prescription for Fiasp can access it for the next six months.
9. What pricing options are available for accessing the report?
Pricing options include single-user, multi-user, and enterprise licenses priced at USD 3800, USD 4500, and USD 5800 respectively.
10. Is the market size provided in terms of value or volume?
The market size is provided in terms of value, measured in Million and volume, measured in K Unit.
11. Are there any specific market keywords associated with the report?
Yes, the market keyword associated with the report is "Diabetes Care Drugs Market in Australia," which aids in identifying and referencing the specific market segment covered.
12. How do I determine which pricing option suits my needs best?
The pricing options vary based on user requirements and access needs. Individual users may opt for single-user licenses, while businesses requiring broader access may choose multi-user or enterprise licenses for cost-effective access to the report.
13. Are there any additional resources or data provided in the Diabetes Care Drugs Market in Australia report?
While the report offers comprehensive insights, it's advisable to review the specific contents or supplementary materials provided to ascertain if additional resources or data are available.
14. How can I stay updated on further developments or reports in the Diabetes Care Drugs Market in Australia?
To stay informed about further developments, trends, and reports in the Diabetes Care Drugs Market in Australia, consider subscribing to industry newsletters, following relevant companies and organizations, or regularly checking reputable industry news sources and publications.
Methodology
Step 1 - Identification of Relevant Samples Size from Population Database


Step 2 - Approaches for Defining Global Market Size (Value, Volume* & Price*)

Note*: In applicable scenarios
Step 3 - Data Sources
Primary Research
- Web Analytics
- Survey Reports
- Research Institute
- Latest Research Reports
- Opinion Leaders
Secondary Research
- Annual Reports
- White Paper
- Latest Press Release
- Industry Association
- Paid Database
- Investor Presentations

Step 4 - Data Triangulation
Involves using different sources of information in order to increase the validity of a study
These sources are likely to be stakeholders in a program - participants, other researchers, program staff, other community members, and so on.
Then we put all data in single framework & apply various statistical tools to find out the dynamic on the market.
During the analysis stage, feedback from the stakeholder groups would be compared to determine areas of agreement as well as areas of divergence


