
Key Insights
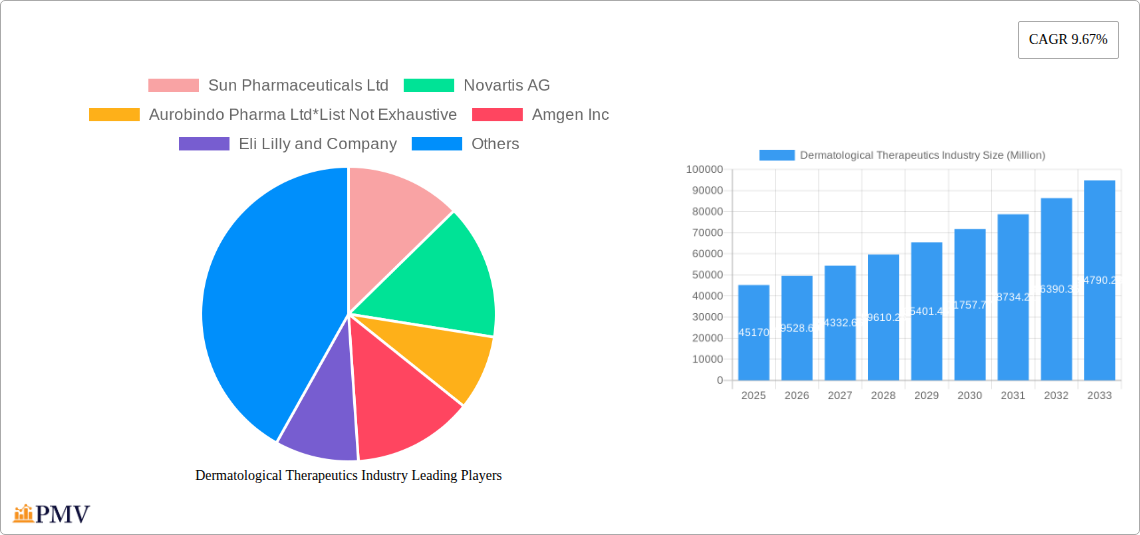
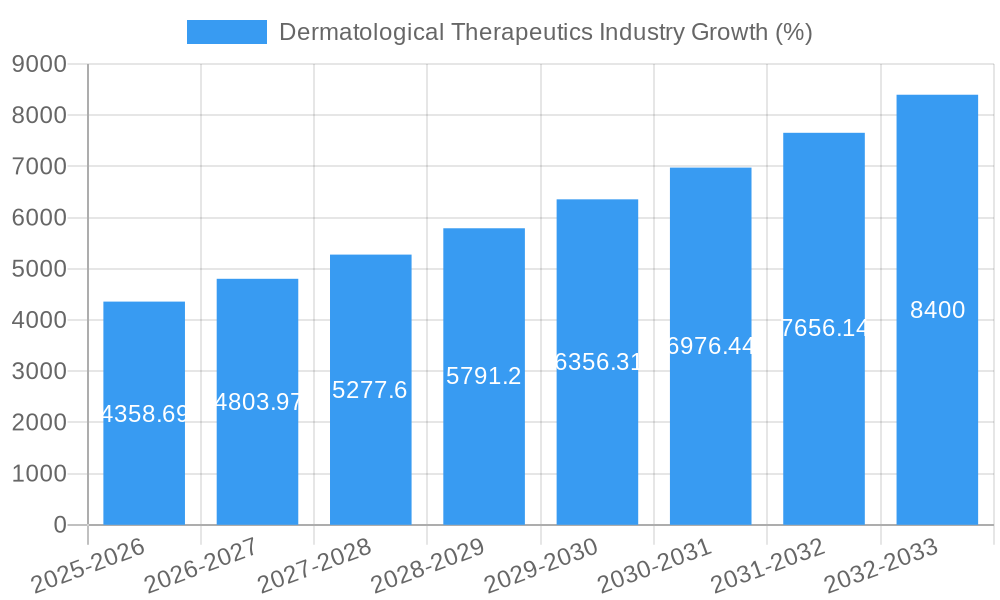
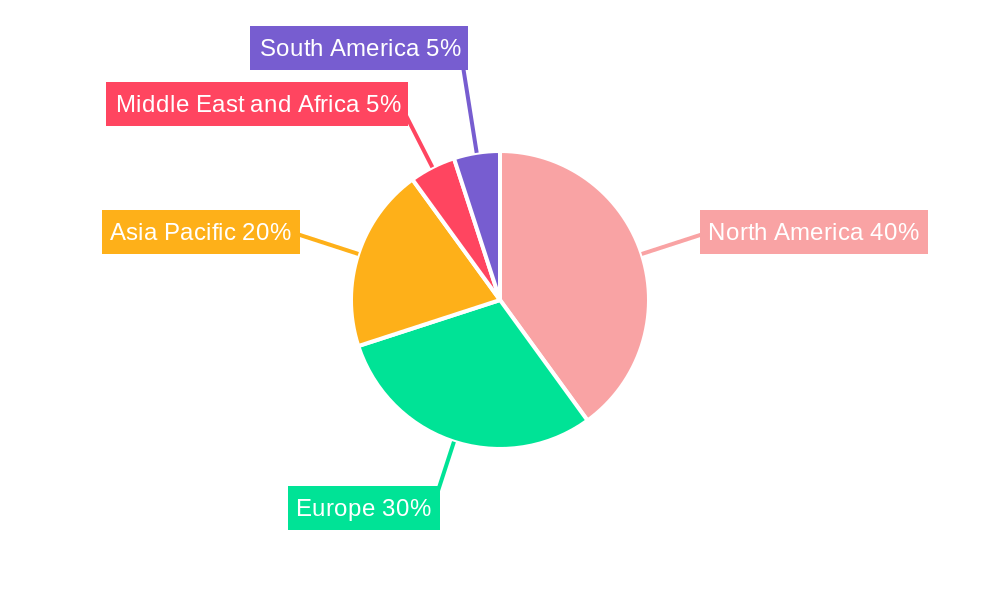
The global dermatological therapeutics market, valued at $45.17 billion in 2025, is projected to experience robust growth, exhibiting a Compound Annual Growth Rate (CAGR) of 9.67% from 2025 to 2033. This expansion is driven by several key factors. Rising prevalence of skin conditions like acne, psoriasis, eczema (atopic dermatitis), and rosacea, coupled with an aging global population increasingly susceptible to skin ailments, fuels market demand. Advancements in drug development, leading to more effective and targeted therapies, further contribute to growth. The increasing awareness of skin health and the rising adoption of aesthetic dermatological procedures also play a significant role. Market segmentation reveals a diverse landscape, with anti-infectives, corticosteroids, and retinoids among the leading drug classes. Geographically, North America and Europe currently hold significant market shares due to high healthcare expenditure and advanced medical infrastructure. However, the Asia-Pacific region is expected to witness rapid growth in the coming years driven by increasing disposable incomes, rising awareness, and expanding healthcare access.
The market's growth trajectory, however, faces some challenges. High treatment costs and the potential for side effects associated with certain dermatological drugs can limit market penetration, particularly in developing economies. Furthermore, the development and approval of new drugs is a lengthy and expensive process, potentially hindering the introduction of innovative therapies to the market. Regulatory hurdles and variations in healthcare reimbursement policies across different regions also pose challenges to market players. Competition among established pharmaceutical companies and emerging biotech firms is intense, requiring companies to focus on innovation and strategic partnerships to maintain a competitive edge. Despite these restraints, the long-term outlook for the dermatological therapeutics market remains positive, fueled by ongoing research and development, expanding treatment options, and a growing global population with increasing awareness of skin health.
Dermatological Therapeutics Industry: Market Report 2019-2033
This comprehensive report provides an in-depth analysis of the dermatological therapeutics industry, encompassing market size, segmentation, competitive landscape, and future growth prospects from 2019 to 2033. The study period covers the historical period (2019-2024), the base year (2025), and the forecast period (2025-2033). The report is crucial for pharmaceutical companies, investors, and market researchers seeking to understand and capitalize on the opportunities within this dynamic sector. The total market value in 2025 is estimated at xx Million, and a CAGR of xx% is projected for the forecast period.
Dermatological Therapeutics Industry Market Structure & Competitive Dynamics
The dermatological therapeutics market is characterized by a moderately concentrated structure with several multinational pharmaceutical companies holding significant market share. Key players include Sun Pharmaceuticals Ltd, Novartis AG, Aurobindo Pharma Ltd, Amgen Inc, Eli Lilly and Company, Galderma SA, Abbvie Inc (Allergan PLC), Almirall SA, Johnson & Johnson, Bausch Health Companies Inc, LEO Pharma AS, Aclaris Therapeutics Inc, Bristol-Myers Squibb Company, GlaxoSmithKline PLC, and Pfizer Inc. However, the market also accommodates smaller, specialized companies focusing on niche therapeutic areas. The market share held by the top 5 companies is estimated at xx% in 2025.
- Market Concentration: The Herfindahl-Hirschman Index (HHI) is estimated to be xx, indicating a moderately concentrated market.
- Innovation Ecosystems: Significant R&D investments drive innovation, focused on developing novel drug delivery systems, targeted therapies, and biosimilars.
- Regulatory Frameworks: Stringent regulatory approvals (e.g., FDA, EMA) influence market entry and product lifecycle management.
- Product Substitutes: The availability of generic and biosimilar drugs impacts pricing and market competition.
- End-User Trends: Increasing prevalence of dermatological conditions, growing awareness, and improved healthcare access are driving market growth.
- M&A Activities: The industry witnesses consistent M&A activity, with deal values exceeding xx Million in recent years, driven by companies seeking to expand their product portfolios and market reach. Examples include xx.
Dermatological Therapeutics Industry Industry Trends & Insights
The dermatological therapeutics market exhibits robust growth, driven by several factors. The increasing prevalence of chronic skin conditions like psoriasis, atopic dermatitis, and acne, coupled with rising healthcare expenditure and improved diagnostics, fuels market expansion. Technological advancements, such as the development of targeted therapies and novel drug delivery systems, significantly contribute to market growth. Furthermore, changing consumer preferences towards convenient, efficacious, and safe treatments are shaping market dynamics. The market is witnessing a shift towards personalized medicine approaches. The competitive landscape remains intensely dynamic, with continuous product launches, strategic partnerships, and mergers and acquisitions. The overall market is expected to experience significant growth during the forecast period, exceeding xx Million by 2033. This translates to a CAGR of xx%. Market penetration of novel therapies continues to increase, with xx% penetration for xx drug class in 2025.
Dominant Markets & Segments in Dermatological Therapeutics Industry
The North American region currently dominates the dermatological therapeutics market, driven by high healthcare expenditure, advanced infrastructure, and a significant patient population suffering from various skin conditions. However, the Asia-Pacific region exhibits promising growth potential, owing to rapid economic development and rising healthcare awareness.
By Application:
- Psoriasis: This segment holds a significant market share due to the high prevalence of the disease and ongoing innovation in treatment options. Key drivers include increased awareness, improved diagnostics, and the launch of new biologics and small molecule drugs.
- Atopic Dermatitis: This segment experiences substantial growth, fueled by the increasing prevalence of the condition and the availability of effective treatments. Market expansion is driven by the launch of novel biologics and improved topical therapies.
- Other Applications (Alopecia, Herpes, Rosacea, etc.): These segments contribute significantly to overall market revenue, exhibiting steady growth driven by advancements in treatment modalities.
By Drug Class:
- Biologics: This segment shows the highest growth rate, primarily due to the efficacy and target specificity of these therapies in treating chronic inflammatory skin conditions.
- Topical Corticosteroids: This segment maintains a substantial market share due to their widespread use and cost-effectiveness in treating various skin conditions.
- Other Drug Classes (Anti-infectives, Anti-acne, Calcineurin Inhibitors, Retinoids): These segments play a supporting role in the overall dermatological therapeutics market, with growth driven by innovation and expansion into new indications.
Dermatological Therapeutics Industry Product Innovations
Recent years have witnessed a surge in innovative products within the dermatological therapeutics space, focusing on improving efficacy, safety, and convenience. Technological advancements in drug delivery systems, such as topical formulations with enhanced penetration and targeted therapies, are transforming the treatment landscape. The market is witnessing an increased focus on biosimilars, offering cost-effective alternatives to existing biologics, leading to greater accessibility and affordability of treatments. Moreover, the development of personalized medicine approaches tailored to individual patient needs further enhances the effectiveness of therapy.
Report Segmentation & Scope
This report comprehensively segments the dermatological therapeutics market by application (Alopecia, Herpes, Psoriasis, Rosacea, Atopic Dermatitis, Other Applications) and by drug class (Anti-infectives, Corticosteroids, Anti-acne, Calcineurin Inhibitors, Retinoids, Other Drug Classes). Each segment is analyzed based on its market size, growth rate, and competitive dynamics. Growth projections are provided for each segment, considering factors such as prevalence rates, technological advancements, and regulatory changes. The competitive landscape for each segment is evaluated, highlighting key players, their market share, and their strategies.
Key Drivers of Dermatological Therapeutics Industry Growth
Several factors contribute to the growth of the dermatological therapeutics industry. These include:
- Rising prevalence of skin diseases: The increasing incidence of chronic skin conditions like psoriasis, eczema, and acne globally fuels market demand.
- Technological advancements: Developments in targeted therapies, biosimilars, and improved drug delivery systems enhance treatment efficacy and patient outcomes.
- Increased healthcare spending: Higher healthcare expenditure globally increases access to specialized dermatological care and advanced therapies.
- Growing awareness and improved diagnostics: Increased patient awareness and access to advanced diagnostic tools lead to earlier detection and improved treatment outcomes.
Challenges in the Dermatological Therapeutics Industry Sector
Despite the substantial growth potential, the dermatological therapeutics industry faces certain challenges:
- High R&D costs and lengthy regulatory approval processes: Developing novel therapies requires significant investment and time, creating barriers to market entry.
- Competition from generics and biosimilars: The entry of generic and biosimilar drugs increases price competition and impacts profitability.
- Adverse effects and safety concerns: The potential for adverse effects associated with certain therapies can limit market adoption.
- Patent expirations: Patent expiry for blockbuster drugs leads to increased competition and reduced market exclusivity. These factors, collectively, contribute to an overall decrease in profit margins for some established players. The average cost of bringing a new drug to market is estimated at xx Million.
Leading Players in the Dermatological Therapeutics Industry Market
- Sun Pharmaceuticals Ltd
- Novartis AG
- Aurobindo Pharma Ltd
- Amgen Inc
- Eli Lilly and Company
- Galderma SA
- Abbvie Inc (Allergan PLC)
- Almirall SA
- Johnson & Johnson
- Bausch Health Companies Inc
- LEO Pharma AS
- Aclaris Therapeutics Inc
- Bristol-Myers Squibb Company
- GlaxoSmithKline PLC
- Pfizer Inc
Key Developments in Dermatological Therapeutics Industry Sector
- September 2022: US FDA approval of Sotyktu (deucravacitinib) for moderate-to-severe plaque psoriasis. This approval significantly expanded treatment options for psoriasis patients and boosted the market for oral therapies.
- July 2022: FDA approval of roflumilast cream (ZORYVE) for plaque psoriasis in patients aged 12 years and above. This broadened the available topical treatment options and increased market competition.
- January 2022: FDA approval of Abbvie's Rinvoq for refractory, moderate-to-severe atopic dermatitis in patients aged 12 years and older. This provided a new treatment option for patients who did not respond to other systemic therapies. These approvals illustrate the continued innovation within the industry and its impact on market dynamics.
Strategic Dermatological Therapeutics Industry Market Outlook
The dermatological therapeutics market is poised for continued growth, driven by the factors outlined above. Strategic opportunities exist for companies focused on developing innovative therapies, optimizing drug delivery systems, and addressing unmet medical needs. The focus on personalized medicine and the increasing adoption of biosimilars will shape the market landscape. Furthermore, expansion into emerging markets with significant unmet needs presents substantial growth potential. The long-term outlook for the dermatological therapeutics market remains positive, with the potential for substantial market expansion over the next decade.
Dermatological Therapeutics Industry Segmentation
-
1. Application
- 1.1. Alopecia
- 1.2. Herpes
- 1.3. Psoriasis
- 1.4. Rosacea
- 1.5. Atopic Dermatitis
- 1.6. Other Applications
-
2. Drug Class
- 2.1. Anti-infectives
- 2.2. Corticosteroids
- 2.3. Anti-acne
- 2.4. Calcineurin Inhibitors
- 2.5. Retinoids
- 2.6. Other Drug Classes
Dermatological Therapeutics Industry Segmentation By Geography
-
1. North America
- 1.1. United States
- 1.2. Canada
- 1.3. Mexico
-
2. Europe
- 2.1. Germany
- 2.2. United Kingdom
- 2.3. France
- 2.4. Italy
- 2.5. Spain
- 2.6. Rest of Europe
-
3. Asia Pacific
- 3.1. China
- 3.2. Japan
- 3.3. India
- 3.4. Australia
- 3.5. South Korea
- 3.6. Rest of Asia Pacific
-
4. Middle East and Africa
- 4.1. GCC
- 4.2. South Africa
- 4.3. Rest of Middle East and Africa
-
5. South America
- 5.1. Brazil
- 5.2. Argentina
- 5.3. Rest of South America
Dermatological Therapeutics Industry REPORT HIGHLIGHTS
| Aspects | Details |
|---|---|
| Study Period | 2019-2033 |
| Base Year | 2024 |
| Estimated Year | 2025 |
| Forecast Period | 2025-2033 |
| Historical Period | 2019-2024 |
| Growth Rate | CAGR of 9.67% from 2019-2033 |
| Segmentation |
|
Table of Contents
- 1. Introduction
- 1.1. Research Scope
- 1.2. Market Segmentation
- 1.3. Research Methodology
- 1.4. Definitions and Assumptions
- 2. Executive Summary
- 2.1. Introduction
- 3. Market Dynamics
- 3.1. Introduction
- 3.2. Market Drivers
- 3.2.1. Growing Burden of Dermatology Diseases; Increasing Awareness Levels of Disease Progression and Etiology; Increasing Elderly Population
- 3.3. Market Restrains
- 3.3.1. Serious Side Effects for Certain Classes of Therapeutic Drugs
- 3.4. Market Trends
- 3.4.1. Psoriasis Segment is Expected to Hold a Significant Market Share Over the Forecast Period
- 4. Market Factor Analysis
- 4.1. Porters Five Forces
- 4.2. Supply/Value Chain
- 4.3. PESTEL analysis
- 4.4. Market Entropy
- 4.5. Patent/Trademark Analysis
- 5. Global Dermatological Therapeutics Industry Analysis, Insights and Forecast, 2019-2031
- 5.1. Market Analysis, Insights and Forecast - by Application
- 5.1.1. Alopecia
- 5.1.2. Herpes
- 5.1.3. Psoriasis
- 5.1.4. Rosacea
- 5.1.5. Atopic Dermatitis
- 5.1.6. Other Applications
- 5.2. Market Analysis, Insights and Forecast - by Drug Class
- 5.2.1. Anti-infectives
- 5.2.2. Corticosteroids
- 5.2.3. Anti-acne
- 5.2.4. Calcineurin Inhibitors
- 5.2.5. Retinoids
- 5.2.6. Other Drug Classes
- 5.3. Market Analysis, Insights and Forecast - by Region
- 5.3.1. North America
- 5.3.2. Europe
- 5.3.3. Asia Pacific
- 5.3.4. Middle East and Africa
- 5.3.5. South America
- 5.1. Market Analysis, Insights and Forecast - by Application
- 6. North America Dermatological Therapeutics Industry Analysis, Insights and Forecast, 2019-2031
- 6.1. Market Analysis, Insights and Forecast - by Application
- 6.1.1. Alopecia
- 6.1.2. Herpes
- 6.1.3. Psoriasis
- 6.1.4. Rosacea
- 6.1.5. Atopic Dermatitis
- 6.1.6. Other Applications
- 6.2. Market Analysis, Insights and Forecast - by Drug Class
- 6.2.1. Anti-infectives
- 6.2.2. Corticosteroids
- 6.2.3. Anti-acne
- 6.2.4. Calcineurin Inhibitors
- 6.2.5. Retinoids
- 6.2.6. Other Drug Classes
- 6.1. Market Analysis, Insights and Forecast - by Application
- 7. Europe Dermatological Therapeutics Industry Analysis, Insights and Forecast, 2019-2031
- 7.1. Market Analysis, Insights and Forecast - by Application
- 7.1.1. Alopecia
- 7.1.2. Herpes
- 7.1.3. Psoriasis
- 7.1.4. Rosacea
- 7.1.5. Atopic Dermatitis
- 7.1.6. Other Applications
- 7.2. Market Analysis, Insights and Forecast - by Drug Class
- 7.2.1. Anti-infectives
- 7.2.2. Corticosteroids
- 7.2.3. Anti-acne
- 7.2.4. Calcineurin Inhibitors
- 7.2.5. Retinoids
- 7.2.6. Other Drug Classes
- 7.1. Market Analysis, Insights and Forecast - by Application
- 8. Asia Pacific Dermatological Therapeutics Industry Analysis, Insights and Forecast, 2019-2031
- 8.1. Market Analysis, Insights and Forecast - by Application
- 8.1.1. Alopecia
- 8.1.2. Herpes
- 8.1.3. Psoriasis
- 8.1.4. Rosacea
- 8.1.5. Atopic Dermatitis
- 8.1.6. Other Applications
- 8.2. Market Analysis, Insights and Forecast - by Drug Class
- 8.2.1. Anti-infectives
- 8.2.2. Corticosteroids
- 8.2.3. Anti-acne
- 8.2.4. Calcineurin Inhibitors
- 8.2.5. Retinoids
- 8.2.6. Other Drug Classes
- 8.1. Market Analysis, Insights and Forecast - by Application
- 9. Middle East and Africa Dermatological Therapeutics Industry Analysis, Insights and Forecast, 2019-2031
- 9.1. Market Analysis, Insights and Forecast - by Application
- 9.1.1. Alopecia
- 9.1.2. Herpes
- 9.1.3. Psoriasis
- 9.1.4. Rosacea
- 9.1.5. Atopic Dermatitis
- 9.1.6. Other Applications
- 9.2. Market Analysis, Insights and Forecast - by Drug Class
- 9.2.1. Anti-infectives
- 9.2.2. Corticosteroids
- 9.2.3. Anti-acne
- 9.2.4. Calcineurin Inhibitors
- 9.2.5. Retinoids
- 9.2.6. Other Drug Classes
- 9.1. Market Analysis, Insights and Forecast - by Application
- 10. South America Dermatological Therapeutics Industry Analysis, Insights and Forecast, 2019-2031
- 10.1. Market Analysis, Insights and Forecast - by Application
- 10.1.1. Alopecia
- 10.1.2. Herpes
- 10.1.3. Psoriasis
- 10.1.4. Rosacea
- 10.1.5. Atopic Dermatitis
- 10.1.6. Other Applications
- 10.2. Market Analysis, Insights and Forecast - by Drug Class
- 10.2.1. Anti-infectives
- 10.2.2. Corticosteroids
- 10.2.3. Anti-acne
- 10.2.4. Calcineurin Inhibitors
- 10.2.5. Retinoids
- 10.2.6. Other Drug Classes
- 10.1. Market Analysis, Insights and Forecast - by Application
- 11. North America Dermatological Therapeutics Industry Analysis, Insights and Forecast, 2019-2031
- 11.1. Market Analysis, Insights and Forecast - By Country/Sub-region
- 11.1.1 United States
- 11.1.2 Canada
- 11.1.3 Mexico
- 12. Europe Dermatological Therapeutics Industry Analysis, Insights and Forecast, 2019-2031
- 12.1. Market Analysis, Insights and Forecast - By Country/Sub-region
- 12.1.1 Germany
- 12.1.2 United Kingdom
- 12.1.3 France
- 12.1.4 Italy
- 12.1.5 Spain
- 12.1.6 Rest of Europe
- 13. Asia Pacific Dermatological Therapeutics Industry Analysis, Insights and Forecast, 2019-2031
- 13.1. Market Analysis, Insights and Forecast - By Country/Sub-region
- 13.1.1 China
- 13.1.2 Japan
- 13.1.3 India
- 13.1.4 Australia
- 13.1.5 South Korea
- 13.1.6 Rest of Asia Pacific
- 14. Middle East and Africa Dermatological Therapeutics Industry Analysis, Insights and Forecast, 2019-2031
- 14.1. Market Analysis, Insights and Forecast - By Country/Sub-region
- 14.1.1 GCC
- 14.1.2 South Africa
- 14.1.3 Rest of Middle East and Africa
- 15. South America Dermatological Therapeutics Industry Analysis, Insights and Forecast, 2019-2031
- 15.1. Market Analysis, Insights and Forecast - By Country/Sub-region
- 15.1.1 Brazil
- 15.1.2 Argentina
- 15.1.3 Rest of South America
- 16. Competitive Analysis
- 16.1. Global Market Share Analysis 2024
- 16.2. Company Profiles
- 16.2.1 Sun Pharmaceuticals Ltd
- 16.2.1.1. Overview
- 16.2.1.2. Products
- 16.2.1.3. SWOT Analysis
- 16.2.1.4. Recent Developments
- 16.2.1.5. Financials (Based on Availability)
- 16.2.2 Novartis AG
- 16.2.2.1. Overview
- 16.2.2.2. Products
- 16.2.2.3. SWOT Analysis
- 16.2.2.4. Recent Developments
- 16.2.2.5. Financials (Based on Availability)
- 16.2.3 Aurobindo Pharma Ltd*List Not Exhaustive
- 16.2.3.1. Overview
- 16.2.3.2. Products
- 16.2.3.3. SWOT Analysis
- 16.2.3.4. Recent Developments
- 16.2.3.5. Financials (Based on Availability)
- 16.2.4 Amgen Inc
- 16.2.4.1. Overview
- 16.2.4.2. Products
- 16.2.4.3. SWOT Analysis
- 16.2.4.4. Recent Developments
- 16.2.4.5. Financials (Based on Availability)
- 16.2.5 Eli Lilly and Company
- 16.2.5.1. Overview
- 16.2.5.2. Products
- 16.2.5.3. SWOT Analysis
- 16.2.5.4. Recent Developments
- 16.2.5.5. Financials (Based on Availability)
- 16.2.6 Galderma SA
- 16.2.6.1. Overview
- 16.2.6.2. Products
- 16.2.6.3. SWOT Analysis
- 16.2.6.4. Recent Developments
- 16.2.6.5. Financials (Based on Availability)
- 16.2.7 Abbvie Inc (Allergan PLC)
- 16.2.7.1. Overview
- 16.2.7.2. Products
- 16.2.7.3. SWOT Analysis
- 16.2.7.4. Recent Developments
- 16.2.7.5. Financials (Based on Availability)
- 16.2.8 Almirall SA
- 16.2.8.1. Overview
- 16.2.8.2. Products
- 16.2.8.3. SWOT Analysis
- 16.2.8.4. Recent Developments
- 16.2.8.5. Financials (Based on Availability)
- 16.2.9 Johnson & Johnson
- 16.2.9.1. Overview
- 16.2.9.2. Products
- 16.2.9.3. SWOT Analysis
- 16.2.9.4. Recent Developments
- 16.2.9.5. Financials (Based on Availability)
- 16.2.10 Bausch Health Companies Inc
- 16.2.10.1. Overview
- 16.2.10.2. Products
- 16.2.10.3. SWOT Analysis
- 16.2.10.4. Recent Developments
- 16.2.10.5. Financials (Based on Availability)
- 16.2.11 LEO Pharma AS
- 16.2.11.1. Overview
- 16.2.11.2. Products
- 16.2.11.3. SWOT Analysis
- 16.2.11.4. Recent Developments
- 16.2.11.5. Financials (Based on Availability)
- 16.2.12 Aclaris Therapeutics Inc
- 16.2.12.1. Overview
- 16.2.12.2. Products
- 16.2.12.3. SWOT Analysis
- 16.2.12.4. Recent Developments
- 16.2.12.5. Financials (Based on Availability)
- 16.2.13 Bristol-Myers Squibb Company
- 16.2.13.1. Overview
- 16.2.13.2. Products
- 16.2.13.3. SWOT Analysis
- 16.2.13.4. Recent Developments
- 16.2.13.5. Financials (Based on Availability)
- 16.2.14 GlaxoSmithKline PLC
- 16.2.14.1. Overview
- 16.2.14.2. Products
- 16.2.14.3. SWOT Analysis
- 16.2.14.4. Recent Developments
- 16.2.14.5. Financials (Based on Availability)
- 16.2.15 Pfizer Inc
- 16.2.15.1. Overview
- 16.2.15.2. Products
- 16.2.15.3. SWOT Analysis
- 16.2.15.4. Recent Developments
- 16.2.15.5. Financials (Based on Availability)
- 16.2.1 Sun Pharmaceuticals Ltd
List of Figures
- Figure 1: Global Dermatological Therapeutics Industry Revenue Breakdown (Million, %) by Region 2024 & 2032
- Figure 2: North America Dermatological Therapeutics Industry Revenue (Million), by Country 2024 & 2032
- Figure 3: North America Dermatological Therapeutics Industry Revenue Share (%), by Country 2024 & 2032
- Figure 4: Europe Dermatological Therapeutics Industry Revenue (Million), by Country 2024 & 2032
- Figure 5: Europe Dermatological Therapeutics Industry Revenue Share (%), by Country 2024 & 2032
- Figure 6: Asia Pacific Dermatological Therapeutics Industry Revenue (Million), by Country 2024 & 2032
- Figure 7: Asia Pacific Dermatological Therapeutics Industry Revenue Share (%), by Country 2024 & 2032
- Figure 8: Middle East and Africa Dermatological Therapeutics Industry Revenue (Million), by Country 2024 & 2032
- Figure 9: Middle East and Africa Dermatological Therapeutics Industry Revenue Share (%), by Country 2024 & 2032
- Figure 10: South America Dermatological Therapeutics Industry Revenue (Million), by Country 2024 & 2032
- Figure 11: South America Dermatological Therapeutics Industry Revenue Share (%), by Country 2024 & 2032
- Figure 12: North America Dermatological Therapeutics Industry Revenue (Million), by Application 2024 & 2032
- Figure 13: North America Dermatological Therapeutics Industry Revenue Share (%), by Application 2024 & 2032
- Figure 14: North America Dermatological Therapeutics Industry Revenue (Million), by Drug Class 2024 & 2032
- Figure 15: North America Dermatological Therapeutics Industry Revenue Share (%), by Drug Class 2024 & 2032
- Figure 16: North America Dermatological Therapeutics Industry Revenue (Million), by Country 2024 & 2032
- Figure 17: North America Dermatological Therapeutics Industry Revenue Share (%), by Country 2024 & 2032
- Figure 18: Europe Dermatological Therapeutics Industry Revenue (Million), by Application 2024 & 2032
- Figure 19: Europe Dermatological Therapeutics Industry Revenue Share (%), by Application 2024 & 2032
- Figure 20: Europe Dermatological Therapeutics Industry Revenue (Million), by Drug Class 2024 & 2032
- Figure 21: Europe Dermatological Therapeutics Industry Revenue Share (%), by Drug Class 2024 & 2032
- Figure 22: Europe Dermatological Therapeutics Industry Revenue (Million), by Country 2024 & 2032
- Figure 23: Europe Dermatological Therapeutics Industry Revenue Share (%), by Country 2024 & 2032
- Figure 24: Asia Pacific Dermatological Therapeutics Industry Revenue (Million), by Application 2024 & 2032
- Figure 25: Asia Pacific Dermatological Therapeutics Industry Revenue Share (%), by Application 2024 & 2032
- Figure 26: Asia Pacific Dermatological Therapeutics Industry Revenue (Million), by Drug Class 2024 & 2032
- Figure 27: Asia Pacific Dermatological Therapeutics Industry Revenue Share (%), by Drug Class 2024 & 2032
- Figure 28: Asia Pacific Dermatological Therapeutics Industry Revenue (Million), by Country 2024 & 2032
- Figure 29: Asia Pacific Dermatological Therapeutics Industry Revenue Share (%), by Country 2024 & 2032
- Figure 30: Middle East and Africa Dermatological Therapeutics Industry Revenue (Million), by Application 2024 & 2032
- Figure 31: Middle East and Africa Dermatological Therapeutics Industry Revenue Share (%), by Application 2024 & 2032
- Figure 32: Middle East and Africa Dermatological Therapeutics Industry Revenue (Million), by Drug Class 2024 & 2032
- Figure 33: Middle East and Africa Dermatological Therapeutics Industry Revenue Share (%), by Drug Class 2024 & 2032
- Figure 34: Middle East and Africa Dermatological Therapeutics Industry Revenue (Million), by Country 2024 & 2032
- Figure 35: Middle East and Africa Dermatological Therapeutics Industry Revenue Share (%), by Country 2024 & 2032
- Figure 36: South America Dermatological Therapeutics Industry Revenue (Million), by Application 2024 & 2032
- Figure 37: South America Dermatological Therapeutics Industry Revenue Share (%), by Application 2024 & 2032
- Figure 38: South America Dermatological Therapeutics Industry Revenue (Million), by Drug Class 2024 & 2032
- Figure 39: South America Dermatological Therapeutics Industry Revenue Share (%), by Drug Class 2024 & 2032
- Figure 40: South America Dermatological Therapeutics Industry Revenue (Million), by Country 2024 & 2032
- Figure 41: South America Dermatological Therapeutics Industry Revenue Share (%), by Country 2024 & 2032
List of Tables
- Table 1: Global Dermatological Therapeutics Industry Revenue Million Forecast, by Region 2019 & 2032
- Table 2: Global Dermatological Therapeutics Industry Revenue Million Forecast, by Application 2019 & 2032
- Table 3: Global Dermatological Therapeutics Industry Revenue Million Forecast, by Drug Class 2019 & 2032
- Table 4: Global Dermatological Therapeutics Industry Revenue Million Forecast, by Region 2019 & 2032
- Table 5: Global Dermatological Therapeutics Industry Revenue Million Forecast, by Country 2019 & 2032
- Table 6: United States Dermatological Therapeutics Industry Revenue (Million) Forecast, by Application 2019 & 2032
- Table 7: Canada Dermatological Therapeutics Industry Revenue (Million) Forecast, by Application 2019 & 2032
- Table 8: Mexico Dermatological Therapeutics Industry Revenue (Million) Forecast, by Application 2019 & 2032
- Table 9: Global Dermatological Therapeutics Industry Revenue Million Forecast, by Country 2019 & 2032
- Table 10: Germany Dermatological Therapeutics Industry Revenue (Million) Forecast, by Application 2019 & 2032
- Table 11: United Kingdom Dermatological Therapeutics Industry Revenue (Million) Forecast, by Application 2019 & 2032
- Table 12: France Dermatological Therapeutics Industry Revenue (Million) Forecast, by Application 2019 & 2032
- Table 13: Italy Dermatological Therapeutics Industry Revenue (Million) Forecast, by Application 2019 & 2032
- Table 14: Spain Dermatological Therapeutics Industry Revenue (Million) Forecast, by Application 2019 & 2032
- Table 15: Rest of Europe Dermatological Therapeutics Industry Revenue (Million) Forecast, by Application 2019 & 2032
- Table 16: Global Dermatological Therapeutics Industry Revenue Million Forecast, by Country 2019 & 2032
- Table 17: China Dermatological Therapeutics Industry Revenue (Million) Forecast, by Application 2019 & 2032
- Table 18: Japan Dermatological Therapeutics Industry Revenue (Million) Forecast, by Application 2019 & 2032
- Table 19: India Dermatological Therapeutics Industry Revenue (Million) Forecast, by Application 2019 & 2032
- Table 20: Australia Dermatological Therapeutics Industry Revenue (Million) Forecast, by Application 2019 & 2032
- Table 21: South Korea Dermatological Therapeutics Industry Revenue (Million) Forecast, by Application 2019 & 2032
- Table 22: Rest of Asia Pacific Dermatological Therapeutics Industry Revenue (Million) Forecast, by Application 2019 & 2032
- Table 23: Global Dermatological Therapeutics Industry Revenue Million Forecast, by Country 2019 & 2032
- Table 24: GCC Dermatological Therapeutics Industry Revenue (Million) Forecast, by Application 2019 & 2032
- Table 25: South Africa Dermatological Therapeutics Industry Revenue (Million) Forecast, by Application 2019 & 2032
- Table 26: Rest of Middle East and Africa Dermatological Therapeutics Industry Revenue (Million) Forecast, by Application 2019 & 2032
- Table 27: Global Dermatological Therapeutics Industry Revenue Million Forecast, by Country 2019 & 2032
- Table 28: Brazil Dermatological Therapeutics Industry Revenue (Million) Forecast, by Application 2019 & 2032
- Table 29: Argentina Dermatological Therapeutics Industry Revenue (Million) Forecast, by Application 2019 & 2032
- Table 30: Rest of South America Dermatological Therapeutics Industry Revenue (Million) Forecast, by Application 2019 & 2032
- Table 31: Global Dermatological Therapeutics Industry Revenue Million Forecast, by Application 2019 & 2032
- Table 32: Global Dermatological Therapeutics Industry Revenue Million Forecast, by Drug Class 2019 & 2032
- Table 33: Global Dermatological Therapeutics Industry Revenue Million Forecast, by Country 2019 & 2032
- Table 34: United States Dermatological Therapeutics Industry Revenue (Million) Forecast, by Application 2019 & 2032
- Table 35: Canada Dermatological Therapeutics Industry Revenue (Million) Forecast, by Application 2019 & 2032
- Table 36: Mexico Dermatological Therapeutics Industry Revenue (Million) Forecast, by Application 2019 & 2032
- Table 37: Global Dermatological Therapeutics Industry Revenue Million Forecast, by Application 2019 & 2032
- Table 38: Global Dermatological Therapeutics Industry Revenue Million Forecast, by Drug Class 2019 & 2032
- Table 39: Global Dermatological Therapeutics Industry Revenue Million Forecast, by Country 2019 & 2032
- Table 40: Germany Dermatological Therapeutics Industry Revenue (Million) Forecast, by Application 2019 & 2032
- Table 41: United Kingdom Dermatological Therapeutics Industry Revenue (Million) Forecast, by Application 2019 & 2032
- Table 42: France Dermatological Therapeutics Industry Revenue (Million) Forecast, by Application 2019 & 2032
- Table 43: Italy Dermatological Therapeutics Industry Revenue (Million) Forecast, by Application 2019 & 2032
- Table 44: Spain Dermatological Therapeutics Industry Revenue (Million) Forecast, by Application 2019 & 2032
- Table 45: Rest of Europe Dermatological Therapeutics Industry Revenue (Million) Forecast, by Application 2019 & 2032
- Table 46: Global Dermatological Therapeutics Industry Revenue Million Forecast, by Application 2019 & 2032
- Table 47: Global Dermatological Therapeutics Industry Revenue Million Forecast, by Drug Class 2019 & 2032
- Table 48: Global Dermatological Therapeutics Industry Revenue Million Forecast, by Country 2019 & 2032
- Table 49: China Dermatological Therapeutics Industry Revenue (Million) Forecast, by Application 2019 & 2032
- Table 50: Japan Dermatological Therapeutics Industry Revenue (Million) Forecast, by Application 2019 & 2032
- Table 51: India Dermatological Therapeutics Industry Revenue (Million) Forecast, by Application 2019 & 2032
- Table 52: Australia Dermatological Therapeutics Industry Revenue (Million) Forecast, by Application 2019 & 2032
- Table 53: South Korea Dermatological Therapeutics Industry Revenue (Million) Forecast, by Application 2019 & 2032
- Table 54: Rest of Asia Pacific Dermatological Therapeutics Industry Revenue (Million) Forecast, by Application 2019 & 2032
- Table 55: Global Dermatological Therapeutics Industry Revenue Million Forecast, by Application 2019 & 2032
- Table 56: Global Dermatological Therapeutics Industry Revenue Million Forecast, by Drug Class 2019 & 2032
- Table 57: Global Dermatological Therapeutics Industry Revenue Million Forecast, by Country 2019 & 2032
- Table 58: GCC Dermatological Therapeutics Industry Revenue (Million) Forecast, by Application 2019 & 2032
- Table 59: South Africa Dermatological Therapeutics Industry Revenue (Million) Forecast, by Application 2019 & 2032
- Table 60: Rest of Middle East and Africa Dermatological Therapeutics Industry Revenue (Million) Forecast, by Application 2019 & 2032
- Table 61: Global Dermatological Therapeutics Industry Revenue Million Forecast, by Application 2019 & 2032
- Table 62: Global Dermatological Therapeutics Industry Revenue Million Forecast, by Drug Class 2019 & 2032
- Table 63: Global Dermatological Therapeutics Industry Revenue Million Forecast, by Country 2019 & 2032
- Table 64: Brazil Dermatological Therapeutics Industry Revenue (Million) Forecast, by Application 2019 & 2032
- Table 65: Argentina Dermatological Therapeutics Industry Revenue (Million) Forecast, by Application 2019 & 2032
- Table 66: Rest of South America Dermatological Therapeutics Industry Revenue (Million) Forecast, by Application 2019 & 2032
Frequently Asked Questions
1. What is the projected Compound Annual Growth Rate (CAGR) of the Dermatological Therapeutics Industry?
The projected CAGR is approximately 9.67%.
2. Which companies are prominent players in the Dermatological Therapeutics Industry?
Key companies in the market include Sun Pharmaceuticals Ltd, Novartis AG, Aurobindo Pharma Ltd*List Not Exhaustive, Amgen Inc, Eli Lilly and Company, Galderma SA, Abbvie Inc (Allergan PLC), Almirall SA, Johnson & Johnson, Bausch Health Companies Inc, LEO Pharma AS, Aclaris Therapeutics Inc, Bristol-Myers Squibb Company, GlaxoSmithKline PLC, Pfizer Inc.
3. What are the main segments of the Dermatological Therapeutics Industry?
The market segments include Application, Drug Class.
4. Can you provide details about the market size?
The market size is estimated to be USD 45.17 Million as of 2022.
5. What are some drivers contributing to market growth?
Growing Burden of Dermatology Diseases; Increasing Awareness Levels of Disease Progression and Etiology; Increasing Elderly Population.
6. What are the notable trends driving market growth?
Psoriasis Segment is Expected to Hold a Significant Market Share Over the Forecast Period.
7. Are there any restraints impacting market growth?
Serious Side Effects for Certain Classes of Therapeutic Drugs.
8. Can you provide examples of recent developments in the market?
In September 2022, the US FDA approved Sotyktu (deucravacitinib), an oral treatment for adults with moderate-to-severe plaque psoriasis who are candidates for systemic therapy or phototherapy.
9. What pricing options are available for accessing the report?
Pricing options include single-user, multi-user, and enterprise licenses priced at USD 4750, USD 5250, and USD 8750 respectively.
10. Is the market size provided in terms of value or volume?
The market size is provided in terms of value, measured in Million.
11. Are there any specific market keywords associated with the report?
Yes, the market keyword associated with the report is "Dermatological Therapeutics Industry," which aids in identifying and referencing the specific market segment covered.
12. How do I determine which pricing option suits my needs best?
The pricing options vary based on user requirements and access needs. Individual users may opt for single-user licenses, while businesses requiring broader access may choose multi-user or enterprise licenses for cost-effective access to the report.
13. Are there any additional resources or data provided in the Dermatological Therapeutics Industry report?
While the report offers comprehensive insights, it's advisable to review the specific contents or supplementary materials provided to ascertain if additional resources or data are available.
14. How can I stay updated on further developments or reports in the Dermatological Therapeutics Industry?
To stay informed about further developments, trends, and reports in the Dermatological Therapeutics Industry, consider subscribing to industry newsletters, following relevant companies and organizations, or regularly checking reputable industry news sources and publications.
Methodology
Step 1 - Identification of Relevant Samples Size from Population Database


Step 2 - Approaches for Defining Global Market Size (Value, Volume* & Price*)

Note*: In applicable scenarios
Step 3 - Data Sources
Primary Research
- Web Analytics
- Survey Reports
- Research Institute
- Latest Research Reports
- Opinion Leaders
Secondary Research
- Annual Reports
- White Paper
- Latest Press Release
- Industry Association
- Paid Database
- Investor Presentations

Step 4 - Data Triangulation
Involves using different sources of information in order to increase the validity of a study
These sources are likely to be stakeholders in a program - participants, other researchers, program staff, other community members, and so on.
Then we put all data in single framework & apply various statistical tools to find out the dynamic on the market.
During the analysis stage, feedback from the stakeholder groups would be compared to determine areas of agreement as well as areas of divergence


