
Key Insights
The global dental digital radiography systems market, valued at $3.86 billion in 2025, is projected to experience robust growth, driven by several key factors. The increasing adoption of digital radiography in dental practices is fueled by its superior image quality, enhanced diagnostic capabilities, reduced radiation exposure for both patients and practitioners, and streamlined workflow efficiencies. Technological advancements, such as the development of more sophisticated sensors and software with advanced image processing capabilities, further contribute to market expansion. The rising prevalence of dental diseases globally, coupled with the growing geriatric population requiring more frequent dental check-ups, creates significant demand. Furthermore, the integration of digital radiography systems with practice management software improves operational efficiency and enhances patient care coordination. This trend is particularly pronounced in developed regions like North America and Europe, where technological adoption is high. However, high initial investment costs associated with digital radiography systems and the need for ongoing training and maintenance can pose challenges, especially in smaller dental practices or developing economies. The market is segmented by technology (analog vs. digital systems), procedure type (intraoral, occlusal, extraoral), and geography, with digital systems dominating the technology segment. Competition is fierce, with established players like Planmeca Oy, Vatech, and Dentsply Sirona competing against emerging innovative companies.
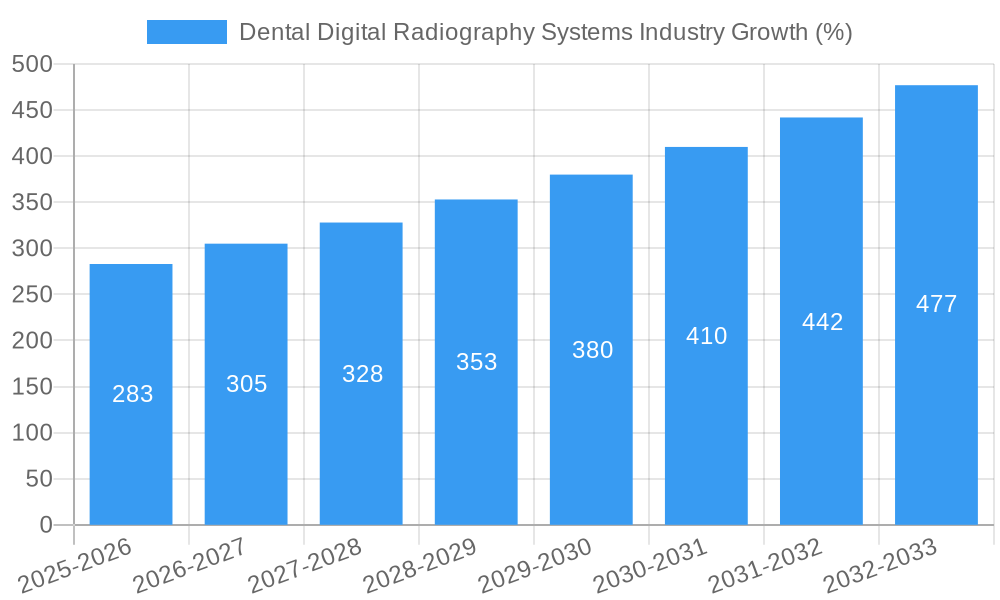
The forecast period (2025-2033) anticipates a continuation of this growth trajectory, albeit at a potentially moderating pace. The 7.34% CAGR suggests a consistent, albeit not explosive, expansion. This moderation could be attributed to market saturation in some developed regions and the need for ongoing technological upgrades. Nonetheless, the long-term outlook remains positive, driven by the continued advancements in digital imaging technologies, increasing awareness of the benefits of digital radiography, and expanding dental care infrastructure globally, particularly in developing nations. The market's evolution will likely involve further integration with artificial intelligence (AI) for improved diagnostics and automation of processes. Companies will need to focus on delivering cost-effective solutions and providing comprehensive training and support to maintain market competitiveness and sustain the growth momentum.
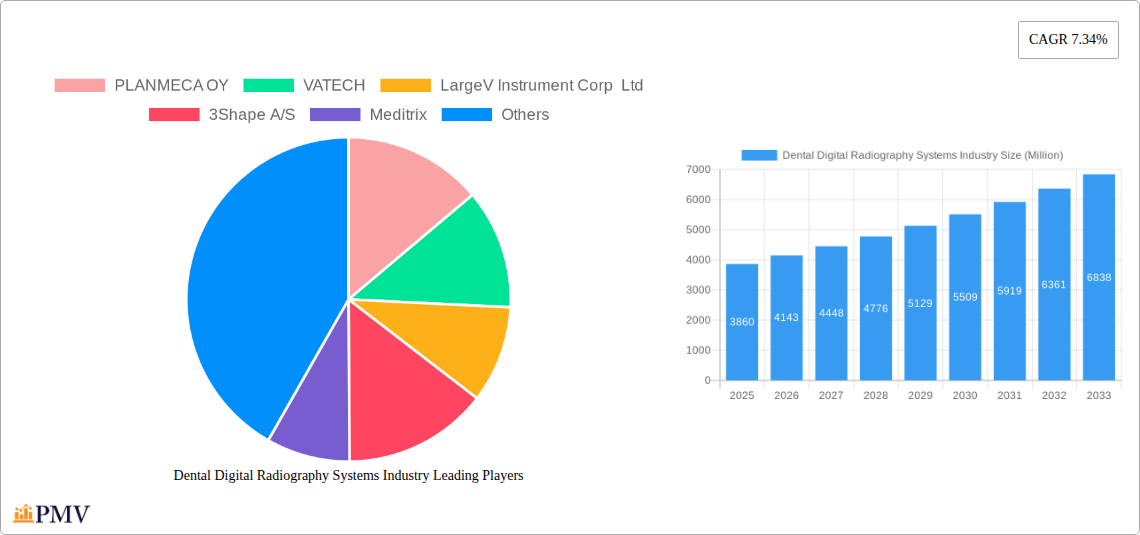
Dental Digital Radiography Systems Industry Market Report: 2019-2033
This comprehensive report provides a detailed analysis of the global Dental Digital Radiography Systems market, offering invaluable insights for stakeholders across the industry. The study period covers 2019-2033, with 2025 serving as the base and estimated year. The report forecasts market trends from 2025 to 2033, utilizing data from the historical period of 2019-2024. The market is segmented by technology (Analog X-ray Systems, Digital X-ray Systems) and procedure type (Intraoral X-rays, Occlusal X-rays, Extraoral X-rays). Key players analyzed include PLANMECA OY, VATECH, LargeV Instrument Corp Ltd, 3Shape A/S, Meditrix, Dentsply Sirona, IATOME ELECTRIC, ACTEON, Carestream Dental LLC, Air Techniques Inc, THE YOSHIDA DENTAL MFG CO LTD, and ASAHIROENTGEN IND CO LTD. The total market size is estimated at xx Million in 2025 and is projected to reach xx Million by 2033.
Dental Digital Radiography Systems Industry Market Structure & Competitive Dynamics
The dental digital radiography systems market exhibits a moderately concentrated structure, with several major players holding significant market share. The competitive landscape is characterized by intense rivalry driven by technological innovation, product differentiation, and strategic partnerships. Market share data for 2025 suggests Dentsply Sirona holds approximately 20% of the market, followed by PLANMECA OY with 15%, and VATECH with 12%. The remaining share is distributed among other players. Innovation ecosystems are dynamic, with ongoing research and development efforts focusing on AI integration, image enhancement, and system portability. Regulatory frameworks vary across regions, influencing product approvals and market access. The primary substitute for digital radiography remains analog systems, though their market share is declining rapidly. End-user trends favor digital systems due to improved image quality, reduced radiation exposure, and enhanced workflow efficiency. M&A activities have been moderate, with deal values in the range of xx Million annually in the recent past, primarily focusing on smaller companies specializing in specific technologies. For instance, a recent acquisition involved the consolidation of two software companies, resulting in xx Million deal closure.
Dental Digital Radiography Systems Industry Industry Trends & Insights
The global dental digital radiography systems market is experiencing robust growth, driven by several key factors. Technological advancements, such as the integration of artificial intelligence (AI) for image analysis and diagnostics, are significantly impacting the market. The rising adoption of digital technologies in dental practices, coupled with increasing awareness of the benefits of reduced radiation exposure, fuels market expansion. Consumer preferences are shifting towards digital systems, particularly among younger dentists and those prioritizing patient comfort and efficiency. The market is also experiencing consolidation, with larger players strategically acquiring smaller companies to expand their product portfolios and market reach. The overall Compound Annual Growth Rate (CAGR) is estimated at 8% from 2025-2033. Market penetration of digital systems has risen from 55% in 2019 to 75% in 2024, with substantial room for further growth. Competitive dynamics are shaping the market, with companies focusing on innovative product features, enhanced user interfaces, and improved after-sales services to gain a competitive edge.
Dominant Markets & Segments in Dental Digital Radiography Systems Industry
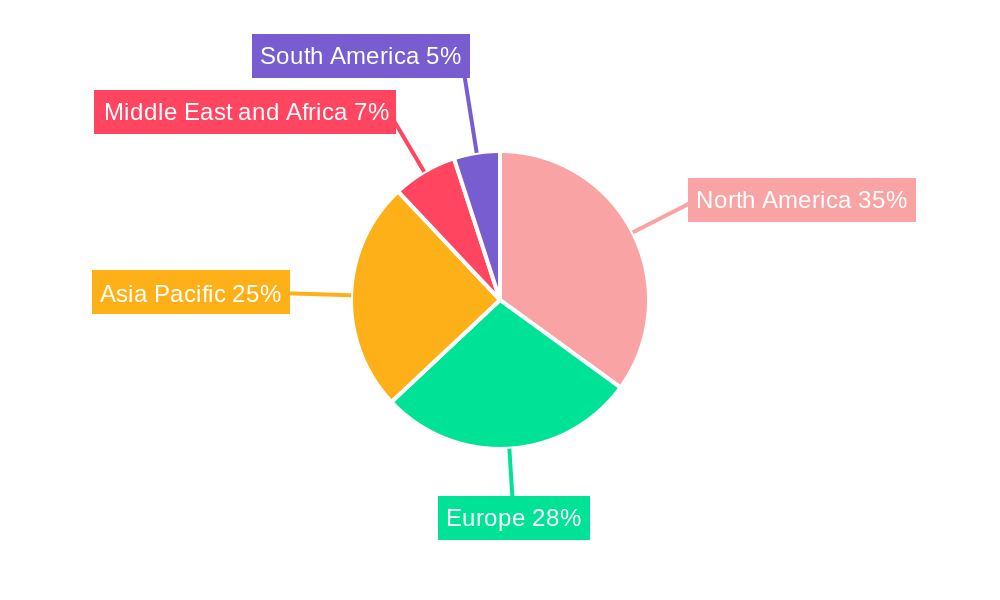
The North American region currently dominates the dental digital radiography systems market, driven by high adoption rates in the US and Canada. This dominance stems from factors including strong healthcare infrastructure, high disposable incomes, and advanced dental practices.
- Key Drivers in North America:
- Robust healthcare infrastructure and funding
- High adoption rate among dental professionals
- Favorable regulatory environment
- Well-established distribution networks
Within technology segments, Digital X-ray Systems are experiencing significantly higher growth compared to Analog X-ray Systems, driven by superior image quality, efficiency, and reduced radiation exposure. Intraoral X-rays represent the largest segment by procedure type, due to their widespread use in routine dental examinations.
Dental Digital Radiography Systems Industry Product Innovations
Recent innovations in dental digital radiography systems focus on improving image quality, reducing radiation exposure, and enhancing workflow efficiency. AI-powered image analysis tools are becoming increasingly integrated, offering automated detection of dental pathologies and streamlining diagnostic processes. Portable and wireless systems are gaining popularity, increasing flexibility and convenience for dental professionals. The market is also witnessing the development of innovative sensor technologies, leading to faster image acquisition and improved image clarity. These advancements are enhancing the overall market competitiveness and patient care.
Report Segmentation & Scope
This report segments the dental digital radiography systems market based on technology and procedure type:
Technology: Analog X-ray Systems (xx Million in 2025, with a CAGR of -5% from 2025-2033, experiencing declining market share due to the dominance of digital systems.) and Digital X-ray Systems (xx Million in 2025, with a CAGR of 9% from 2025-2033, capturing a dominant share of the market). Competitive dynamics within this segment are primarily focused on technological differentiation and cost optimization.
Procedure Type: Intraoral X-rays (xx Million in 2025, with a CAGR of 8% from 2025-2033, dominating the market due to high usage in routine examinations). Occlusal X-rays (xx Million in 2025, with a CAGR of 7% from 2025-2033, occupying a smaller but steadily growing segment). Extraoral X-rays (xx Million in 2025, with a CAGR of 7% from 2025-2033, showing consistent growth due to applications in complex procedures). Competition is influenced by factors like image quality, spatial resolution, and ease of use.
Key Drivers of Dental Digital Radiography Systems Industry Growth
Several factors contribute to the growth of the dental digital radiography systems market. Technological advancements, particularly in AI-powered image analysis and sensor technologies, are key drivers. Growing awareness among dental professionals and patients regarding reduced radiation exposure is another critical factor. Furthermore, favorable regulatory environments in various regions, along with increasing investments in dental infrastructure, support market expansion. Lastly, the rising adoption of digital technologies within the healthcare sector further fuels the growth of this market.
Challenges in the Dental Digital Radiography Systems Industry Sector
The dental digital radiography systems market faces certain challenges, including the high initial investment costs associated with adopting digital systems, which can be a barrier for smaller dental practices. Variations in regulatory frameworks across different regions create complexities in product approvals and market access. Supply chain disruptions and fluctuations in raw material prices can also impact production costs and market stability. Finally, increasing competition and the need for continuous innovation to stay ahead of the curve put pressure on the margins of industry participants.
Leading Players in the Dental Digital Radiography Systems Industry Market
- PLANMECA OY
- VATECH
- LargeV Instrument Corp Ltd
- 3Shape A/S
- Meditrix
- Dentsply Sirona
- IATOME ELECTRIC
- ACTEON
- Carestream Dental LLC
- Air Techniques Inc
- THE YOSHIDA DENTAL MFG CO LTD
- ASAHIROENTGEN IND CO LTD
Key Developments in Dental Digital Radiography Systems Industry Sector
- February 2022: Overjet secured a United States Patent for its AI technology that measures anatomical structures and quantifies disease on dental X-rays, significantly impacting diagnostic capabilities and market competition.
- April 2021: Carestream Dental launched the CS 2400P, a portable X-ray generator, enhancing mobility and flexibility for dental professionals.
Strategic Dental Digital Radiography Systems Industry Market Outlook
The future of the dental digital radiography systems market looks promising, with continued growth driven by technological advancements, increased adoption rates, and expanding applications. Strategic opportunities exist for companies focusing on AI-driven diagnostics, improved user interfaces, and enhanced system integration. The market will continue to see consolidation as larger players acquire smaller companies to broaden their product portfolios and increase their market share. Focus on cost-effectiveness and improved workflow efficiency will be key success factors in the coming years.
Dental Digital Radiography Systems Industry Segmentation
-
1. Technology
- 1.1. Analog X-ray Systems
- 1.2. Digital X-ray Systems
-
2. Procedure Type
-
2.1. Intraoral X-rays
- 2.1.1. Bite-wing X-rays
- 2.1.2. Periapical X-rays
- 2.1.3. Occlusal X-rays
-
2.2. Extraoral X-rays
- 2.2.1. Panoramic X-rays
- 2.2.2. Dental Computed Tomography
- 2.2.3. Cephalometric Projections
- 2.2.4. Other Extraoral X-rays
-
2.1. Intraoral X-rays
Dental Digital Radiography Systems Industry Segmentation By Geography
-
1. North America
- 1.1. United States
- 1.2. Canada
- 1.3. Mexico
-
2. Europe
- 2.1. Germany
- 2.2. United Kingdom
- 2.3. France
- 2.4. Italy
- 2.5. Spain
- 2.6. Rest of Europe
-
3. Asia Pacific
- 3.1. China
- 3.2. Japan
- 3.3. India
- 3.4. Australia
- 3.5. South Korea
- 3.6. Rest of Asia Pacific
-
4. Middle East and Africa
- 4.1. GCC
- 4.2. South Africa
- 4.3. Rest of Middle East and Africa
-
5. South America
- 5.1. Brazil
- 5.2. Argentina
- 5.3. Rest of South America
Dental Digital Radiography Systems Industry REPORT HIGHLIGHTS
| Aspects | Details |
|---|---|
| Study Period | 2019-2033 |
| Base Year | 2024 |
| Estimated Year | 2025 |
| Forecast Period | 2025-2033 |
| Historical Period | 2019-2024 |
| Growth Rate | CAGR of 7.34% from 2019-2033 |
| Segmentation |
|
Table of Contents
- 1. Introduction
- 1.1. Research Scope
- 1.2. Market Segmentation
- 1.3. Research Methodology
- 1.4. Definitions and Assumptions
- 2. Executive Summary
- 2.1. Introduction
- 3. Market Dynamics
- 3.1. Introduction
- 3.2. Market Drivers
- 3.2.1. Increasing Burden of Dental Diseases; Technological Advancements in Dental Imaging Methodologies; Increasing Demand for Cosmetic Dentistry
- 3.3. Market Restrains
- 3.3.1. High Cost of Dental Radiography Systems
- 3.4. Market Trends
- 3.4.1. Digital X-ray Systems Segment is Expected to Hold a Major Market Share in the Dental X-Ray Systems Market During the Forecast Period
- 4. Market Factor Analysis
- 4.1. Porters Five Forces
- 4.2. Supply/Value Chain
- 4.3. PESTEL analysis
- 4.4. Market Entropy
- 4.5. Patent/Trademark Analysis
- 5. Global Dental Digital Radiography Systems Industry Analysis, Insights and Forecast, 2019-2031
- 5.1. Market Analysis, Insights and Forecast - by Technology
- 5.1.1. Analog X-ray Systems
- 5.1.2. Digital X-ray Systems
- 5.2. Market Analysis, Insights and Forecast - by Procedure Type
- 5.2.1. Intraoral X-rays
- 5.2.1.1. Bite-wing X-rays
- 5.2.1.2. Periapical X-rays
- 5.2.1.3. Occlusal X-rays
- 5.2.2. Extraoral X-rays
- 5.2.2.1. Panoramic X-rays
- 5.2.2.2. Dental Computed Tomography
- 5.2.2.3. Cephalometric Projections
- 5.2.2.4. Other Extraoral X-rays
- 5.2.1. Intraoral X-rays
- 5.3. Market Analysis, Insights and Forecast - by Region
- 5.3.1. North America
- 5.3.2. Europe
- 5.3.3. Asia Pacific
- 5.3.4. Middle East and Africa
- 5.3.5. South America
- 5.1. Market Analysis, Insights and Forecast - by Technology
- 6. North America Dental Digital Radiography Systems Industry Analysis, Insights and Forecast, 2019-2031
- 6.1. Market Analysis, Insights and Forecast - by Technology
- 6.1.1. Analog X-ray Systems
- 6.1.2. Digital X-ray Systems
- 6.2. Market Analysis, Insights and Forecast - by Procedure Type
- 6.2.1. Intraoral X-rays
- 6.2.1.1. Bite-wing X-rays
- 6.2.1.2. Periapical X-rays
- 6.2.1.3. Occlusal X-rays
- 6.2.2. Extraoral X-rays
- 6.2.2.1. Panoramic X-rays
- 6.2.2.2. Dental Computed Tomography
- 6.2.2.3. Cephalometric Projections
- 6.2.2.4. Other Extraoral X-rays
- 6.2.1. Intraoral X-rays
- 6.1. Market Analysis, Insights and Forecast - by Technology
- 7. Europe Dental Digital Radiography Systems Industry Analysis, Insights and Forecast, 2019-2031
- 7.1. Market Analysis, Insights and Forecast - by Technology
- 7.1.1. Analog X-ray Systems
- 7.1.2. Digital X-ray Systems
- 7.2. Market Analysis, Insights and Forecast - by Procedure Type
- 7.2.1. Intraoral X-rays
- 7.2.1.1. Bite-wing X-rays
- 7.2.1.2. Periapical X-rays
- 7.2.1.3. Occlusal X-rays
- 7.2.2. Extraoral X-rays
- 7.2.2.1. Panoramic X-rays
- 7.2.2.2. Dental Computed Tomography
- 7.2.2.3. Cephalometric Projections
- 7.2.2.4. Other Extraoral X-rays
- 7.2.1. Intraoral X-rays
- 7.1. Market Analysis, Insights and Forecast - by Technology
- 8. Asia Pacific Dental Digital Radiography Systems Industry Analysis, Insights and Forecast, 2019-2031
- 8.1. Market Analysis, Insights and Forecast - by Technology
- 8.1.1. Analog X-ray Systems
- 8.1.2. Digital X-ray Systems
- 8.2. Market Analysis, Insights and Forecast - by Procedure Type
- 8.2.1. Intraoral X-rays
- 8.2.1.1. Bite-wing X-rays
- 8.2.1.2. Periapical X-rays
- 8.2.1.3. Occlusal X-rays
- 8.2.2. Extraoral X-rays
- 8.2.2.1. Panoramic X-rays
- 8.2.2.2. Dental Computed Tomography
- 8.2.2.3. Cephalometric Projections
- 8.2.2.4. Other Extraoral X-rays
- 8.2.1. Intraoral X-rays
- 8.1. Market Analysis, Insights and Forecast - by Technology
- 9. Middle East and Africa Dental Digital Radiography Systems Industry Analysis, Insights and Forecast, 2019-2031
- 9.1. Market Analysis, Insights and Forecast - by Technology
- 9.1.1. Analog X-ray Systems
- 9.1.2. Digital X-ray Systems
- 9.2. Market Analysis, Insights and Forecast - by Procedure Type
- 9.2.1. Intraoral X-rays
- 9.2.1.1. Bite-wing X-rays
- 9.2.1.2. Periapical X-rays
- 9.2.1.3. Occlusal X-rays
- 9.2.2. Extraoral X-rays
- 9.2.2.1. Panoramic X-rays
- 9.2.2.2. Dental Computed Tomography
- 9.2.2.3. Cephalometric Projections
- 9.2.2.4. Other Extraoral X-rays
- 9.2.1. Intraoral X-rays
- 9.1. Market Analysis, Insights and Forecast - by Technology
- 10. South America Dental Digital Radiography Systems Industry Analysis, Insights and Forecast, 2019-2031
- 10.1. Market Analysis, Insights and Forecast - by Technology
- 10.1.1. Analog X-ray Systems
- 10.1.2. Digital X-ray Systems
- 10.2. Market Analysis, Insights and Forecast - by Procedure Type
- 10.2.1. Intraoral X-rays
- 10.2.1.1. Bite-wing X-rays
- 10.2.1.2. Periapical X-rays
- 10.2.1.3. Occlusal X-rays
- 10.2.2. Extraoral X-rays
- 10.2.2.1. Panoramic X-rays
- 10.2.2.2. Dental Computed Tomography
- 10.2.2.3. Cephalometric Projections
- 10.2.2.4. Other Extraoral X-rays
- 10.2.1. Intraoral X-rays
- 10.1. Market Analysis, Insights and Forecast - by Technology
- 11. North America Dental Digital Radiography Systems Industry Analysis, Insights and Forecast, 2019-2031
- 11.1. Market Analysis, Insights and Forecast - By Country/Sub-region
- 11.1.1 United States
- 11.1.2 Canada
- 11.1.3 Mexico
- 12. Europe Dental Digital Radiography Systems Industry Analysis, Insights and Forecast, 2019-2031
- 12.1. Market Analysis, Insights and Forecast - By Country/Sub-region
- 12.1.1 Germany
- 12.1.2 United Kingdom
- 12.1.3 France
- 12.1.4 Italy
- 12.1.5 Spain
- 12.1.6 Rest of Europe
- 13. Asia Pacific Dental Digital Radiography Systems Industry Analysis, Insights and Forecast, 2019-2031
- 13.1. Market Analysis, Insights and Forecast - By Country/Sub-region
- 13.1.1 China
- 13.1.2 Japan
- 13.1.3 India
- 13.1.4 Australia
- 13.1.5 South Korea
- 13.1.6 Rest of Asia Pacific
- 14. Middle East and Africa Dental Digital Radiography Systems Industry Analysis, Insights and Forecast, 2019-2031
- 14.1. Market Analysis, Insights and Forecast - By Country/Sub-region
- 14.1.1 GCC
- 14.1.2 South Africa
- 14.1.3 Rest of Middle East and Africa
- 15. South America Dental Digital Radiography Systems Industry Analysis, Insights and Forecast, 2019-2031
- 15.1. Market Analysis, Insights and Forecast - By Country/Sub-region
- 15.1.1 Brazil
- 15.1.2 Argentina
- 15.1.3 Rest of South America
- 16. Competitive Analysis
- 16.1. Global Market Share Analysis 2024
- 16.2. Company Profiles
- 16.2.1 PLANMECA OY
- 16.2.1.1. Overview
- 16.2.1.2. Products
- 16.2.1.3. SWOT Analysis
- 16.2.1.4. Recent Developments
- 16.2.1.5. Financials (Based on Availability)
- 16.2.2 VATECH
- 16.2.2.1. Overview
- 16.2.2.2. Products
- 16.2.2.3. SWOT Analysis
- 16.2.2.4. Recent Developments
- 16.2.2.5. Financials (Based on Availability)
- 16.2.3 LargeV Instrument Corp Ltd
- 16.2.3.1. Overview
- 16.2.3.2. Products
- 16.2.3.3. SWOT Analysis
- 16.2.3.4. Recent Developments
- 16.2.3.5. Financials (Based on Availability)
- 16.2.4 3Shape A/S
- 16.2.4.1. Overview
- 16.2.4.2. Products
- 16.2.4.3. SWOT Analysis
- 16.2.4.4. Recent Developments
- 16.2.4.5. Financials (Based on Availability)
- 16.2.5 Meditrix
- 16.2.5.1. Overview
- 16.2.5.2. Products
- 16.2.5.3. SWOT Analysis
- 16.2.5.4. Recent Developments
- 16.2.5.5. Financials (Based on Availability)
- 16.2.6 Dentsply Sirona
- 16.2.6.1. Overview
- 16.2.6.2. Products
- 16.2.6.3. SWOT Analysis
- 16.2.6.4. Recent Developments
- 16.2.6.5. Financials (Based on Availability)
- 16.2.7 IATOME ELECTRIC
- 16.2.7.1. Overview
- 16.2.7.2. Products
- 16.2.7.3. SWOT Analysis
- 16.2.7.4. Recent Developments
- 16.2.7.5. Financials (Based on Availability)
- 16.2.8 ACTEON
- 16.2.8.1. Overview
- 16.2.8.2. Products
- 16.2.8.3. SWOT Analysis
- 16.2.8.4. Recent Developments
- 16.2.8.5. Financials (Based on Availability)
- 16.2.9 Carestream Dental LLC
- 16.2.9.1. Overview
- 16.2.9.2. Products
- 16.2.9.3. SWOT Analysis
- 16.2.9.4. Recent Developments
- 16.2.9.5. Financials (Based on Availability)
- 16.2.10 Air Techniques Inc
- 16.2.10.1. Overview
- 16.2.10.2. Products
- 16.2.10.3. SWOT Analysis
- 16.2.10.4. Recent Developments
- 16.2.10.5. Financials (Based on Availability)
- 16.2.11 THE YOSHIDA DENTAL MFG CO LTD
- 16.2.11.1. Overview
- 16.2.11.2. Products
- 16.2.11.3. SWOT Analysis
- 16.2.11.4. Recent Developments
- 16.2.11.5. Financials (Based on Availability)
- 16.2.12 ASAHIROENTGEN IND CO LTD
- 16.2.12.1. Overview
- 16.2.12.2. Products
- 16.2.12.3. SWOT Analysis
- 16.2.12.4. Recent Developments
- 16.2.12.5. Financials (Based on Availability)
- 16.2.1 PLANMECA OY
List of Figures
- Figure 1: Global Dental Digital Radiography Systems Industry Revenue Breakdown (Million, %) by Region 2024 & 2032
- Figure 2: Global Dental Digital Radiography Systems Industry Volume Breakdown (K Unit, %) by Region 2024 & 2032
- Figure 3: North America Dental Digital Radiography Systems Industry Revenue (Million), by Country 2024 & 2032
- Figure 4: North America Dental Digital Radiography Systems Industry Volume (K Unit), by Country 2024 & 2032
- Figure 5: North America Dental Digital Radiography Systems Industry Revenue Share (%), by Country 2024 & 2032
- Figure 6: North America Dental Digital Radiography Systems Industry Volume Share (%), by Country 2024 & 2032
- Figure 7: Europe Dental Digital Radiography Systems Industry Revenue (Million), by Country 2024 & 2032
- Figure 8: Europe Dental Digital Radiography Systems Industry Volume (K Unit), by Country 2024 & 2032
- Figure 9: Europe Dental Digital Radiography Systems Industry Revenue Share (%), by Country 2024 & 2032
- Figure 10: Europe Dental Digital Radiography Systems Industry Volume Share (%), by Country 2024 & 2032
- Figure 11: Asia Pacific Dental Digital Radiography Systems Industry Revenue (Million), by Country 2024 & 2032
- Figure 12: Asia Pacific Dental Digital Radiography Systems Industry Volume (K Unit), by Country 2024 & 2032
- Figure 13: Asia Pacific Dental Digital Radiography Systems Industry Revenue Share (%), by Country 2024 & 2032
- Figure 14: Asia Pacific Dental Digital Radiography Systems Industry Volume Share (%), by Country 2024 & 2032
- Figure 15: Middle East and Africa Dental Digital Radiography Systems Industry Revenue (Million), by Country 2024 & 2032
- Figure 16: Middle East and Africa Dental Digital Radiography Systems Industry Volume (K Unit), by Country 2024 & 2032
- Figure 17: Middle East and Africa Dental Digital Radiography Systems Industry Revenue Share (%), by Country 2024 & 2032
- Figure 18: Middle East and Africa Dental Digital Radiography Systems Industry Volume Share (%), by Country 2024 & 2032
- Figure 19: South America Dental Digital Radiography Systems Industry Revenue (Million), by Country 2024 & 2032
- Figure 20: South America Dental Digital Radiography Systems Industry Volume (K Unit), by Country 2024 & 2032
- Figure 21: South America Dental Digital Radiography Systems Industry Revenue Share (%), by Country 2024 & 2032
- Figure 22: South America Dental Digital Radiography Systems Industry Volume Share (%), by Country 2024 & 2032
- Figure 23: North America Dental Digital Radiography Systems Industry Revenue (Million), by Technology 2024 & 2032
- Figure 24: North America Dental Digital Radiography Systems Industry Volume (K Unit), by Technology 2024 & 2032
- Figure 25: North America Dental Digital Radiography Systems Industry Revenue Share (%), by Technology 2024 & 2032
- Figure 26: North America Dental Digital Radiography Systems Industry Volume Share (%), by Technology 2024 & 2032
- Figure 27: North America Dental Digital Radiography Systems Industry Revenue (Million), by Procedure Type 2024 & 2032
- Figure 28: North America Dental Digital Radiography Systems Industry Volume (K Unit), by Procedure Type 2024 & 2032
- Figure 29: North America Dental Digital Radiography Systems Industry Revenue Share (%), by Procedure Type 2024 & 2032
- Figure 30: North America Dental Digital Radiography Systems Industry Volume Share (%), by Procedure Type 2024 & 2032
- Figure 31: North America Dental Digital Radiography Systems Industry Revenue (Million), by Country 2024 & 2032
- Figure 32: North America Dental Digital Radiography Systems Industry Volume (K Unit), by Country 2024 & 2032
- Figure 33: North America Dental Digital Radiography Systems Industry Revenue Share (%), by Country 2024 & 2032
- Figure 34: North America Dental Digital Radiography Systems Industry Volume Share (%), by Country 2024 & 2032
- Figure 35: Europe Dental Digital Radiography Systems Industry Revenue (Million), by Technology 2024 & 2032
- Figure 36: Europe Dental Digital Radiography Systems Industry Volume (K Unit), by Technology 2024 & 2032
- Figure 37: Europe Dental Digital Radiography Systems Industry Revenue Share (%), by Technology 2024 & 2032
- Figure 38: Europe Dental Digital Radiography Systems Industry Volume Share (%), by Technology 2024 & 2032
- Figure 39: Europe Dental Digital Radiography Systems Industry Revenue (Million), by Procedure Type 2024 & 2032
- Figure 40: Europe Dental Digital Radiography Systems Industry Volume (K Unit), by Procedure Type 2024 & 2032
- Figure 41: Europe Dental Digital Radiography Systems Industry Revenue Share (%), by Procedure Type 2024 & 2032
- Figure 42: Europe Dental Digital Radiography Systems Industry Volume Share (%), by Procedure Type 2024 & 2032
- Figure 43: Europe Dental Digital Radiography Systems Industry Revenue (Million), by Country 2024 & 2032
- Figure 44: Europe Dental Digital Radiography Systems Industry Volume (K Unit), by Country 2024 & 2032
- Figure 45: Europe Dental Digital Radiography Systems Industry Revenue Share (%), by Country 2024 & 2032
- Figure 46: Europe Dental Digital Radiography Systems Industry Volume Share (%), by Country 2024 & 2032
- Figure 47: Asia Pacific Dental Digital Radiography Systems Industry Revenue (Million), by Technology 2024 & 2032
- Figure 48: Asia Pacific Dental Digital Radiography Systems Industry Volume (K Unit), by Technology 2024 & 2032
- Figure 49: Asia Pacific Dental Digital Radiography Systems Industry Revenue Share (%), by Technology 2024 & 2032
- Figure 50: Asia Pacific Dental Digital Radiography Systems Industry Volume Share (%), by Technology 2024 & 2032
- Figure 51: Asia Pacific Dental Digital Radiography Systems Industry Revenue (Million), by Procedure Type 2024 & 2032
- Figure 52: Asia Pacific Dental Digital Radiography Systems Industry Volume (K Unit), by Procedure Type 2024 & 2032
- Figure 53: Asia Pacific Dental Digital Radiography Systems Industry Revenue Share (%), by Procedure Type 2024 & 2032
- Figure 54: Asia Pacific Dental Digital Radiography Systems Industry Volume Share (%), by Procedure Type 2024 & 2032
- Figure 55: Asia Pacific Dental Digital Radiography Systems Industry Revenue (Million), by Country 2024 & 2032
- Figure 56: Asia Pacific Dental Digital Radiography Systems Industry Volume (K Unit), by Country 2024 & 2032
- Figure 57: Asia Pacific Dental Digital Radiography Systems Industry Revenue Share (%), by Country 2024 & 2032
- Figure 58: Asia Pacific Dental Digital Radiography Systems Industry Volume Share (%), by Country 2024 & 2032
- Figure 59: Middle East and Africa Dental Digital Radiography Systems Industry Revenue (Million), by Technology 2024 & 2032
- Figure 60: Middle East and Africa Dental Digital Radiography Systems Industry Volume (K Unit), by Technology 2024 & 2032
- Figure 61: Middle East and Africa Dental Digital Radiography Systems Industry Revenue Share (%), by Technology 2024 & 2032
- Figure 62: Middle East and Africa Dental Digital Radiography Systems Industry Volume Share (%), by Technology 2024 & 2032
- Figure 63: Middle East and Africa Dental Digital Radiography Systems Industry Revenue (Million), by Procedure Type 2024 & 2032
- Figure 64: Middle East and Africa Dental Digital Radiography Systems Industry Volume (K Unit), by Procedure Type 2024 & 2032
- Figure 65: Middle East and Africa Dental Digital Radiography Systems Industry Revenue Share (%), by Procedure Type 2024 & 2032
- Figure 66: Middle East and Africa Dental Digital Radiography Systems Industry Volume Share (%), by Procedure Type 2024 & 2032
- Figure 67: Middle East and Africa Dental Digital Radiography Systems Industry Revenue (Million), by Country 2024 & 2032
- Figure 68: Middle East and Africa Dental Digital Radiography Systems Industry Volume (K Unit), by Country 2024 & 2032
- Figure 69: Middle East and Africa Dental Digital Radiography Systems Industry Revenue Share (%), by Country 2024 & 2032
- Figure 70: Middle East and Africa Dental Digital Radiography Systems Industry Volume Share (%), by Country 2024 & 2032
- Figure 71: South America Dental Digital Radiography Systems Industry Revenue (Million), by Technology 2024 & 2032
- Figure 72: South America Dental Digital Radiography Systems Industry Volume (K Unit), by Technology 2024 & 2032
- Figure 73: South America Dental Digital Radiography Systems Industry Revenue Share (%), by Technology 2024 & 2032
- Figure 74: South America Dental Digital Radiography Systems Industry Volume Share (%), by Technology 2024 & 2032
- Figure 75: South America Dental Digital Radiography Systems Industry Revenue (Million), by Procedure Type 2024 & 2032
- Figure 76: South America Dental Digital Radiography Systems Industry Volume (K Unit), by Procedure Type 2024 & 2032
- Figure 77: South America Dental Digital Radiography Systems Industry Revenue Share (%), by Procedure Type 2024 & 2032
- Figure 78: South America Dental Digital Radiography Systems Industry Volume Share (%), by Procedure Type 2024 & 2032
- Figure 79: South America Dental Digital Radiography Systems Industry Revenue (Million), by Country 2024 & 2032
- Figure 80: South America Dental Digital Radiography Systems Industry Volume (K Unit), by Country 2024 & 2032
- Figure 81: South America Dental Digital Radiography Systems Industry Revenue Share (%), by Country 2024 & 2032
- Figure 82: South America Dental Digital Radiography Systems Industry Volume Share (%), by Country 2024 & 2032
List of Tables
- Table 1: Global Dental Digital Radiography Systems Industry Revenue Million Forecast, by Region 2019 & 2032
- Table 2: Global Dental Digital Radiography Systems Industry Volume K Unit Forecast, by Region 2019 & 2032
- Table 3: Global Dental Digital Radiography Systems Industry Revenue Million Forecast, by Technology 2019 & 2032
- Table 4: Global Dental Digital Radiography Systems Industry Volume K Unit Forecast, by Technology 2019 & 2032
- Table 5: Global Dental Digital Radiography Systems Industry Revenue Million Forecast, by Procedure Type 2019 & 2032
- Table 6: Global Dental Digital Radiography Systems Industry Volume K Unit Forecast, by Procedure Type 2019 & 2032
- Table 7: Global Dental Digital Radiography Systems Industry Revenue Million Forecast, by Region 2019 & 2032
- Table 8: Global Dental Digital Radiography Systems Industry Volume K Unit Forecast, by Region 2019 & 2032
- Table 9: Global Dental Digital Radiography Systems Industry Revenue Million Forecast, by Country 2019 & 2032
- Table 10: Global Dental Digital Radiography Systems Industry Volume K Unit Forecast, by Country 2019 & 2032
- Table 11: United States Dental Digital Radiography Systems Industry Revenue (Million) Forecast, by Application 2019 & 2032
- Table 12: United States Dental Digital Radiography Systems Industry Volume (K Unit) Forecast, by Application 2019 & 2032
- Table 13: Canada Dental Digital Radiography Systems Industry Revenue (Million) Forecast, by Application 2019 & 2032
- Table 14: Canada Dental Digital Radiography Systems Industry Volume (K Unit) Forecast, by Application 2019 & 2032
- Table 15: Mexico Dental Digital Radiography Systems Industry Revenue (Million) Forecast, by Application 2019 & 2032
- Table 16: Mexico Dental Digital Radiography Systems Industry Volume (K Unit) Forecast, by Application 2019 & 2032
- Table 17: Global Dental Digital Radiography Systems Industry Revenue Million Forecast, by Country 2019 & 2032
- Table 18: Global Dental Digital Radiography Systems Industry Volume K Unit Forecast, by Country 2019 & 2032
- Table 19: Germany Dental Digital Radiography Systems Industry Revenue (Million) Forecast, by Application 2019 & 2032
- Table 20: Germany Dental Digital Radiography Systems Industry Volume (K Unit) Forecast, by Application 2019 & 2032
- Table 21: United Kingdom Dental Digital Radiography Systems Industry Revenue (Million) Forecast, by Application 2019 & 2032
- Table 22: United Kingdom Dental Digital Radiography Systems Industry Volume (K Unit) Forecast, by Application 2019 & 2032
- Table 23: France Dental Digital Radiography Systems Industry Revenue (Million) Forecast, by Application 2019 & 2032
- Table 24: France Dental Digital Radiography Systems Industry Volume (K Unit) Forecast, by Application 2019 & 2032
- Table 25: Italy Dental Digital Radiography Systems Industry Revenue (Million) Forecast, by Application 2019 & 2032
- Table 26: Italy Dental Digital Radiography Systems Industry Volume (K Unit) Forecast, by Application 2019 & 2032
- Table 27: Spain Dental Digital Radiography Systems Industry Revenue (Million) Forecast, by Application 2019 & 2032
- Table 28: Spain Dental Digital Radiography Systems Industry Volume (K Unit) Forecast, by Application 2019 & 2032
- Table 29: Rest of Europe Dental Digital Radiography Systems Industry Revenue (Million) Forecast, by Application 2019 & 2032
- Table 30: Rest of Europe Dental Digital Radiography Systems Industry Volume (K Unit) Forecast, by Application 2019 & 2032
- Table 31: Global Dental Digital Radiography Systems Industry Revenue Million Forecast, by Country 2019 & 2032
- Table 32: Global Dental Digital Radiography Systems Industry Volume K Unit Forecast, by Country 2019 & 2032
- Table 33: China Dental Digital Radiography Systems Industry Revenue (Million) Forecast, by Application 2019 & 2032
- Table 34: China Dental Digital Radiography Systems Industry Volume (K Unit) Forecast, by Application 2019 & 2032
- Table 35: Japan Dental Digital Radiography Systems Industry Revenue (Million) Forecast, by Application 2019 & 2032
- Table 36: Japan Dental Digital Radiography Systems Industry Volume (K Unit) Forecast, by Application 2019 & 2032
- Table 37: India Dental Digital Radiography Systems Industry Revenue (Million) Forecast, by Application 2019 & 2032
- Table 38: India Dental Digital Radiography Systems Industry Volume (K Unit) Forecast, by Application 2019 & 2032
- Table 39: Australia Dental Digital Radiography Systems Industry Revenue (Million) Forecast, by Application 2019 & 2032
- Table 40: Australia Dental Digital Radiography Systems Industry Volume (K Unit) Forecast, by Application 2019 & 2032
- Table 41: South Korea Dental Digital Radiography Systems Industry Revenue (Million) Forecast, by Application 2019 & 2032
- Table 42: South Korea Dental Digital Radiography Systems Industry Volume (K Unit) Forecast, by Application 2019 & 2032
- Table 43: Rest of Asia Pacific Dental Digital Radiography Systems Industry Revenue (Million) Forecast, by Application 2019 & 2032
- Table 44: Rest of Asia Pacific Dental Digital Radiography Systems Industry Volume (K Unit) Forecast, by Application 2019 & 2032
- Table 45: Global Dental Digital Radiography Systems Industry Revenue Million Forecast, by Country 2019 & 2032
- Table 46: Global Dental Digital Radiography Systems Industry Volume K Unit Forecast, by Country 2019 & 2032
- Table 47: GCC Dental Digital Radiography Systems Industry Revenue (Million) Forecast, by Application 2019 & 2032
- Table 48: GCC Dental Digital Radiography Systems Industry Volume (K Unit) Forecast, by Application 2019 & 2032
- Table 49: South Africa Dental Digital Radiography Systems Industry Revenue (Million) Forecast, by Application 2019 & 2032
- Table 50: South Africa Dental Digital Radiography Systems Industry Volume (K Unit) Forecast, by Application 2019 & 2032
- Table 51: Rest of Middle East and Africa Dental Digital Radiography Systems Industry Revenue (Million) Forecast, by Application 2019 & 2032
- Table 52: Rest of Middle East and Africa Dental Digital Radiography Systems Industry Volume (K Unit) Forecast, by Application 2019 & 2032
- Table 53: Global Dental Digital Radiography Systems Industry Revenue Million Forecast, by Country 2019 & 2032
- Table 54: Global Dental Digital Radiography Systems Industry Volume K Unit Forecast, by Country 2019 & 2032
- Table 55: Brazil Dental Digital Radiography Systems Industry Revenue (Million) Forecast, by Application 2019 & 2032
- Table 56: Brazil Dental Digital Radiography Systems Industry Volume (K Unit) Forecast, by Application 2019 & 2032
- Table 57: Argentina Dental Digital Radiography Systems Industry Revenue (Million) Forecast, by Application 2019 & 2032
- Table 58: Argentina Dental Digital Radiography Systems Industry Volume (K Unit) Forecast, by Application 2019 & 2032
- Table 59: Rest of South America Dental Digital Radiography Systems Industry Revenue (Million) Forecast, by Application 2019 & 2032
- Table 60: Rest of South America Dental Digital Radiography Systems Industry Volume (K Unit) Forecast, by Application 2019 & 2032
- Table 61: Global Dental Digital Radiography Systems Industry Revenue Million Forecast, by Technology 2019 & 2032
- Table 62: Global Dental Digital Radiography Systems Industry Volume K Unit Forecast, by Technology 2019 & 2032
- Table 63: Global Dental Digital Radiography Systems Industry Revenue Million Forecast, by Procedure Type 2019 & 2032
- Table 64: Global Dental Digital Radiography Systems Industry Volume K Unit Forecast, by Procedure Type 2019 & 2032
- Table 65: Global Dental Digital Radiography Systems Industry Revenue Million Forecast, by Country 2019 & 2032
- Table 66: Global Dental Digital Radiography Systems Industry Volume K Unit Forecast, by Country 2019 & 2032
- Table 67: United States Dental Digital Radiography Systems Industry Revenue (Million) Forecast, by Application 2019 & 2032
- Table 68: United States Dental Digital Radiography Systems Industry Volume (K Unit) Forecast, by Application 2019 & 2032
- Table 69: Canada Dental Digital Radiography Systems Industry Revenue (Million) Forecast, by Application 2019 & 2032
- Table 70: Canada Dental Digital Radiography Systems Industry Volume (K Unit) Forecast, by Application 2019 & 2032
- Table 71: Mexico Dental Digital Radiography Systems Industry Revenue (Million) Forecast, by Application 2019 & 2032
- Table 72: Mexico Dental Digital Radiography Systems Industry Volume (K Unit) Forecast, by Application 2019 & 2032
- Table 73: Global Dental Digital Radiography Systems Industry Revenue Million Forecast, by Technology 2019 & 2032
- Table 74: Global Dental Digital Radiography Systems Industry Volume K Unit Forecast, by Technology 2019 & 2032
- Table 75: Global Dental Digital Radiography Systems Industry Revenue Million Forecast, by Procedure Type 2019 & 2032
- Table 76: Global Dental Digital Radiography Systems Industry Volume K Unit Forecast, by Procedure Type 2019 & 2032
- Table 77: Global Dental Digital Radiography Systems Industry Revenue Million Forecast, by Country 2019 & 2032
- Table 78: Global Dental Digital Radiography Systems Industry Volume K Unit Forecast, by Country 2019 & 2032
- Table 79: Germany Dental Digital Radiography Systems Industry Revenue (Million) Forecast, by Application 2019 & 2032
- Table 80: Germany Dental Digital Radiography Systems Industry Volume (K Unit) Forecast, by Application 2019 & 2032
- Table 81: United Kingdom Dental Digital Radiography Systems Industry Revenue (Million) Forecast, by Application 2019 & 2032
- Table 82: United Kingdom Dental Digital Radiography Systems Industry Volume (K Unit) Forecast, by Application 2019 & 2032
- Table 83: France Dental Digital Radiography Systems Industry Revenue (Million) Forecast, by Application 2019 & 2032
- Table 84: France Dental Digital Radiography Systems Industry Volume (K Unit) Forecast, by Application 2019 & 2032
- Table 85: Italy Dental Digital Radiography Systems Industry Revenue (Million) Forecast, by Application 2019 & 2032
- Table 86: Italy Dental Digital Radiography Systems Industry Volume (K Unit) Forecast, by Application 2019 & 2032
- Table 87: Spain Dental Digital Radiography Systems Industry Revenue (Million) Forecast, by Application 2019 & 2032
- Table 88: Spain Dental Digital Radiography Systems Industry Volume (K Unit) Forecast, by Application 2019 & 2032
- Table 89: Rest of Europe Dental Digital Radiography Systems Industry Revenue (Million) Forecast, by Application 2019 & 2032
- Table 90: Rest of Europe Dental Digital Radiography Systems Industry Volume (K Unit) Forecast, by Application 2019 & 2032
- Table 91: Global Dental Digital Radiography Systems Industry Revenue Million Forecast, by Technology 2019 & 2032
- Table 92: Global Dental Digital Radiography Systems Industry Volume K Unit Forecast, by Technology 2019 & 2032
- Table 93: Global Dental Digital Radiography Systems Industry Revenue Million Forecast, by Procedure Type 2019 & 2032
- Table 94: Global Dental Digital Radiography Systems Industry Volume K Unit Forecast, by Procedure Type 2019 & 2032
- Table 95: Global Dental Digital Radiography Systems Industry Revenue Million Forecast, by Country 2019 & 2032
- Table 96: Global Dental Digital Radiography Systems Industry Volume K Unit Forecast, by Country 2019 & 2032
- Table 97: China Dental Digital Radiography Systems Industry Revenue (Million) Forecast, by Application 2019 & 2032
- Table 98: China Dental Digital Radiography Systems Industry Volume (K Unit) Forecast, by Application 2019 & 2032
- Table 99: Japan Dental Digital Radiography Systems Industry Revenue (Million) Forecast, by Application 2019 & 2032
- Table 100: Japan Dental Digital Radiography Systems Industry Volume (K Unit) Forecast, by Application 2019 & 2032
- Table 101: India Dental Digital Radiography Systems Industry Revenue (Million) Forecast, by Application 2019 & 2032
- Table 102: India Dental Digital Radiography Systems Industry Volume (K Unit) Forecast, by Application 2019 & 2032
- Table 103: Australia Dental Digital Radiography Systems Industry Revenue (Million) Forecast, by Application 2019 & 2032
- Table 104: Australia Dental Digital Radiography Systems Industry Volume (K Unit) Forecast, by Application 2019 & 2032
- Table 105: South Korea Dental Digital Radiography Systems Industry Revenue (Million) Forecast, by Application 2019 & 2032
- Table 106: South Korea Dental Digital Radiography Systems Industry Volume (K Unit) Forecast, by Application 2019 & 2032
- Table 107: Rest of Asia Pacific Dental Digital Radiography Systems Industry Revenue (Million) Forecast, by Application 2019 & 2032
- Table 108: Rest of Asia Pacific Dental Digital Radiography Systems Industry Volume (K Unit) Forecast, by Application 2019 & 2032
- Table 109: Global Dental Digital Radiography Systems Industry Revenue Million Forecast, by Technology 2019 & 2032
- Table 110: Global Dental Digital Radiography Systems Industry Volume K Unit Forecast, by Technology 2019 & 2032
- Table 111: Global Dental Digital Radiography Systems Industry Revenue Million Forecast, by Procedure Type 2019 & 2032
- Table 112: Global Dental Digital Radiography Systems Industry Volume K Unit Forecast, by Procedure Type 2019 & 2032
- Table 113: Global Dental Digital Radiography Systems Industry Revenue Million Forecast, by Country 2019 & 2032
- Table 114: Global Dental Digital Radiography Systems Industry Volume K Unit Forecast, by Country 2019 & 2032
- Table 115: GCC Dental Digital Radiography Systems Industry Revenue (Million) Forecast, by Application 2019 & 2032
- Table 116: GCC Dental Digital Radiography Systems Industry Volume (K Unit) Forecast, by Application 2019 & 2032
- Table 117: South Africa Dental Digital Radiography Systems Industry Revenue (Million) Forecast, by Application 2019 & 2032
- Table 118: South Africa Dental Digital Radiography Systems Industry Volume (K Unit) Forecast, by Application 2019 & 2032
- Table 119: Rest of Middle East and Africa Dental Digital Radiography Systems Industry Revenue (Million) Forecast, by Application 2019 & 2032
- Table 120: Rest of Middle East and Africa Dental Digital Radiography Systems Industry Volume (K Unit) Forecast, by Application 2019 & 2032
- Table 121: Global Dental Digital Radiography Systems Industry Revenue Million Forecast, by Technology 2019 & 2032
- Table 122: Global Dental Digital Radiography Systems Industry Volume K Unit Forecast, by Technology 2019 & 2032
- Table 123: Global Dental Digital Radiography Systems Industry Revenue Million Forecast, by Procedure Type 2019 & 2032
- Table 124: Global Dental Digital Radiography Systems Industry Volume K Unit Forecast, by Procedure Type 2019 & 2032
- Table 125: Global Dental Digital Radiography Systems Industry Revenue Million Forecast, by Country 2019 & 2032
- Table 126: Global Dental Digital Radiography Systems Industry Volume K Unit Forecast, by Country 2019 & 2032
- Table 127: Brazil Dental Digital Radiography Systems Industry Revenue (Million) Forecast, by Application 2019 & 2032
- Table 128: Brazil Dental Digital Radiography Systems Industry Volume (K Unit) Forecast, by Application 2019 & 2032
- Table 129: Argentina Dental Digital Radiography Systems Industry Revenue (Million) Forecast, by Application 2019 & 2032
- Table 130: Argentina Dental Digital Radiography Systems Industry Volume (K Unit) Forecast, by Application 2019 & 2032
- Table 131: Rest of South America Dental Digital Radiography Systems Industry Revenue (Million) Forecast, by Application 2019 & 2032
- Table 132: Rest of South America Dental Digital Radiography Systems Industry Volume (K Unit) Forecast, by Application 2019 & 2032
Frequently Asked Questions
1. What is the projected Compound Annual Growth Rate (CAGR) of the Dental Digital Radiography Systems Industry?
The projected CAGR is approximately 7.34%.
2. Which companies are prominent players in the Dental Digital Radiography Systems Industry?
Key companies in the market include PLANMECA OY, VATECH, LargeV Instrument Corp Ltd, 3Shape A/S, Meditrix, Dentsply Sirona, IATOME ELECTRIC, ACTEON, Carestream Dental LLC, Air Techniques Inc, THE YOSHIDA DENTAL MFG CO LTD, ASAHIROENTGEN IND CO LTD.
3. What are the main segments of the Dental Digital Radiography Systems Industry?
The market segments include Technology, Procedure Type.
4. Can you provide details about the market size?
The market size is estimated to be USD 3.86 Million as of 2022.
5. What are some drivers contributing to market growth?
Increasing Burden of Dental Diseases; Technological Advancements in Dental Imaging Methodologies; Increasing Demand for Cosmetic Dentistry.
6. What are the notable trends driving market growth?
Digital X-ray Systems Segment is Expected to Hold a Major Market Share in the Dental X-Ray Systems Market During the Forecast Period.
7. Are there any restraints impacting market growth?
High Cost of Dental Radiography Systems.
8. Can you provide examples of recent developments in the market?
In February 2022, Overjet secured the United States Patent for its artificial intelligence (AI) tech that measures anatomical structures and quantifies disease on dental X-rays.
9. What pricing options are available for accessing the report?
Pricing options include single-user, multi-user, and enterprise licenses priced at USD 4750, USD 5250, and USD 8750 respectively.
10. Is the market size provided in terms of value or volume?
The market size is provided in terms of value, measured in Million and volume, measured in K Unit.
11. Are there any specific market keywords associated with the report?
Yes, the market keyword associated with the report is "Dental Digital Radiography Systems Industry," which aids in identifying and referencing the specific market segment covered.
12. How do I determine which pricing option suits my needs best?
The pricing options vary based on user requirements and access needs. Individual users may opt for single-user licenses, while businesses requiring broader access may choose multi-user or enterprise licenses for cost-effective access to the report.
13. Are there any additional resources or data provided in the Dental Digital Radiography Systems Industry report?
While the report offers comprehensive insights, it's advisable to review the specific contents or supplementary materials provided to ascertain if additional resources or data are available.
14. How can I stay updated on further developments or reports in the Dental Digital Radiography Systems Industry?
To stay informed about further developments, trends, and reports in the Dental Digital Radiography Systems Industry, consider subscribing to industry newsletters, following relevant companies and organizations, or regularly checking reputable industry news sources and publications.
Methodology
Step 1 - Identification of Relevant Samples Size from Population Database


Step 2 - Approaches for Defining Global Market Size (Value, Volume* & Price*)

Note*: In applicable scenarios
Step 3 - Data Sources
Primary Research
- Web Analytics
- Survey Reports
- Research Institute
- Latest Research Reports
- Opinion Leaders
Secondary Research
- Annual Reports
- White Paper
- Latest Press Release
- Industry Association
- Paid Database
- Investor Presentations

Step 4 - Data Triangulation
Involves using different sources of information in order to increase the validity of a study
These sources are likely to be stakeholders in a program - participants, other researchers, program staff, other community members, and so on.
Then we put all data in single framework & apply various statistical tools to find out the dynamic on the market.
During the analysis stage, feedback from the stakeholder groups would be compared to determine areas of agreement as well as areas of divergence


