
Key Insights
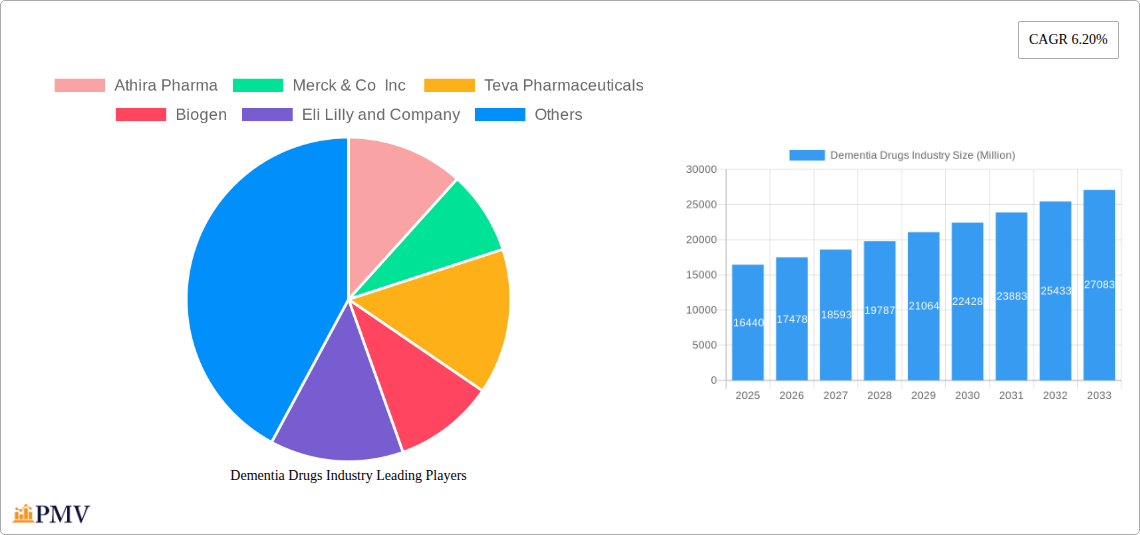
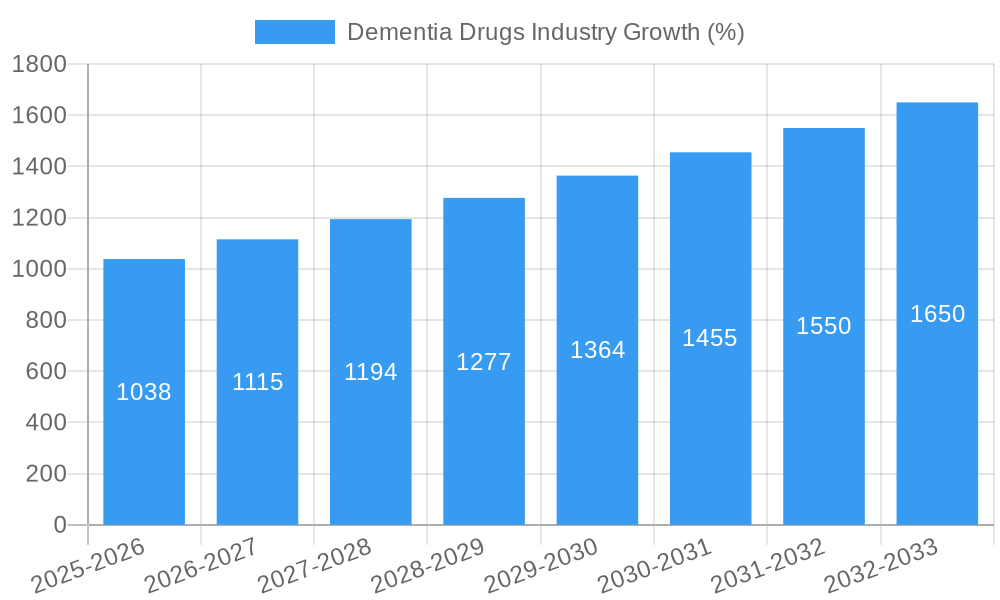
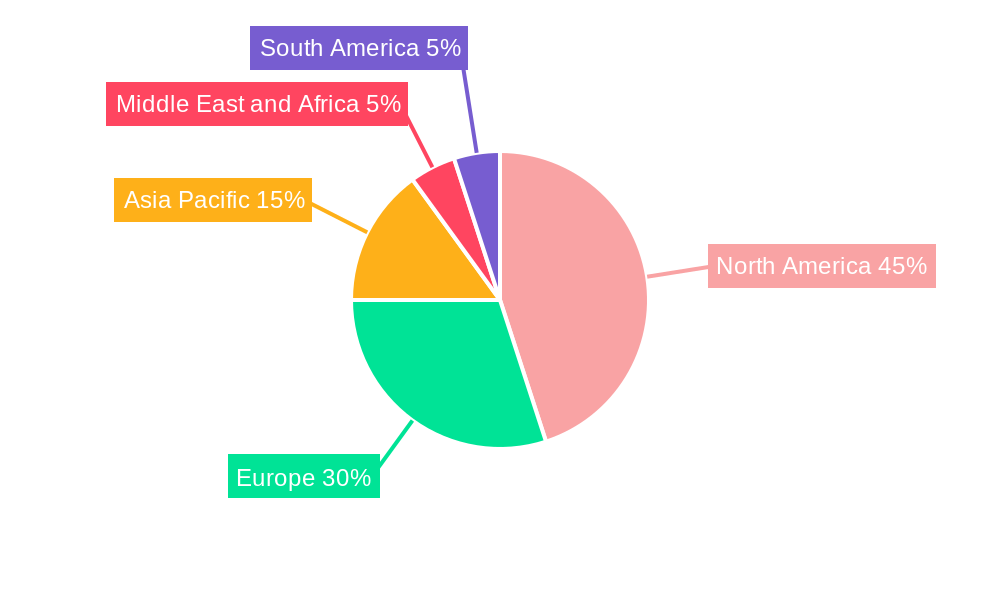
The global dementia drugs market, valued at $16.44 billion in 2025, is projected to experience robust growth, driven by the rising prevalence of age-related dementias like Alzheimer's disease and Parkinson's disease dementia. The aging global population is a primary factor fueling this expansion, with a significant increase in individuals susceptible to neurodegenerative disorders. Furthermore, ongoing research and development efforts are leading to the introduction of novel therapies and improved treatment strategies, contributing to market expansion. Specific growth drivers include an increased awareness of dementia, improved diagnostic tools, and the growing adoption of effective treatment options, particularly in developed regions like North America and Europe. Market segmentation reveals a dominance of cholinesterase inhibitors, although the emergence of newer drug classes, such as glutamate inhibitors, holds substantial promise and is expected to drive future growth. Competitive landscape analysis indicates the presence of both large pharmaceutical companies, such as Biogen, Merck & Co Inc., and Eli Lilly and Company, and smaller, innovative biotechnology firms like Athira Pharma and Annovis Bio, suggesting potential for both established and emerging therapies.
Despite the significant market opportunity, several factors could pose challenges to the industry's growth. These include the high cost of treatment, potential side effects of some medications, and the complex nature of dementia, which necessitates a multi-faceted approach that goes beyond pharmaceutical interventions. The development of effective treatments for Lewy body dementia and other less prevalent forms of dementia remains a significant unmet need within the market. Moreover, geographical disparities in access to diagnosis and treatment, particularly in less developed regions, also represent hurdles. Addressing these issues through collaborative efforts and continued research is crucial for unlocking the full potential of this growing market and improving the lives of individuals affected by dementia globally. The forecast period (2025-2033) anticipates continued expansion, influenced by the factors mentioned above and driven by ongoing scientific advancements and an expanding patient base.
Dementia Drugs Industry Market Report: 2019-2033
This comprehensive report provides a detailed analysis of the Dementia Drugs industry, covering market size, segmentation, competitive landscape, key players, and future growth prospects. The study period spans from 2019 to 2033, with 2025 serving as the base and estimated year. The forecast period extends from 2025 to 2033, while the historical period encompasses 2019-2024. This report is crucial for stakeholders seeking to understand the dynamics and future trajectory of this rapidly evolving market. The global market size in 2025 is estimated at xx Million.
Dementia Drugs Industry Market Structure & Competitive Dynamics
The dementia drugs market exhibits a moderately concentrated structure, with a few large pharmaceutical companies holding significant market share. However, a growing number of smaller biotech firms are contributing to innovation through research and development of novel therapies. The industry is characterized by a complex interplay of factors including stringent regulatory frameworks, intense competition, and increasing R&D investments. Market concentration is influenced by factors such as the number of approved drugs, the strength of intellectual property protection, and the scale of marketing and distribution capabilities. Major players frequently engage in mergers and acquisitions (M&A) to expand their product portfolios, gain access to new technologies, and consolidate market position. M&A activity in this sector has been significant in recent years, with deal values reaching xx Million in 2024. For example, the acquisition of Company X by Company Y in 2023 resulted in a combined market share of approximately xx%. The substitution of older therapies with newer, more targeted treatments also plays a role in shaping the market's competitive dynamics. The increasing prevalence of dementia coupled with the growing demand for effective treatment options drives market expansion while regulatory approvals and patent expirations continuously reshape the competitive landscape. End-user trends (aging population, increased awareness) directly influence product demand.
Dementia Drugs Industry Industry Trends & Insights
The global dementia drugs market is witnessing significant growth, driven primarily by the rising prevalence of age-related neurodegenerative disorders such as Alzheimer's disease. The market is expected to register a Compound Annual Growth Rate (CAGR) of xx% during the forecast period (2025-2033). This growth is fueled by factors such as an aging global population, increased healthcare expenditure, and the ongoing development of novel therapies. Technological advancements are profoundly influencing the industry, leading to the development of more targeted and effective drugs. The market penetration of new drug classes, such as glutamate inhibitors, is increasing. Consumer preferences for safer and more effective treatments are also driving demand, along with increased awareness of dementia and the availability of better diagnostic tools. The competitive dynamics within the industry remain intense, with major players constantly striving to innovate and gain a larger market share.
Dominant Markets & Segments in Dementia Drugs Industry
By Indication: Alzheimer's disease represents the largest segment, accounting for approximately xx% of the market in 2025 due to its high prevalence. Key drivers for this dominance include the large patient pool and significant research focus on Alzheimer's therapies. Parkinson's disease dementia and Lewy body dementia are also significant segments but hold smaller market shares compared to Alzheimer's. The vascular dementia segment's growth is fueled by an aging population and increased awareness.
By Drug Class: Cholinesterase inhibitors dominate the market in 2025, holding approximately xx% of the market share, driven by their established efficacy and widespread use. The increasing demand for therapies targeting specific disease mechanisms is driving the growth of glutamate inhibitors and MAO inhibitors, which are expected to gain market traction in the forecast period.
The North American region holds the largest market share due to high healthcare expenditure, advanced healthcare infrastructure, and a substantial number of dementia patients. Europe holds a significant market share, driven by a high prevalence of dementia.
Dementia Drugs Industry Product Innovations
Recent product innovations are focused on improving drug efficacy, reducing side effects, and developing more convenient administration methods. This includes the development of novel drug delivery systems, such as transdermal patches and implantable devices, alongside new drug candidates targeting specific molecular pathways implicated in dementia. The market is witnessing increasing adoption of combination therapies to leverage the synergistic effects of multiple drug mechanisms, exemplified by the approval of ADLARITY and the registration of MIOREOL. These advancements improve treatment outcomes and enhance patient compliance.
Report Segmentation & Scope
This report segments the dementia drugs market by indication (Alzheimer's disease, Lewy body dementia, Parkinson's disease dementia, vascular dementia, other indications) and by drug class (Cholinesterase inhibitors, glutamate inhibitors, MAO inhibitors). Each segment’s growth projection is analyzed, including market size estimates for 2025 and beyond, along with a competitive analysis for each sub-segment. The report explores the current market landscape, including existing players, new entrants, and their respective market shares and strategies.
Key Drivers of Dementia Drugs Industry Growth
The key drivers of dementia drugs industry growth include the rising prevalence of dementia due to an aging population, increasing healthcare expenditure, and substantial investments in R&D leading to the development of new and more effective treatments. Favorable regulatory environments and rising public awareness are also contributing to market expansion. The development of innovative drug delivery systems further enhances patient compliance and accessibility.
Challenges in the Dementia Drugs Industry Sector
The industry faces significant challenges, including high R&D costs associated with drug development, stringent regulatory approvals, and the complex pathophysiology of dementia. Competition is intense, and intellectual property protection can be challenging. Supply chain disruptions can also impact the availability of drug products, alongside issues related to reimbursement and healthcare access. The market is characterized by a high failure rate in clinical trials, adding to financial and time constraints on the development of new therapies.
Leading Players in the Dementia Drugs Industry Market
- Athira Pharma
- Merck & Co Inc
- Teva Pharmaceuticals
- Biogen
- Eli Lilly and Company
- AstraZeneca
- Johnson and Johnson
- SK Capital (Apotex Pharmaceutical Holdings Inc)
- Aurobindo Pharma
- Eisai Co Ltd
- Annovis Bio
- Zydus Cadila
- GlaxoSmithKline PLC
- Pfizer Inc
Key Developments in Dementia Drugs Industry Sector
- March 2022: Corium, Inc. received United States FDA approval for ADLARITY (donepezil transdermal system) for Alzheimer's disease.
- April 2022: NovaMedica developed and registered MIOREOL, a combination of Donepezil and Memantine, in Russia and the Eurasian Economic Union.
Strategic Dementia Drugs Industry Market Outlook
The dementia drugs market presents significant future potential, driven by a continuously aging global population and ongoing efforts to develop more effective treatments. Strategic opportunities exist in developing novel therapies targeting specific disease pathways, improving drug delivery systems, and exploring combination therapies to enhance treatment outcomes. Focusing on personalized medicine approaches and optimizing patient access to existing treatments are also key strategic avenues for industry players. The market is poised for continued growth, offering significant opportunities for innovation and expansion for companies engaged in research, development, and commercialization of dementia therapeutics.
Dementia Drugs Industry Segmentation
-
1. Indications
- 1.1. Lewy Body Dementia
- 1.2. Parkinson's Disease Dementia
- 1.3. Alzheimer's Disease
- 1.4. Vascular Dementia
- 1.5. Other Indications
-
2. Drug Class
- 2.1. MAO Inhibitors
- 2.2. Glutamate Inhibitors
- 2.3. Cholinesterase Inhibitors
Dementia Drugs Industry Segmentation By Geography
-
1. North America
- 1.1. United States
- 1.2. Canada
- 1.3. Mexico
-
2. Europe
- 2.1. Germany
- 2.2. United Kingdom
- 2.3. France
- 2.4. Italy
- 2.5. Spain
- 2.6. Rest of Europe
-
3. Asia Pacific
- 3.1. China
- 3.2. Japan
- 3.3. India
- 3.4. Australia
- 3.5. South Korea
- 3.6. Rest of Asia Pacific
-
4. Middle East and Africa
- 4.1. GCC
- 4.2. South Africa
- 4.3. Rest of Middle East and Africa
-
5. South America
- 5.1. Brazil
- 5.2. Argentina
- 5.3. Rest of South America
Dementia Drugs Industry REPORT HIGHLIGHTS
| Aspects | Details |
|---|---|
| Study Period | 2019-2033 |
| Base Year | 2024 |
| Estimated Year | 2025 |
| Forecast Period | 2025-2033 |
| Historical Period | 2019-2024 |
| Growth Rate | CAGR of 6.20% from 2019-2033 |
| Segmentation |
|
Table of Contents
- 1. Introduction
- 1.1. Research Scope
- 1.2. Market Segmentation
- 1.3. Research Methodology
- 1.4. Definitions and Assumptions
- 2. Executive Summary
- 2.1. Introduction
- 3. Market Dynamics
- 3.1. Introduction
- 3.2. Market Drivers
- 3.2.1. Increasing Prevalence of Target Diseases; Introduction of New and Innovative Technologies and Drugs; Increased Government Funding and Awareness Programs
- 3.3. Market Restrains
- 3.3.1. High Failure Rates of Drugs at Approval Stages
- 3.4. Market Trends
- 3.4.1. The Alzheimer’s Disease Segment Hold a Significant Market Share and is Expected to Continue the Same Over the Forecast Period
- 4. Market Factor Analysis
- 4.1. Porters Five Forces
- 4.2. Supply/Value Chain
- 4.3. PESTEL analysis
- 4.4. Market Entropy
- 4.5. Patent/Trademark Analysis
- 5. Global Dementia Drugs Industry Analysis, Insights and Forecast, 2019-2031
- 5.1. Market Analysis, Insights and Forecast - by Indications
- 5.1.1. Lewy Body Dementia
- 5.1.2. Parkinson's Disease Dementia
- 5.1.3. Alzheimer's Disease
- 5.1.4. Vascular Dementia
- 5.1.5. Other Indications
- 5.2. Market Analysis, Insights and Forecast - by Drug Class
- 5.2.1. MAO Inhibitors
- 5.2.2. Glutamate Inhibitors
- 5.2.3. Cholinesterase Inhibitors
- 5.3. Market Analysis, Insights and Forecast - by Region
- 5.3.1. North America
- 5.3.2. Europe
- 5.3.3. Asia Pacific
- 5.3.4. Middle East and Africa
- 5.3.5. South America
- 5.1. Market Analysis, Insights and Forecast - by Indications
- 6. North America Dementia Drugs Industry Analysis, Insights and Forecast, 2019-2031
- 6.1. Market Analysis, Insights and Forecast - by Indications
- 6.1.1. Lewy Body Dementia
- 6.1.2. Parkinson's Disease Dementia
- 6.1.3. Alzheimer's Disease
- 6.1.4. Vascular Dementia
- 6.1.5. Other Indications
- 6.2. Market Analysis, Insights and Forecast - by Drug Class
- 6.2.1. MAO Inhibitors
- 6.2.2. Glutamate Inhibitors
- 6.2.3. Cholinesterase Inhibitors
- 6.1. Market Analysis, Insights and Forecast - by Indications
- 7. Europe Dementia Drugs Industry Analysis, Insights and Forecast, 2019-2031
- 7.1. Market Analysis, Insights and Forecast - by Indications
- 7.1.1. Lewy Body Dementia
- 7.1.2. Parkinson's Disease Dementia
- 7.1.3. Alzheimer's Disease
- 7.1.4. Vascular Dementia
- 7.1.5. Other Indications
- 7.2. Market Analysis, Insights and Forecast - by Drug Class
- 7.2.1. MAO Inhibitors
- 7.2.2. Glutamate Inhibitors
- 7.2.3. Cholinesterase Inhibitors
- 7.1. Market Analysis, Insights and Forecast - by Indications
- 8. Asia Pacific Dementia Drugs Industry Analysis, Insights and Forecast, 2019-2031
- 8.1. Market Analysis, Insights and Forecast - by Indications
- 8.1.1. Lewy Body Dementia
- 8.1.2. Parkinson's Disease Dementia
- 8.1.3. Alzheimer's Disease
- 8.1.4. Vascular Dementia
- 8.1.5. Other Indications
- 8.2. Market Analysis, Insights and Forecast - by Drug Class
- 8.2.1. MAO Inhibitors
- 8.2.2. Glutamate Inhibitors
- 8.2.3. Cholinesterase Inhibitors
- 8.1. Market Analysis, Insights and Forecast - by Indications
- 9. Middle East and Africa Dementia Drugs Industry Analysis, Insights and Forecast, 2019-2031
- 9.1. Market Analysis, Insights and Forecast - by Indications
- 9.1.1. Lewy Body Dementia
- 9.1.2. Parkinson's Disease Dementia
- 9.1.3. Alzheimer's Disease
- 9.1.4. Vascular Dementia
- 9.1.5. Other Indications
- 9.2. Market Analysis, Insights and Forecast - by Drug Class
- 9.2.1. MAO Inhibitors
- 9.2.2. Glutamate Inhibitors
- 9.2.3. Cholinesterase Inhibitors
- 9.1. Market Analysis, Insights and Forecast - by Indications
- 10. South America Dementia Drugs Industry Analysis, Insights and Forecast, 2019-2031
- 10.1. Market Analysis, Insights and Forecast - by Indications
- 10.1.1. Lewy Body Dementia
- 10.1.2. Parkinson's Disease Dementia
- 10.1.3. Alzheimer's Disease
- 10.1.4. Vascular Dementia
- 10.1.5. Other Indications
- 10.2. Market Analysis, Insights and Forecast - by Drug Class
- 10.2.1. MAO Inhibitors
- 10.2.2. Glutamate Inhibitors
- 10.2.3. Cholinesterase Inhibitors
- 10.1. Market Analysis, Insights and Forecast - by Indications
- 11. North America Dementia Drugs Industry Analysis, Insights and Forecast, 2019-2031
- 11.1. Market Analysis, Insights and Forecast - By Country/Sub-region
- 11.1.1 United States
- 11.1.2 Canada
- 11.1.3 Mexico
- 12. Europe Dementia Drugs Industry Analysis, Insights and Forecast, 2019-2031
- 12.1. Market Analysis, Insights and Forecast - By Country/Sub-region
- 12.1.1 Germany
- 12.1.2 United Kingdom
- 12.1.3 France
- 12.1.4 Italy
- 12.1.5 Spain
- 12.1.6 Rest of Europe
- 13. Asia Pacific Dementia Drugs Industry Analysis, Insights and Forecast, 2019-2031
- 13.1. Market Analysis, Insights and Forecast - By Country/Sub-region
- 13.1.1 China
- 13.1.2 Japan
- 13.1.3 India
- 13.1.4 Australia
- 13.1.5 South Korea
- 13.1.6 Rest of Asia Pacific
- 14. Middle East and Africa Dementia Drugs Industry Analysis, Insights and Forecast, 2019-2031
- 14.1. Market Analysis, Insights and Forecast - By Country/Sub-region
- 14.1.1 GCC
- 14.1.2 South Africa
- 14.1.3 Rest of Middle East and Africa
- 15. South America Dementia Drugs Industry Analysis, Insights and Forecast, 2019-2031
- 15.1. Market Analysis, Insights and Forecast - By Country/Sub-region
- 15.1.1 Brazil
- 15.1.2 Argentina
- 15.1.3 Rest of South America
- 16. Competitive Analysis
- 16.1. Global Market Share Analysis 2024
- 16.2. Company Profiles
- 16.2.1 Athira Pharma
- 16.2.1.1. Overview
- 16.2.1.2. Products
- 16.2.1.3. SWOT Analysis
- 16.2.1.4. Recent Developments
- 16.2.1.5. Financials (Based on Availability)
- 16.2.2 Merck & Co Inc
- 16.2.2.1. Overview
- 16.2.2.2. Products
- 16.2.2.3. SWOT Analysis
- 16.2.2.4. Recent Developments
- 16.2.2.5. Financials (Based on Availability)
- 16.2.3 Teva Pharmaceuticals
- 16.2.3.1. Overview
- 16.2.3.2. Products
- 16.2.3.3. SWOT Analysis
- 16.2.3.4. Recent Developments
- 16.2.3.5. Financials (Based on Availability)
- 16.2.4 Biogen
- 16.2.4.1. Overview
- 16.2.4.2. Products
- 16.2.4.3. SWOT Analysis
- 16.2.4.4. Recent Developments
- 16.2.4.5. Financials (Based on Availability)
- 16.2.5 Eli Lilly and Company
- 16.2.5.1. Overview
- 16.2.5.2. Products
- 16.2.5.3. SWOT Analysis
- 16.2.5.4. Recent Developments
- 16.2.5.5. Financials (Based on Availability)
- 16.2.6 AstraZeneca
- 16.2.6.1. Overview
- 16.2.6.2. Products
- 16.2.6.3. SWOT Analysis
- 16.2.6.4. Recent Developments
- 16.2.6.5. Financials (Based on Availability)
- 16.2.7 Johnson and Johnson
- 16.2.7.1. Overview
- 16.2.7.2. Products
- 16.2.7.3. SWOT Analysis
- 16.2.7.4. Recent Developments
- 16.2.7.5. Financials (Based on Availability)
- 16.2.8 SK Capital (Apotex Pharmaceutical Holdings Inc )
- 16.2.8.1. Overview
- 16.2.8.2. Products
- 16.2.8.3. SWOT Analysis
- 16.2.8.4. Recent Developments
- 16.2.8.5. Financials (Based on Availability)
- 16.2.9 Aurobindo Pharma
- 16.2.9.1. Overview
- 16.2.9.2. Products
- 16.2.9.3. SWOT Analysis
- 16.2.9.4. Recent Developments
- 16.2.9.5. Financials (Based on Availability)
- 16.2.10 Eisai Co Ltd
- 16.2.10.1. Overview
- 16.2.10.2. Products
- 16.2.10.3. SWOT Analysis
- 16.2.10.4. Recent Developments
- 16.2.10.5. Financials (Based on Availability)
- 16.2.11 Annovis Bio
- 16.2.11.1. Overview
- 16.2.11.2. Products
- 16.2.11.3. SWOT Analysis
- 16.2.11.4. Recent Developments
- 16.2.11.5. Financials (Based on Availability)
- 16.2.12 Zydus Cadila
- 16.2.12.1. Overview
- 16.2.12.2. Products
- 16.2.12.3. SWOT Analysis
- 16.2.12.4. Recent Developments
- 16.2.12.5. Financials (Based on Availability)
- 16.2.13 GlaxoSmithKline PLC
- 16.2.13.1. Overview
- 16.2.13.2. Products
- 16.2.13.3. SWOT Analysis
- 16.2.13.4. Recent Developments
- 16.2.13.5. Financials (Based on Availability)
- 16.2.14 Pfizer Inc
- 16.2.14.1. Overview
- 16.2.14.2. Products
- 16.2.14.3. SWOT Analysis
- 16.2.14.4. Recent Developments
- 16.2.14.5. Financials (Based on Availability)
- 16.2.1 Athira Pharma
List of Figures
- Figure 1: Global Dementia Drugs Industry Revenue Breakdown (Million, %) by Region 2024 & 2032
- Figure 2: Global Dementia Drugs Industry Volume Breakdown (K Unit, %) by Region 2024 & 2032
- Figure 3: North America Dementia Drugs Industry Revenue (Million), by Country 2024 & 2032
- Figure 4: North America Dementia Drugs Industry Volume (K Unit), by Country 2024 & 2032
- Figure 5: North America Dementia Drugs Industry Revenue Share (%), by Country 2024 & 2032
- Figure 6: North America Dementia Drugs Industry Volume Share (%), by Country 2024 & 2032
- Figure 7: Europe Dementia Drugs Industry Revenue (Million), by Country 2024 & 2032
- Figure 8: Europe Dementia Drugs Industry Volume (K Unit), by Country 2024 & 2032
- Figure 9: Europe Dementia Drugs Industry Revenue Share (%), by Country 2024 & 2032
- Figure 10: Europe Dementia Drugs Industry Volume Share (%), by Country 2024 & 2032
- Figure 11: Asia Pacific Dementia Drugs Industry Revenue (Million), by Country 2024 & 2032
- Figure 12: Asia Pacific Dementia Drugs Industry Volume (K Unit), by Country 2024 & 2032
- Figure 13: Asia Pacific Dementia Drugs Industry Revenue Share (%), by Country 2024 & 2032
- Figure 14: Asia Pacific Dementia Drugs Industry Volume Share (%), by Country 2024 & 2032
- Figure 15: Middle East and Africa Dementia Drugs Industry Revenue (Million), by Country 2024 & 2032
- Figure 16: Middle East and Africa Dementia Drugs Industry Volume (K Unit), by Country 2024 & 2032
- Figure 17: Middle East and Africa Dementia Drugs Industry Revenue Share (%), by Country 2024 & 2032
- Figure 18: Middle East and Africa Dementia Drugs Industry Volume Share (%), by Country 2024 & 2032
- Figure 19: South America Dementia Drugs Industry Revenue (Million), by Country 2024 & 2032
- Figure 20: South America Dementia Drugs Industry Volume (K Unit), by Country 2024 & 2032
- Figure 21: South America Dementia Drugs Industry Revenue Share (%), by Country 2024 & 2032
- Figure 22: South America Dementia Drugs Industry Volume Share (%), by Country 2024 & 2032
- Figure 23: North America Dementia Drugs Industry Revenue (Million), by Indications 2024 & 2032
- Figure 24: North America Dementia Drugs Industry Volume (K Unit), by Indications 2024 & 2032
- Figure 25: North America Dementia Drugs Industry Revenue Share (%), by Indications 2024 & 2032
- Figure 26: North America Dementia Drugs Industry Volume Share (%), by Indications 2024 & 2032
- Figure 27: North America Dementia Drugs Industry Revenue (Million), by Drug Class 2024 & 2032
- Figure 28: North America Dementia Drugs Industry Volume (K Unit), by Drug Class 2024 & 2032
- Figure 29: North America Dementia Drugs Industry Revenue Share (%), by Drug Class 2024 & 2032
- Figure 30: North America Dementia Drugs Industry Volume Share (%), by Drug Class 2024 & 2032
- Figure 31: North America Dementia Drugs Industry Revenue (Million), by Country 2024 & 2032
- Figure 32: North America Dementia Drugs Industry Volume (K Unit), by Country 2024 & 2032
- Figure 33: North America Dementia Drugs Industry Revenue Share (%), by Country 2024 & 2032
- Figure 34: North America Dementia Drugs Industry Volume Share (%), by Country 2024 & 2032
- Figure 35: Europe Dementia Drugs Industry Revenue (Million), by Indications 2024 & 2032
- Figure 36: Europe Dementia Drugs Industry Volume (K Unit), by Indications 2024 & 2032
- Figure 37: Europe Dementia Drugs Industry Revenue Share (%), by Indications 2024 & 2032
- Figure 38: Europe Dementia Drugs Industry Volume Share (%), by Indications 2024 & 2032
- Figure 39: Europe Dementia Drugs Industry Revenue (Million), by Drug Class 2024 & 2032
- Figure 40: Europe Dementia Drugs Industry Volume (K Unit), by Drug Class 2024 & 2032
- Figure 41: Europe Dementia Drugs Industry Revenue Share (%), by Drug Class 2024 & 2032
- Figure 42: Europe Dementia Drugs Industry Volume Share (%), by Drug Class 2024 & 2032
- Figure 43: Europe Dementia Drugs Industry Revenue (Million), by Country 2024 & 2032
- Figure 44: Europe Dementia Drugs Industry Volume (K Unit), by Country 2024 & 2032
- Figure 45: Europe Dementia Drugs Industry Revenue Share (%), by Country 2024 & 2032
- Figure 46: Europe Dementia Drugs Industry Volume Share (%), by Country 2024 & 2032
- Figure 47: Asia Pacific Dementia Drugs Industry Revenue (Million), by Indications 2024 & 2032
- Figure 48: Asia Pacific Dementia Drugs Industry Volume (K Unit), by Indications 2024 & 2032
- Figure 49: Asia Pacific Dementia Drugs Industry Revenue Share (%), by Indications 2024 & 2032
- Figure 50: Asia Pacific Dementia Drugs Industry Volume Share (%), by Indications 2024 & 2032
- Figure 51: Asia Pacific Dementia Drugs Industry Revenue (Million), by Drug Class 2024 & 2032
- Figure 52: Asia Pacific Dementia Drugs Industry Volume (K Unit), by Drug Class 2024 & 2032
- Figure 53: Asia Pacific Dementia Drugs Industry Revenue Share (%), by Drug Class 2024 & 2032
- Figure 54: Asia Pacific Dementia Drugs Industry Volume Share (%), by Drug Class 2024 & 2032
- Figure 55: Asia Pacific Dementia Drugs Industry Revenue (Million), by Country 2024 & 2032
- Figure 56: Asia Pacific Dementia Drugs Industry Volume (K Unit), by Country 2024 & 2032
- Figure 57: Asia Pacific Dementia Drugs Industry Revenue Share (%), by Country 2024 & 2032
- Figure 58: Asia Pacific Dementia Drugs Industry Volume Share (%), by Country 2024 & 2032
- Figure 59: Middle East and Africa Dementia Drugs Industry Revenue (Million), by Indications 2024 & 2032
- Figure 60: Middle East and Africa Dementia Drugs Industry Volume (K Unit), by Indications 2024 & 2032
- Figure 61: Middle East and Africa Dementia Drugs Industry Revenue Share (%), by Indications 2024 & 2032
- Figure 62: Middle East and Africa Dementia Drugs Industry Volume Share (%), by Indications 2024 & 2032
- Figure 63: Middle East and Africa Dementia Drugs Industry Revenue (Million), by Drug Class 2024 & 2032
- Figure 64: Middle East and Africa Dementia Drugs Industry Volume (K Unit), by Drug Class 2024 & 2032
- Figure 65: Middle East and Africa Dementia Drugs Industry Revenue Share (%), by Drug Class 2024 & 2032
- Figure 66: Middle East and Africa Dementia Drugs Industry Volume Share (%), by Drug Class 2024 & 2032
- Figure 67: Middle East and Africa Dementia Drugs Industry Revenue (Million), by Country 2024 & 2032
- Figure 68: Middle East and Africa Dementia Drugs Industry Volume (K Unit), by Country 2024 & 2032
- Figure 69: Middle East and Africa Dementia Drugs Industry Revenue Share (%), by Country 2024 & 2032
- Figure 70: Middle East and Africa Dementia Drugs Industry Volume Share (%), by Country 2024 & 2032
- Figure 71: South America Dementia Drugs Industry Revenue (Million), by Indications 2024 & 2032
- Figure 72: South America Dementia Drugs Industry Volume (K Unit), by Indications 2024 & 2032
- Figure 73: South America Dementia Drugs Industry Revenue Share (%), by Indications 2024 & 2032
- Figure 74: South America Dementia Drugs Industry Volume Share (%), by Indications 2024 & 2032
- Figure 75: South America Dementia Drugs Industry Revenue (Million), by Drug Class 2024 & 2032
- Figure 76: South America Dementia Drugs Industry Volume (K Unit), by Drug Class 2024 & 2032
- Figure 77: South America Dementia Drugs Industry Revenue Share (%), by Drug Class 2024 & 2032
- Figure 78: South America Dementia Drugs Industry Volume Share (%), by Drug Class 2024 & 2032
- Figure 79: South America Dementia Drugs Industry Revenue (Million), by Country 2024 & 2032
- Figure 80: South America Dementia Drugs Industry Volume (K Unit), by Country 2024 & 2032
- Figure 81: South America Dementia Drugs Industry Revenue Share (%), by Country 2024 & 2032
- Figure 82: South America Dementia Drugs Industry Volume Share (%), by Country 2024 & 2032
List of Tables
- Table 1: Global Dementia Drugs Industry Revenue Million Forecast, by Region 2019 & 2032
- Table 2: Global Dementia Drugs Industry Volume K Unit Forecast, by Region 2019 & 2032
- Table 3: Global Dementia Drugs Industry Revenue Million Forecast, by Indications 2019 & 2032
- Table 4: Global Dementia Drugs Industry Volume K Unit Forecast, by Indications 2019 & 2032
- Table 5: Global Dementia Drugs Industry Revenue Million Forecast, by Drug Class 2019 & 2032
- Table 6: Global Dementia Drugs Industry Volume K Unit Forecast, by Drug Class 2019 & 2032
- Table 7: Global Dementia Drugs Industry Revenue Million Forecast, by Region 2019 & 2032
- Table 8: Global Dementia Drugs Industry Volume K Unit Forecast, by Region 2019 & 2032
- Table 9: Global Dementia Drugs Industry Revenue Million Forecast, by Country 2019 & 2032
- Table 10: Global Dementia Drugs Industry Volume K Unit Forecast, by Country 2019 & 2032
- Table 11: United States Dementia Drugs Industry Revenue (Million) Forecast, by Application 2019 & 2032
- Table 12: United States Dementia Drugs Industry Volume (K Unit) Forecast, by Application 2019 & 2032
- Table 13: Canada Dementia Drugs Industry Revenue (Million) Forecast, by Application 2019 & 2032
- Table 14: Canada Dementia Drugs Industry Volume (K Unit) Forecast, by Application 2019 & 2032
- Table 15: Mexico Dementia Drugs Industry Revenue (Million) Forecast, by Application 2019 & 2032
- Table 16: Mexico Dementia Drugs Industry Volume (K Unit) Forecast, by Application 2019 & 2032
- Table 17: Global Dementia Drugs Industry Revenue Million Forecast, by Country 2019 & 2032
- Table 18: Global Dementia Drugs Industry Volume K Unit Forecast, by Country 2019 & 2032
- Table 19: Germany Dementia Drugs Industry Revenue (Million) Forecast, by Application 2019 & 2032
- Table 20: Germany Dementia Drugs Industry Volume (K Unit) Forecast, by Application 2019 & 2032
- Table 21: United Kingdom Dementia Drugs Industry Revenue (Million) Forecast, by Application 2019 & 2032
- Table 22: United Kingdom Dementia Drugs Industry Volume (K Unit) Forecast, by Application 2019 & 2032
- Table 23: France Dementia Drugs Industry Revenue (Million) Forecast, by Application 2019 & 2032
- Table 24: France Dementia Drugs Industry Volume (K Unit) Forecast, by Application 2019 & 2032
- Table 25: Italy Dementia Drugs Industry Revenue (Million) Forecast, by Application 2019 & 2032
- Table 26: Italy Dementia Drugs Industry Volume (K Unit) Forecast, by Application 2019 & 2032
- Table 27: Spain Dementia Drugs Industry Revenue (Million) Forecast, by Application 2019 & 2032
- Table 28: Spain Dementia Drugs Industry Volume (K Unit) Forecast, by Application 2019 & 2032
- Table 29: Rest of Europe Dementia Drugs Industry Revenue (Million) Forecast, by Application 2019 & 2032
- Table 30: Rest of Europe Dementia Drugs Industry Volume (K Unit) Forecast, by Application 2019 & 2032
- Table 31: Global Dementia Drugs Industry Revenue Million Forecast, by Country 2019 & 2032
- Table 32: Global Dementia Drugs Industry Volume K Unit Forecast, by Country 2019 & 2032
- Table 33: China Dementia Drugs Industry Revenue (Million) Forecast, by Application 2019 & 2032
- Table 34: China Dementia Drugs Industry Volume (K Unit) Forecast, by Application 2019 & 2032
- Table 35: Japan Dementia Drugs Industry Revenue (Million) Forecast, by Application 2019 & 2032
- Table 36: Japan Dementia Drugs Industry Volume (K Unit) Forecast, by Application 2019 & 2032
- Table 37: India Dementia Drugs Industry Revenue (Million) Forecast, by Application 2019 & 2032
- Table 38: India Dementia Drugs Industry Volume (K Unit) Forecast, by Application 2019 & 2032
- Table 39: Australia Dementia Drugs Industry Revenue (Million) Forecast, by Application 2019 & 2032
- Table 40: Australia Dementia Drugs Industry Volume (K Unit) Forecast, by Application 2019 & 2032
- Table 41: South Korea Dementia Drugs Industry Revenue (Million) Forecast, by Application 2019 & 2032
- Table 42: South Korea Dementia Drugs Industry Volume (K Unit) Forecast, by Application 2019 & 2032
- Table 43: Rest of Asia Pacific Dementia Drugs Industry Revenue (Million) Forecast, by Application 2019 & 2032
- Table 44: Rest of Asia Pacific Dementia Drugs Industry Volume (K Unit) Forecast, by Application 2019 & 2032
- Table 45: Global Dementia Drugs Industry Revenue Million Forecast, by Country 2019 & 2032
- Table 46: Global Dementia Drugs Industry Volume K Unit Forecast, by Country 2019 & 2032
- Table 47: GCC Dementia Drugs Industry Revenue (Million) Forecast, by Application 2019 & 2032
- Table 48: GCC Dementia Drugs Industry Volume (K Unit) Forecast, by Application 2019 & 2032
- Table 49: South Africa Dementia Drugs Industry Revenue (Million) Forecast, by Application 2019 & 2032
- Table 50: South Africa Dementia Drugs Industry Volume (K Unit) Forecast, by Application 2019 & 2032
- Table 51: Rest of Middle East and Africa Dementia Drugs Industry Revenue (Million) Forecast, by Application 2019 & 2032
- Table 52: Rest of Middle East and Africa Dementia Drugs Industry Volume (K Unit) Forecast, by Application 2019 & 2032
- Table 53: Global Dementia Drugs Industry Revenue Million Forecast, by Country 2019 & 2032
- Table 54: Global Dementia Drugs Industry Volume K Unit Forecast, by Country 2019 & 2032
- Table 55: Brazil Dementia Drugs Industry Revenue (Million) Forecast, by Application 2019 & 2032
- Table 56: Brazil Dementia Drugs Industry Volume (K Unit) Forecast, by Application 2019 & 2032
- Table 57: Argentina Dementia Drugs Industry Revenue (Million) Forecast, by Application 2019 & 2032
- Table 58: Argentina Dementia Drugs Industry Volume (K Unit) Forecast, by Application 2019 & 2032
- Table 59: Rest of South America Dementia Drugs Industry Revenue (Million) Forecast, by Application 2019 & 2032
- Table 60: Rest of South America Dementia Drugs Industry Volume (K Unit) Forecast, by Application 2019 & 2032
- Table 61: Global Dementia Drugs Industry Revenue Million Forecast, by Indications 2019 & 2032
- Table 62: Global Dementia Drugs Industry Volume K Unit Forecast, by Indications 2019 & 2032
- Table 63: Global Dementia Drugs Industry Revenue Million Forecast, by Drug Class 2019 & 2032
- Table 64: Global Dementia Drugs Industry Volume K Unit Forecast, by Drug Class 2019 & 2032
- Table 65: Global Dementia Drugs Industry Revenue Million Forecast, by Country 2019 & 2032
- Table 66: Global Dementia Drugs Industry Volume K Unit Forecast, by Country 2019 & 2032
- Table 67: United States Dementia Drugs Industry Revenue (Million) Forecast, by Application 2019 & 2032
- Table 68: United States Dementia Drugs Industry Volume (K Unit) Forecast, by Application 2019 & 2032
- Table 69: Canada Dementia Drugs Industry Revenue (Million) Forecast, by Application 2019 & 2032
- Table 70: Canada Dementia Drugs Industry Volume (K Unit) Forecast, by Application 2019 & 2032
- Table 71: Mexico Dementia Drugs Industry Revenue (Million) Forecast, by Application 2019 & 2032
- Table 72: Mexico Dementia Drugs Industry Volume (K Unit) Forecast, by Application 2019 & 2032
- Table 73: Global Dementia Drugs Industry Revenue Million Forecast, by Indications 2019 & 2032
- Table 74: Global Dementia Drugs Industry Volume K Unit Forecast, by Indications 2019 & 2032
- Table 75: Global Dementia Drugs Industry Revenue Million Forecast, by Drug Class 2019 & 2032
- Table 76: Global Dementia Drugs Industry Volume K Unit Forecast, by Drug Class 2019 & 2032
- Table 77: Global Dementia Drugs Industry Revenue Million Forecast, by Country 2019 & 2032
- Table 78: Global Dementia Drugs Industry Volume K Unit Forecast, by Country 2019 & 2032
- Table 79: Germany Dementia Drugs Industry Revenue (Million) Forecast, by Application 2019 & 2032
- Table 80: Germany Dementia Drugs Industry Volume (K Unit) Forecast, by Application 2019 & 2032
- Table 81: United Kingdom Dementia Drugs Industry Revenue (Million) Forecast, by Application 2019 & 2032
- Table 82: United Kingdom Dementia Drugs Industry Volume (K Unit) Forecast, by Application 2019 & 2032
- Table 83: France Dementia Drugs Industry Revenue (Million) Forecast, by Application 2019 & 2032
- Table 84: France Dementia Drugs Industry Volume (K Unit) Forecast, by Application 2019 & 2032
- Table 85: Italy Dementia Drugs Industry Revenue (Million) Forecast, by Application 2019 & 2032
- Table 86: Italy Dementia Drugs Industry Volume (K Unit) Forecast, by Application 2019 & 2032
- Table 87: Spain Dementia Drugs Industry Revenue (Million) Forecast, by Application 2019 & 2032
- Table 88: Spain Dementia Drugs Industry Volume (K Unit) Forecast, by Application 2019 & 2032
- Table 89: Rest of Europe Dementia Drugs Industry Revenue (Million) Forecast, by Application 2019 & 2032
- Table 90: Rest of Europe Dementia Drugs Industry Volume (K Unit) Forecast, by Application 2019 & 2032
- Table 91: Global Dementia Drugs Industry Revenue Million Forecast, by Indications 2019 & 2032
- Table 92: Global Dementia Drugs Industry Volume K Unit Forecast, by Indications 2019 & 2032
- Table 93: Global Dementia Drugs Industry Revenue Million Forecast, by Drug Class 2019 & 2032
- Table 94: Global Dementia Drugs Industry Volume K Unit Forecast, by Drug Class 2019 & 2032
- Table 95: Global Dementia Drugs Industry Revenue Million Forecast, by Country 2019 & 2032
- Table 96: Global Dementia Drugs Industry Volume K Unit Forecast, by Country 2019 & 2032
- Table 97: China Dementia Drugs Industry Revenue (Million) Forecast, by Application 2019 & 2032
- Table 98: China Dementia Drugs Industry Volume (K Unit) Forecast, by Application 2019 & 2032
- Table 99: Japan Dementia Drugs Industry Revenue (Million) Forecast, by Application 2019 & 2032
- Table 100: Japan Dementia Drugs Industry Volume (K Unit) Forecast, by Application 2019 & 2032
- Table 101: India Dementia Drugs Industry Revenue (Million) Forecast, by Application 2019 & 2032
- Table 102: India Dementia Drugs Industry Volume (K Unit) Forecast, by Application 2019 & 2032
- Table 103: Australia Dementia Drugs Industry Revenue (Million) Forecast, by Application 2019 & 2032
- Table 104: Australia Dementia Drugs Industry Volume (K Unit) Forecast, by Application 2019 & 2032
- Table 105: South Korea Dementia Drugs Industry Revenue (Million) Forecast, by Application 2019 & 2032
- Table 106: South Korea Dementia Drugs Industry Volume (K Unit) Forecast, by Application 2019 & 2032
- Table 107: Rest of Asia Pacific Dementia Drugs Industry Revenue (Million) Forecast, by Application 2019 & 2032
- Table 108: Rest of Asia Pacific Dementia Drugs Industry Volume (K Unit) Forecast, by Application 2019 & 2032
- Table 109: Global Dementia Drugs Industry Revenue Million Forecast, by Indications 2019 & 2032
- Table 110: Global Dementia Drugs Industry Volume K Unit Forecast, by Indications 2019 & 2032
- Table 111: Global Dementia Drugs Industry Revenue Million Forecast, by Drug Class 2019 & 2032
- Table 112: Global Dementia Drugs Industry Volume K Unit Forecast, by Drug Class 2019 & 2032
- Table 113: Global Dementia Drugs Industry Revenue Million Forecast, by Country 2019 & 2032
- Table 114: Global Dementia Drugs Industry Volume K Unit Forecast, by Country 2019 & 2032
- Table 115: GCC Dementia Drugs Industry Revenue (Million) Forecast, by Application 2019 & 2032
- Table 116: GCC Dementia Drugs Industry Volume (K Unit) Forecast, by Application 2019 & 2032
- Table 117: South Africa Dementia Drugs Industry Revenue (Million) Forecast, by Application 2019 & 2032
- Table 118: South Africa Dementia Drugs Industry Volume (K Unit) Forecast, by Application 2019 & 2032
- Table 119: Rest of Middle East and Africa Dementia Drugs Industry Revenue (Million) Forecast, by Application 2019 & 2032
- Table 120: Rest of Middle East and Africa Dementia Drugs Industry Volume (K Unit) Forecast, by Application 2019 & 2032
- Table 121: Global Dementia Drugs Industry Revenue Million Forecast, by Indications 2019 & 2032
- Table 122: Global Dementia Drugs Industry Volume K Unit Forecast, by Indications 2019 & 2032
- Table 123: Global Dementia Drugs Industry Revenue Million Forecast, by Drug Class 2019 & 2032
- Table 124: Global Dementia Drugs Industry Volume K Unit Forecast, by Drug Class 2019 & 2032
- Table 125: Global Dementia Drugs Industry Revenue Million Forecast, by Country 2019 & 2032
- Table 126: Global Dementia Drugs Industry Volume K Unit Forecast, by Country 2019 & 2032
- Table 127: Brazil Dementia Drugs Industry Revenue (Million) Forecast, by Application 2019 & 2032
- Table 128: Brazil Dementia Drugs Industry Volume (K Unit) Forecast, by Application 2019 & 2032
- Table 129: Argentina Dementia Drugs Industry Revenue (Million) Forecast, by Application 2019 & 2032
- Table 130: Argentina Dementia Drugs Industry Volume (K Unit) Forecast, by Application 2019 & 2032
- Table 131: Rest of South America Dementia Drugs Industry Revenue (Million) Forecast, by Application 2019 & 2032
- Table 132: Rest of South America Dementia Drugs Industry Volume (K Unit) Forecast, by Application 2019 & 2032
Frequently Asked Questions
1. What is the projected Compound Annual Growth Rate (CAGR) of the Dementia Drugs Industry?
The projected CAGR is approximately 6.20%.
2. Which companies are prominent players in the Dementia Drugs Industry?
Key companies in the market include Athira Pharma, Merck & Co Inc , Teva Pharmaceuticals, Biogen, Eli Lilly and Company, AstraZeneca, Johnson and Johnson, SK Capital (Apotex Pharmaceutical Holdings Inc ), Aurobindo Pharma, Eisai Co Ltd, Annovis Bio, Zydus Cadila, GlaxoSmithKline PLC, Pfizer Inc.
3. What are the main segments of the Dementia Drugs Industry?
The market segments include Indications, Drug Class.
4. Can you provide details about the market size?
The market size is estimated to be USD 16.44 Million as of 2022.
5. What are some drivers contributing to market growth?
Increasing Prevalence of Target Diseases; Introduction of New and Innovative Technologies and Drugs; Increased Government Funding and Awareness Programs.
6. What are the notable trends driving market growth?
The Alzheimer’s Disease Segment Hold a Significant Market Share and is Expected to Continue the Same Over the Forecast Period.
7. Are there any restraints impacting market growth?
High Failure Rates of Drugs at Approval Stages.
8. Can you provide examples of recent developments in the market?
April 2022- NovaMedica developed and registered an innovative combination of Donepezil and Memantine molecules, the primary therapies for dementia associated with Alzheimer's disease. The drug is registered under the name MIOREOL. This is one of the combinations in the Russian market and the markets of the Eurasian Economic Union members and Europe.
9. What pricing options are available for accessing the report?
Pricing options include single-user, multi-user, and enterprise licenses priced at USD 4750, USD 5250, and USD 8750 respectively.
10. Is the market size provided in terms of value or volume?
The market size is provided in terms of value, measured in Million and volume, measured in K Unit.
11. Are there any specific market keywords associated with the report?
Yes, the market keyword associated with the report is "Dementia Drugs Industry," which aids in identifying and referencing the specific market segment covered.
12. How do I determine which pricing option suits my needs best?
The pricing options vary based on user requirements and access needs. Individual users may opt for single-user licenses, while businesses requiring broader access may choose multi-user or enterprise licenses for cost-effective access to the report.
13. Are there any additional resources or data provided in the Dementia Drugs Industry report?
While the report offers comprehensive insights, it's advisable to review the specific contents or supplementary materials provided to ascertain if additional resources or data are available.
14. How can I stay updated on further developments or reports in the Dementia Drugs Industry?
To stay informed about further developments, trends, and reports in the Dementia Drugs Industry, consider subscribing to industry newsletters, following relevant companies and organizations, or regularly checking reputable industry news sources and publications.
Methodology
Step 1 - Identification of Relevant Samples Size from Population Database


Step 2 - Approaches for Defining Global Market Size (Value, Volume* & Price*)

Note*: In applicable scenarios
Step 3 - Data Sources
Primary Research
- Web Analytics
- Survey Reports
- Research Institute
- Latest Research Reports
- Opinion Leaders
Secondary Research
- Annual Reports
- White Paper
- Latest Press Release
- Industry Association
- Paid Database
- Investor Presentations

Step 4 - Data Triangulation
Involves using different sources of information in order to increase the validity of a study
These sources are likely to be stakeholders in a program - participants, other researchers, program staff, other community members, and so on.
Then we put all data in single framework & apply various statistical tools to find out the dynamic on the market.
During the analysis stage, feedback from the stakeholder groups would be compared to determine areas of agreement as well as areas of divergence


