
Key Insights
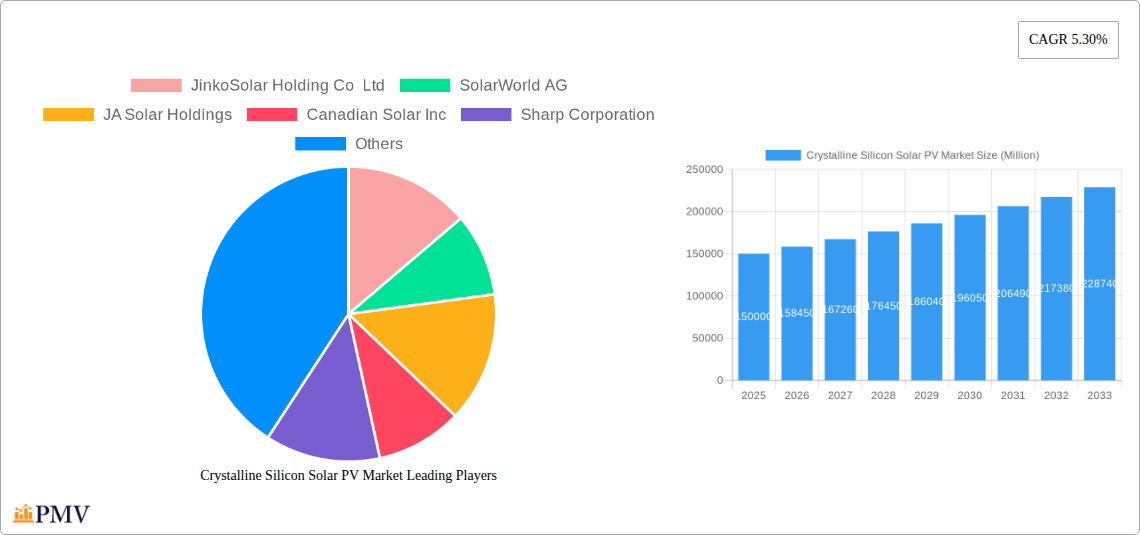
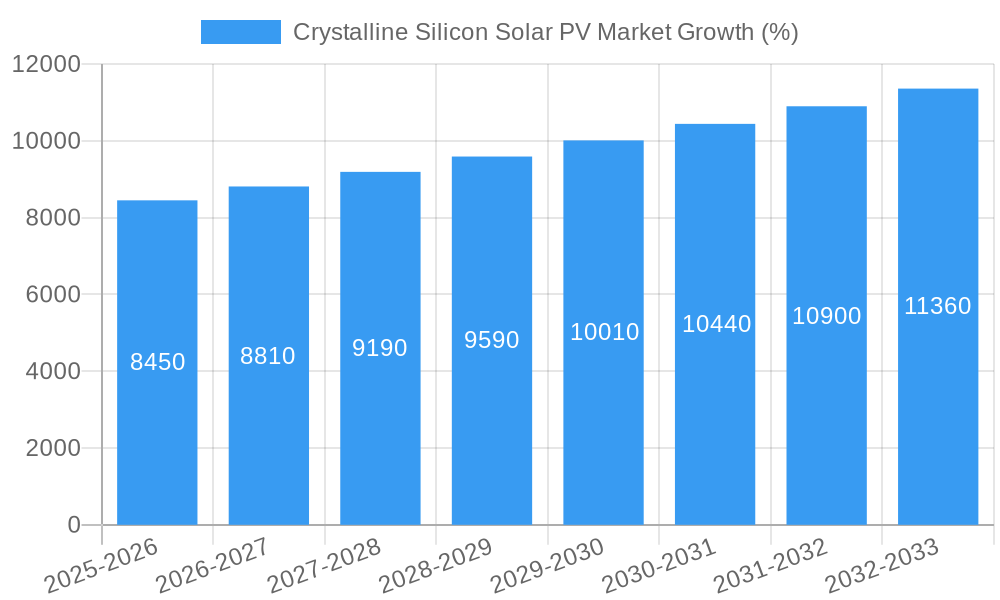
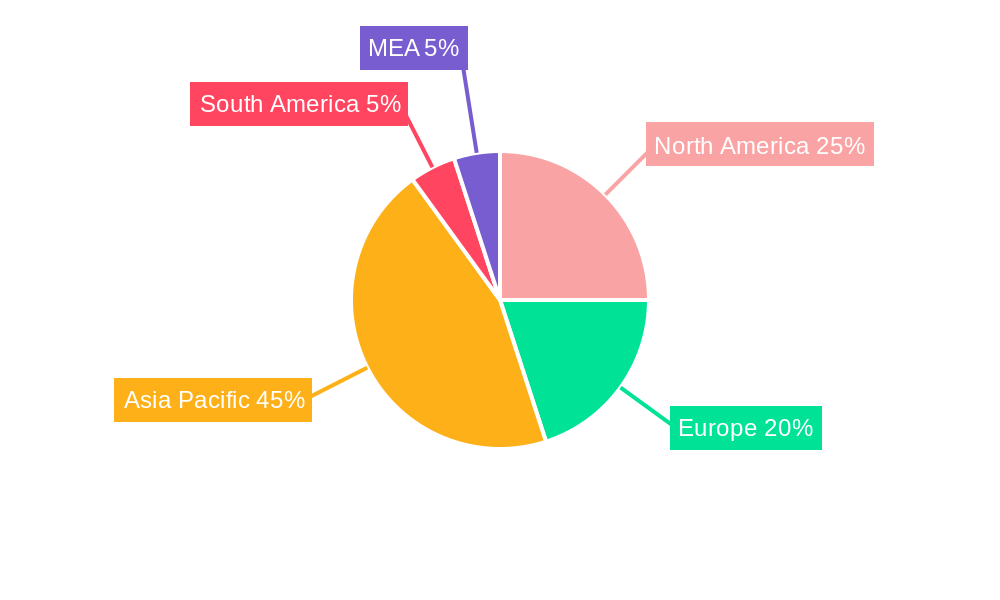
The Crystalline Silicon Solar PV market is experiencing robust growth, driven by increasing global demand for renewable energy sources, supportive government policies promoting solar energy adoption, and decreasing manufacturing costs. The market's 5.30% CAGR indicates a steady upward trajectory, projected to continue through 2033. Mono-crystalline silicon PV cells currently dominate the market due to their higher efficiency, although poly-crystalline cells maintain a significant presence due to their lower cost. The residential segment shows strong growth, fueled by decreasing installation costs and increasing consumer awareness of environmental benefits. However, the utility-scale segment continues to be the largest revenue contributor, driven by large-scale solar farm projects worldwide. Geographical expansion is a key factor; North America and Europe, while mature markets, still present significant opportunities for growth, particularly in distributed generation projects. Meanwhile, rapid growth is projected in the Asia-Pacific region, particularly in China and India, due to substantial government investment and increasing energy demands. Challenges remain, including supply chain disruptions, material price fluctuations, and land acquisition hurdles for large-scale projects. Despite these, the long-term outlook for the Crystalline Silicon Solar PV market remains extremely positive, promising substantial market expansion in the coming years.
The competitive landscape is characterized by a mix of established multinational corporations and emerging regional players. Key players like JinkoSolar, JA Solar, Canadian Solar, and Trina Solar are aggressively expanding their manufacturing capacity and pursuing innovative technological advancements to maintain market share. Strategic partnerships, mergers, and acquisitions are expected to shape the market dynamics further. The increasing adoption of solar energy by commercial and industrial sectors offers substantial potential for revenue growth. Furthermore, technological innovations such as bifacial solar panels and advancements in energy storage solutions are enhancing the market's potential, enabling higher efficiency and better grid integration. The continuous improvement in solar cell technology, coupled with favorable government incentives and declining installation costs, will collectively contribute to the sustained growth of this market.
Crystalline Silicon Solar PV Market: A Comprehensive Report (2019-2033)
This in-depth report provides a comprehensive analysis of the Crystalline Silicon Solar PV market, offering valuable insights for industry stakeholders, investors, and researchers. Covering the period from 2019 to 2033, with 2025 as the base year, this study forecasts market trends and growth opportunities within the rapidly evolving renewable energy sector. The report segments the market by type (Mono-Crystalline, Poly-Crystalline/Multi-Crystalline) and end-user (Commercial, Residential, Utility Scale), providing granular data and detailed analysis for informed decision-making. Expected market value by 2033 is predicted to be xx Million.
Crystalline Silicon Solar PV Market Market Structure & Competitive Dynamics
The Crystalline Silicon Solar PV market exhibits a moderately concentrated structure, with key players holding significant market share. The competitive landscape is characterized by intense rivalry, driven by continuous technological advancements and price pressures. Market concentration is influenced by factors such as economies of scale in manufacturing, access to raw materials, and intellectual property rights. Innovation ecosystems play a crucial role, fostering the development of high-efficiency modules and advanced energy storage solutions. Stringent regulatory frameworks, including environmental standards and grid integration policies, shape market dynamics. Product substitutes, such as thin-film solar technologies, pose a competitive challenge, but crystalline silicon remains dominant due to its established technology, cost-effectiveness, and high efficiency. End-user trends, particularly the growing adoption of solar power in the utility-scale and commercial sectors, significantly influence market growth. The market has seen significant M&A activity in recent years, with deal values exceeding xx Million in the last five years. Key players are consolidating their positions and expanding their market reach through strategic acquisitions.
- Market Share: JinkoSolar, JA Solar, and Trina Solar collectively hold an estimated xx% market share.
- M&A Deal Values: Significant transactions in the past five years indicate a trend towards consolidation within the market, with mergers averaging xx Million in value.
- Regulatory Frameworks: Government policies promoting renewable energy adoption and carbon emission reduction directly impact market growth.
Crystalline Silicon Solar PV Market Industry Trends & Insights
The Crystalline Silicon Solar PV market is experiencing robust growth, driven by several key factors. Increasing concerns about climate change and the urgent need for clean energy solutions are fueling demand for solar power globally. Government incentives, including subsidies, tax breaks, and renewable portfolio standards (RPS), are creating a favorable environment for solar energy adoption. Technological advancements, such as the development of higher-efficiency modules and improved manufacturing processes, have led to a significant reduction in the cost of solar energy, making it increasingly competitive with traditional energy sources. Consumer preferences are shifting towards sustainable energy solutions, driving the adoption of solar PV systems in residential and commercial sectors. Furthermore, the declining cost of energy storage solutions is enhancing the reliability and appeal of solar power. The Compound Annual Growth Rate (CAGR) for the market during the forecast period (2025-2033) is projected to be xx%. Market penetration is expected to reach xx% by 2033, driven by increasing awareness, affordability, and supportive government policies. The competitive dynamics are characterized by intense competition among manufacturers, leading to continuous innovation and cost reductions.
Dominant Markets & Segments in Crystalline Silicon Solar PV Market
The Utility-scale segment dominates the Crystalline Silicon Solar PV market, driven by large-scale projects and government support for renewable energy initiatives. China and the United States remain leading markets, with significant installed capacity. Within the 'By Type' segmentation, Poly-Crystalline/Multi-Crystalline modules hold a larger market share due to their lower cost compared to Mono-Crystalline modules. However, Mono-Crystalline is gaining traction due to its higher efficiency.
- Key Drivers for Utility-Scale Dominance:
- Large-scale government support through subsidies and renewable energy targets.
- Economies of scale in large-scale projects.
- Availability of large land areas for solar farms.
- Key Drivers for China's Dominance:
- Significant government investment in renewable energy infrastructure.
- Large manufacturing capacity and cost competitiveness.
- Strong domestic demand for solar energy.
- Key Drivers for Mono-Crystalline Growth:
- Increasing demand for higher efficiency solar modules
- Advancements in production processes which have reduced cost differentials.
Crystalline Silicon Solar PV Market Product Innovations
Recent years have witnessed significant advancements in crystalline silicon solar PV technology, focusing on enhancing efficiency, durability, and reducing production costs. Innovations include the development of half-cut cells, PERC (Passivated Emitter and Rear Cell) technology, and bifacial modules, all aimed at improving energy conversion efficiency and system performance. These advancements are improving the market fit for various applications, including residential, commercial, and utility-scale projects. The increasing integration of smart features into solar panels, allowing for remote monitoring and optimized energy management, is another important trend, boosting competitiveness and market demand.
Report Segmentation & Scope
This report comprehensively segments the Crystalline Silicon Solar PV market based on type and end-user.
By Type: The market is divided into Mono-Crystalline and Poly-Crystalline/Multi-Crystalline segments. Mono-crystalline is expected to experience faster growth due to its higher efficiency and improved aesthetics. Poly-Crystalline, however, will continue to hold a significant share due to its lower cost. Both segments are projected to experience substantial growth during the forecast period.
By End-User: The market is categorized into residential, commercial, and utility-scale segments. The utility-scale segment is currently the largest, followed by the commercial and residential segments. All segments are expected to experience considerable growth, driven by rising energy demands, government support, and increasing affordability. Competitive dynamics vary across segments, with larger players dominating the utility-scale segment, while smaller players and installers are more active in the residential and commercial segments.
Key Drivers of Crystalline Silicon Solar PV Market Growth
The Crystalline Silicon Solar PV market's growth is fueled by a combination of technological advancements, supportive government policies, and increasing environmental awareness. Technological improvements continue to enhance efficiency and reduce production costs, making solar energy more competitive. Government incentives, such as tax credits and feed-in tariffs, stimulate demand, while growing environmental awareness and the need for sustainable energy sources drive consumer adoption. The decreasing cost of energy storage systems further boosts the appeal and reliability of solar power, expanding its application in various sectors.
Challenges in the Crystalline Silicon Solar PV Market Sector
Several challenges impede the Crystalline Silicon Solar PV market's growth. Intermittency of solar power remains a major concern, requiring effective energy storage solutions. Supply chain disruptions can impact the availability of raw materials and components. Furthermore, land availability, especially for large-scale projects, poses a limitation in certain regions. Strict regulatory frameworks and permitting processes can sometimes delay project implementation. Finally, intense competition among manufacturers puts pressure on pricing and profitability. These factors combine to create a complex and dynamic market landscape.
Leading Players in the Crystalline Silicon Solar PV Market Market
- JinkoSolar Holding Co Ltd
- SolarWorld AG
- JA Solar Holdings
- Canadian Solar Inc
- Sharp Corporation
- Hanwha Q CELLS Co Ltd
- Trina Solar Limited
Key Developments in Crystalline Silicon Solar PV Market Sector
- January 2020: BLD Power Stations Inc. commissioned a 0.673 MW solar PV plant in Nagasaki, Japan, using 280W polycrystalline silicon modules supplied by Ningbo Ulica Solar Science & Technology Co Ltd. This project highlights the growing adoption of solar PV in Japan.
- 2021: Artistic Milliners Pvt Ltd started construction of the 50 MW Saleh Pat Solar PV Park, utilizing 340W polycrystalline silicon modules from JA Solar Holdings Co Ltd. This demonstrates the increasing investment in large-scale solar projects.
Strategic Crystalline Silicon Solar PV Market Market Outlook
The Crystalline Silicon Solar PV market holds immense potential for future growth. Continued technological advancements will drive efficiency gains and cost reductions, further enhancing the competitiveness of solar energy. Government support for renewable energy, coupled with rising environmental concerns, will sustain strong demand. The integration of smart technologies and energy storage solutions will improve the reliability and appeal of solar power. Strategic opportunities exist for companies to innovate in areas such as module design, manufacturing processes, and energy storage, capitalizing on this dynamic and expanding market. The long-term outlook remains positive, with the market poised for significant expansion in the coming years.
Crystalline Silicon Solar PV Market Segmentation
-
1. type
- 1.1. Mono-Crystalline
- 1.2. Poly-Crystalline or Multi Crystalline
-
2. End-User
- 2.1. Commercial
- 2.2. Residential
- 2.3. Utility Scale
Crystalline Silicon Solar PV Market Segmentation By Geography
- 1. North America
- 2. Europe
- 3. Asia Pacific
- 4. South America
- 5. Middle East and Africa
Crystalline Silicon Solar PV Market REPORT HIGHLIGHTS
| Aspects | Details |
|---|---|
| Study Period | 2019-2033 |
| Base Year | 2024 |
| Estimated Year | 2025 |
| Forecast Period | 2025-2033 |
| Historical Period | 2019-2024 |
| Growth Rate | CAGR of 5.30% from 2019-2033 |
| Segmentation |
|
Table of Contents
- 1. Introduction
- 1.1. Research Scope
- 1.2. Market Segmentation
- 1.3. Research Methodology
- 1.4. Definitions and Assumptions
- 2. Executive Summary
- 2.1. Introduction
- 3. Market Dynamics
- 3.1. Introduction
- 3.2. Market Drivers
- 3.2.1. 4.; Increasing Production from Unconventional Sources4.; Growing Energy Demand in the Region
- 3.3. Market Restrains
- 3.3.1. 4.; Environmental Concerns
- 3.4. Market Trends
- 3.4.1. Multi-Crystalline Silicon PV is Expected to Dominate the Market
- 4. Market Factor Analysis
- 4.1. Porters Five Forces
- 4.2. Supply/Value Chain
- 4.3. PESTEL analysis
- 4.4. Market Entropy
- 4.5. Patent/Trademark Analysis
- 5. Global Crystalline Silicon Solar PV Market Analysis, Insights and Forecast, 2019-2031
- 5.1. Market Analysis, Insights and Forecast - by type
- 5.1.1. Mono-Crystalline
- 5.1.2. Poly-Crystalline or Multi Crystalline
- 5.2. Market Analysis, Insights and Forecast - by End-User
- 5.2.1. Commercial
- 5.2.2. Residential
- 5.2.3. Utility Scale
- 5.3. Market Analysis, Insights and Forecast - by Region
- 5.3.1. North America
- 5.3.2. Europe
- 5.3.3. Asia Pacific
- 5.3.4. South America
- 5.3.5. Middle East and Africa
- 5.1. Market Analysis, Insights and Forecast - by type
- 6. North America Crystalline Silicon Solar PV Market Analysis, Insights and Forecast, 2019-2031
- 6.1. Market Analysis, Insights and Forecast - by type
- 6.1.1. Mono-Crystalline
- 6.1.2. Poly-Crystalline or Multi Crystalline
- 6.2. Market Analysis, Insights and Forecast - by End-User
- 6.2.1. Commercial
- 6.2.2. Residential
- 6.2.3. Utility Scale
- 6.1. Market Analysis, Insights and Forecast - by type
- 7. Europe Crystalline Silicon Solar PV Market Analysis, Insights and Forecast, 2019-2031
- 7.1. Market Analysis, Insights and Forecast - by type
- 7.1.1. Mono-Crystalline
- 7.1.2. Poly-Crystalline or Multi Crystalline
- 7.2. Market Analysis, Insights and Forecast - by End-User
- 7.2.1. Commercial
- 7.2.2. Residential
- 7.2.3. Utility Scale
- 7.1. Market Analysis, Insights and Forecast - by type
- 8. Asia Pacific Crystalline Silicon Solar PV Market Analysis, Insights and Forecast, 2019-2031
- 8.1. Market Analysis, Insights and Forecast - by type
- 8.1.1. Mono-Crystalline
- 8.1.2. Poly-Crystalline or Multi Crystalline
- 8.2. Market Analysis, Insights and Forecast - by End-User
- 8.2.1. Commercial
- 8.2.2. Residential
- 8.2.3. Utility Scale
- 8.1. Market Analysis, Insights and Forecast - by type
- 9. South America Crystalline Silicon Solar PV Market Analysis, Insights and Forecast, 2019-2031
- 9.1. Market Analysis, Insights and Forecast - by type
- 9.1.1. Mono-Crystalline
- 9.1.2. Poly-Crystalline or Multi Crystalline
- 9.2. Market Analysis, Insights and Forecast - by End-User
- 9.2.1. Commercial
- 9.2.2. Residential
- 9.2.3. Utility Scale
- 9.1. Market Analysis, Insights and Forecast - by type
- 10. Middle East and Africa Crystalline Silicon Solar PV Market Analysis, Insights and Forecast, 2019-2031
- 10.1. Market Analysis, Insights and Forecast - by type
- 10.1.1. Mono-Crystalline
- 10.1.2. Poly-Crystalline or Multi Crystalline
- 10.2. Market Analysis, Insights and Forecast - by End-User
- 10.2.1. Commercial
- 10.2.2. Residential
- 10.2.3. Utility Scale
- 10.1. Market Analysis, Insights and Forecast - by type
- 11. North America Crystalline Silicon Solar PV Market Analysis, Insights and Forecast, 2019-2031
- 11.1. Market Analysis, Insights and Forecast - By Country/Sub-region
- 11.1.1 United States
- 11.1.2 Canada
- 11.1.3 Mexico
- 12. Europe Crystalline Silicon Solar PV Market Analysis, Insights and Forecast, 2019-2031
- 12.1. Market Analysis, Insights and Forecast - By Country/Sub-region
- 12.1.1 Germany
- 12.1.2 United Kingdom
- 12.1.3 France
- 12.1.4 Spain
- 12.1.5 Italy
- 12.1.6 Spain
- 12.1.7 Belgium
- 12.1.8 Netherland
- 12.1.9 Nordics
- 12.1.10 Rest of Europe
- 13. Asia Pacific Crystalline Silicon Solar PV Market Analysis, Insights and Forecast, 2019-2031
- 13.1. Market Analysis, Insights and Forecast - By Country/Sub-region
- 13.1.1 China
- 13.1.2 Japan
- 13.1.3 India
- 13.1.4 South Korea
- 13.1.5 Southeast Asia
- 13.1.6 Australia
- 13.1.7 Indonesia
- 13.1.8 Phillipes
- 13.1.9 Singapore
- 13.1.10 Thailandc
- 13.1.11 Rest of Asia Pacific
- 14. South America Crystalline Silicon Solar PV Market Analysis, Insights and Forecast, 2019-2031
- 14.1. Market Analysis, Insights and Forecast - By Country/Sub-region
- 14.1.1 Brazil
- 14.1.2 Argentina
- 14.1.3 Peru
- 14.1.4 Chile
- 14.1.5 Colombia
- 14.1.6 Ecuador
- 14.1.7 Venezuela
- 14.1.8 Rest of South America
- 15. MEA Crystalline Silicon Solar PV Market Analysis, Insights and Forecast, 2019-2031
- 15.1. Market Analysis, Insights and Forecast - By Country/Sub-region
- 15.1.1 United Arab Emirates
- 15.1.2 Saudi Arabia
- 15.1.3 South Africa
- 15.1.4 Rest of Middle East and Africa
- 16. Competitive Analysis
- 16.1. Global Market Share Analysis 2024
- 16.2. Company Profiles
- 16.2.1 JinkoSolar Holding Co Ltd
- 16.2.1.1. Overview
- 16.2.1.2. Products
- 16.2.1.3. SWOT Analysis
- 16.2.1.4. Recent Developments
- 16.2.1.5. Financials (Based on Availability)
- 16.2.2 SolarWorld AG
- 16.2.2.1. Overview
- 16.2.2.2. Products
- 16.2.2.3. SWOT Analysis
- 16.2.2.4. Recent Developments
- 16.2.2.5. Financials (Based on Availability)
- 16.2.3 JA Solar Holdings
- 16.2.3.1. Overview
- 16.2.3.2. Products
- 16.2.3.3. SWOT Analysis
- 16.2.3.4. Recent Developments
- 16.2.3.5. Financials (Based on Availability)
- 16.2.4 Canadian Solar Inc
- 16.2.4.1. Overview
- 16.2.4.2. Products
- 16.2.4.3. SWOT Analysis
- 16.2.4.4. Recent Developments
- 16.2.4.5. Financials (Based on Availability)
- 16.2.5 Sharp Corporation
- 16.2.5.1. Overview
- 16.2.5.2. Products
- 16.2.5.3. SWOT Analysis
- 16.2.5.4. Recent Developments
- 16.2.5.5. Financials (Based on Availability)
- 16.2.6 Hanwha Q CELLS Co Ltd
- 16.2.6.1. Overview
- 16.2.6.2. Products
- 16.2.6.3. SWOT Analysis
- 16.2.6.4. Recent Developments
- 16.2.6.5. Financials (Based on Availability)
- 16.2.7 Trina Solar Limited
- 16.2.7.1. Overview
- 16.2.7.2. Products
- 16.2.7.3. SWOT Analysis
- 16.2.7.4. Recent Developments
- 16.2.7.5. Financials (Based on Availability)
- 16.2.1 JinkoSolar Holding Co Ltd
List of Figures
- Figure 1: Global Crystalline Silicon Solar PV Market Revenue Breakdown (Million, %) by Region 2024 & 2032
- Figure 2: Global Crystalline Silicon Solar PV Market Volume Breakdown (Gigawatt, %) by Region 2024 & 2032
- Figure 3: North America Crystalline Silicon Solar PV Market Revenue (Million), by Country 2024 & 2032
- Figure 4: North America Crystalline Silicon Solar PV Market Volume (Gigawatt), by Country 2024 & 2032
- Figure 5: North America Crystalline Silicon Solar PV Market Revenue Share (%), by Country 2024 & 2032
- Figure 6: North America Crystalline Silicon Solar PV Market Volume Share (%), by Country 2024 & 2032
- Figure 7: Europe Crystalline Silicon Solar PV Market Revenue (Million), by Country 2024 & 2032
- Figure 8: Europe Crystalline Silicon Solar PV Market Volume (Gigawatt), by Country 2024 & 2032
- Figure 9: Europe Crystalline Silicon Solar PV Market Revenue Share (%), by Country 2024 & 2032
- Figure 10: Europe Crystalline Silicon Solar PV Market Volume Share (%), by Country 2024 & 2032
- Figure 11: Asia Pacific Crystalline Silicon Solar PV Market Revenue (Million), by Country 2024 & 2032
- Figure 12: Asia Pacific Crystalline Silicon Solar PV Market Volume (Gigawatt), by Country 2024 & 2032
- Figure 13: Asia Pacific Crystalline Silicon Solar PV Market Revenue Share (%), by Country 2024 & 2032
- Figure 14: Asia Pacific Crystalline Silicon Solar PV Market Volume Share (%), by Country 2024 & 2032
- Figure 15: South America Crystalline Silicon Solar PV Market Revenue (Million), by Country 2024 & 2032
- Figure 16: South America Crystalline Silicon Solar PV Market Volume (Gigawatt), by Country 2024 & 2032
- Figure 17: South America Crystalline Silicon Solar PV Market Revenue Share (%), by Country 2024 & 2032
- Figure 18: South America Crystalline Silicon Solar PV Market Volume Share (%), by Country 2024 & 2032
- Figure 19: MEA Crystalline Silicon Solar PV Market Revenue (Million), by Country 2024 & 2032
- Figure 20: MEA Crystalline Silicon Solar PV Market Volume (Gigawatt), by Country 2024 & 2032
- Figure 21: MEA Crystalline Silicon Solar PV Market Revenue Share (%), by Country 2024 & 2032
- Figure 22: MEA Crystalline Silicon Solar PV Market Volume Share (%), by Country 2024 & 2032
- Figure 23: North America Crystalline Silicon Solar PV Market Revenue (Million), by type 2024 & 2032
- Figure 24: North America Crystalline Silicon Solar PV Market Volume (Gigawatt), by type 2024 & 2032
- Figure 25: North America Crystalline Silicon Solar PV Market Revenue Share (%), by type 2024 & 2032
- Figure 26: North America Crystalline Silicon Solar PV Market Volume Share (%), by type 2024 & 2032
- Figure 27: North America Crystalline Silicon Solar PV Market Revenue (Million), by End-User 2024 & 2032
- Figure 28: North America Crystalline Silicon Solar PV Market Volume (Gigawatt), by End-User 2024 & 2032
- Figure 29: North America Crystalline Silicon Solar PV Market Revenue Share (%), by End-User 2024 & 2032
- Figure 30: North America Crystalline Silicon Solar PV Market Volume Share (%), by End-User 2024 & 2032
- Figure 31: North America Crystalline Silicon Solar PV Market Revenue (Million), by Country 2024 & 2032
- Figure 32: North America Crystalline Silicon Solar PV Market Volume (Gigawatt), by Country 2024 & 2032
- Figure 33: North America Crystalline Silicon Solar PV Market Revenue Share (%), by Country 2024 & 2032
- Figure 34: North America Crystalline Silicon Solar PV Market Volume Share (%), by Country 2024 & 2032
- Figure 35: Europe Crystalline Silicon Solar PV Market Revenue (Million), by type 2024 & 2032
- Figure 36: Europe Crystalline Silicon Solar PV Market Volume (Gigawatt), by type 2024 & 2032
- Figure 37: Europe Crystalline Silicon Solar PV Market Revenue Share (%), by type 2024 & 2032
- Figure 38: Europe Crystalline Silicon Solar PV Market Volume Share (%), by type 2024 & 2032
- Figure 39: Europe Crystalline Silicon Solar PV Market Revenue (Million), by End-User 2024 & 2032
- Figure 40: Europe Crystalline Silicon Solar PV Market Volume (Gigawatt), by End-User 2024 & 2032
- Figure 41: Europe Crystalline Silicon Solar PV Market Revenue Share (%), by End-User 2024 & 2032
- Figure 42: Europe Crystalline Silicon Solar PV Market Volume Share (%), by End-User 2024 & 2032
- Figure 43: Europe Crystalline Silicon Solar PV Market Revenue (Million), by Country 2024 & 2032
- Figure 44: Europe Crystalline Silicon Solar PV Market Volume (Gigawatt), by Country 2024 & 2032
- Figure 45: Europe Crystalline Silicon Solar PV Market Revenue Share (%), by Country 2024 & 2032
- Figure 46: Europe Crystalline Silicon Solar PV Market Volume Share (%), by Country 2024 & 2032
- Figure 47: Asia Pacific Crystalline Silicon Solar PV Market Revenue (Million), by type 2024 & 2032
- Figure 48: Asia Pacific Crystalline Silicon Solar PV Market Volume (Gigawatt), by type 2024 & 2032
- Figure 49: Asia Pacific Crystalline Silicon Solar PV Market Revenue Share (%), by type 2024 & 2032
- Figure 50: Asia Pacific Crystalline Silicon Solar PV Market Volume Share (%), by type 2024 & 2032
- Figure 51: Asia Pacific Crystalline Silicon Solar PV Market Revenue (Million), by End-User 2024 & 2032
- Figure 52: Asia Pacific Crystalline Silicon Solar PV Market Volume (Gigawatt), by End-User 2024 & 2032
- Figure 53: Asia Pacific Crystalline Silicon Solar PV Market Revenue Share (%), by End-User 2024 & 2032
- Figure 54: Asia Pacific Crystalline Silicon Solar PV Market Volume Share (%), by End-User 2024 & 2032
- Figure 55: Asia Pacific Crystalline Silicon Solar PV Market Revenue (Million), by Country 2024 & 2032
- Figure 56: Asia Pacific Crystalline Silicon Solar PV Market Volume (Gigawatt), by Country 2024 & 2032
- Figure 57: Asia Pacific Crystalline Silicon Solar PV Market Revenue Share (%), by Country 2024 & 2032
- Figure 58: Asia Pacific Crystalline Silicon Solar PV Market Volume Share (%), by Country 2024 & 2032
- Figure 59: South America Crystalline Silicon Solar PV Market Revenue (Million), by type 2024 & 2032
- Figure 60: South America Crystalline Silicon Solar PV Market Volume (Gigawatt), by type 2024 & 2032
- Figure 61: South America Crystalline Silicon Solar PV Market Revenue Share (%), by type 2024 & 2032
- Figure 62: South America Crystalline Silicon Solar PV Market Volume Share (%), by type 2024 & 2032
- Figure 63: South America Crystalline Silicon Solar PV Market Revenue (Million), by End-User 2024 & 2032
- Figure 64: South America Crystalline Silicon Solar PV Market Volume (Gigawatt), by End-User 2024 & 2032
- Figure 65: South America Crystalline Silicon Solar PV Market Revenue Share (%), by End-User 2024 & 2032
- Figure 66: South America Crystalline Silicon Solar PV Market Volume Share (%), by End-User 2024 & 2032
- Figure 67: South America Crystalline Silicon Solar PV Market Revenue (Million), by Country 2024 & 2032
- Figure 68: South America Crystalline Silicon Solar PV Market Volume (Gigawatt), by Country 2024 & 2032
- Figure 69: South America Crystalline Silicon Solar PV Market Revenue Share (%), by Country 2024 & 2032
- Figure 70: South America Crystalline Silicon Solar PV Market Volume Share (%), by Country 2024 & 2032
- Figure 71: Middle East and Africa Crystalline Silicon Solar PV Market Revenue (Million), by type 2024 & 2032
- Figure 72: Middle East and Africa Crystalline Silicon Solar PV Market Volume (Gigawatt), by type 2024 & 2032
- Figure 73: Middle East and Africa Crystalline Silicon Solar PV Market Revenue Share (%), by type 2024 & 2032
- Figure 74: Middle East and Africa Crystalline Silicon Solar PV Market Volume Share (%), by type 2024 & 2032
- Figure 75: Middle East and Africa Crystalline Silicon Solar PV Market Revenue (Million), by End-User 2024 & 2032
- Figure 76: Middle East and Africa Crystalline Silicon Solar PV Market Volume (Gigawatt), by End-User 2024 & 2032
- Figure 77: Middle East and Africa Crystalline Silicon Solar PV Market Revenue Share (%), by End-User 2024 & 2032
- Figure 78: Middle East and Africa Crystalline Silicon Solar PV Market Volume Share (%), by End-User 2024 & 2032
- Figure 79: Middle East and Africa Crystalline Silicon Solar PV Market Revenue (Million), by Country 2024 & 2032
- Figure 80: Middle East and Africa Crystalline Silicon Solar PV Market Volume (Gigawatt), by Country 2024 & 2032
- Figure 81: Middle East and Africa Crystalline Silicon Solar PV Market Revenue Share (%), by Country 2024 & 2032
- Figure 82: Middle East and Africa Crystalline Silicon Solar PV Market Volume Share (%), by Country 2024 & 2032
List of Tables
- Table 1: Global Crystalline Silicon Solar PV Market Revenue Million Forecast, by Region 2019 & 2032
- Table 2: Global Crystalline Silicon Solar PV Market Volume Gigawatt Forecast, by Region 2019 & 2032
- Table 3: Global Crystalline Silicon Solar PV Market Revenue Million Forecast, by type 2019 & 2032
- Table 4: Global Crystalline Silicon Solar PV Market Volume Gigawatt Forecast, by type 2019 & 2032
- Table 5: Global Crystalline Silicon Solar PV Market Revenue Million Forecast, by End-User 2019 & 2032
- Table 6: Global Crystalline Silicon Solar PV Market Volume Gigawatt Forecast, by End-User 2019 & 2032
- Table 7: Global Crystalline Silicon Solar PV Market Revenue Million Forecast, by Region 2019 & 2032
- Table 8: Global Crystalline Silicon Solar PV Market Volume Gigawatt Forecast, by Region 2019 & 2032
- Table 9: Global Crystalline Silicon Solar PV Market Revenue Million Forecast, by Country 2019 & 2032
- Table 10: Global Crystalline Silicon Solar PV Market Volume Gigawatt Forecast, by Country 2019 & 2032
- Table 11: United States Crystalline Silicon Solar PV Market Revenue (Million) Forecast, by Application 2019 & 2032
- Table 12: United States Crystalline Silicon Solar PV Market Volume (Gigawatt) Forecast, by Application 2019 & 2032
- Table 13: Canada Crystalline Silicon Solar PV Market Revenue (Million) Forecast, by Application 2019 & 2032
- Table 14: Canada Crystalline Silicon Solar PV Market Volume (Gigawatt) Forecast, by Application 2019 & 2032
- Table 15: Mexico Crystalline Silicon Solar PV Market Revenue (Million) Forecast, by Application 2019 & 2032
- Table 16: Mexico Crystalline Silicon Solar PV Market Volume (Gigawatt) Forecast, by Application 2019 & 2032
- Table 17: Global Crystalline Silicon Solar PV Market Revenue Million Forecast, by Country 2019 & 2032
- Table 18: Global Crystalline Silicon Solar PV Market Volume Gigawatt Forecast, by Country 2019 & 2032
- Table 19: Germany Crystalline Silicon Solar PV Market Revenue (Million) Forecast, by Application 2019 & 2032
- Table 20: Germany Crystalline Silicon Solar PV Market Volume (Gigawatt) Forecast, by Application 2019 & 2032
- Table 21: United Kingdom Crystalline Silicon Solar PV Market Revenue (Million) Forecast, by Application 2019 & 2032
- Table 22: United Kingdom Crystalline Silicon Solar PV Market Volume (Gigawatt) Forecast, by Application 2019 & 2032
- Table 23: France Crystalline Silicon Solar PV Market Revenue (Million) Forecast, by Application 2019 & 2032
- Table 24: France Crystalline Silicon Solar PV Market Volume (Gigawatt) Forecast, by Application 2019 & 2032
- Table 25: Spain Crystalline Silicon Solar PV Market Revenue (Million) Forecast, by Application 2019 & 2032
- Table 26: Spain Crystalline Silicon Solar PV Market Volume (Gigawatt) Forecast, by Application 2019 & 2032
- Table 27: Italy Crystalline Silicon Solar PV Market Revenue (Million) Forecast, by Application 2019 & 2032
- Table 28: Italy Crystalline Silicon Solar PV Market Volume (Gigawatt) Forecast, by Application 2019 & 2032
- Table 29: Spain Crystalline Silicon Solar PV Market Revenue (Million) Forecast, by Application 2019 & 2032
- Table 30: Spain Crystalline Silicon Solar PV Market Volume (Gigawatt) Forecast, by Application 2019 & 2032
- Table 31: Belgium Crystalline Silicon Solar PV Market Revenue (Million) Forecast, by Application 2019 & 2032
- Table 32: Belgium Crystalline Silicon Solar PV Market Volume (Gigawatt) Forecast, by Application 2019 & 2032
- Table 33: Netherland Crystalline Silicon Solar PV Market Revenue (Million) Forecast, by Application 2019 & 2032
- Table 34: Netherland Crystalline Silicon Solar PV Market Volume (Gigawatt) Forecast, by Application 2019 & 2032
- Table 35: Nordics Crystalline Silicon Solar PV Market Revenue (Million) Forecast, by Application 2019 & 2032
- Table 36: Nordics Crystalline Silicon Solar PV Market Volume (Gigawatt) Forecast, by Application 2019 & 2032
- Table 37: Rest of Europe Crystalline Silicon Solar PV Market Revenue (Million) Forecast, by Application 2019 & 2032
- Table 38: Rest of Europe Crystalline Silicon Solar PV Market Volume (Gigawatt) Forecast, by Application 2019 & 2032
- Table 39: Global Crystalline Silicon Solar PV Market Revenue Million Forecast, by Country 2019 & 2032
- Table 40: Global Crystalline Silicon Solar PV Market Volume Gigawatt Forecast, by Country 2019 & 2032
- Table 41: China Crystalline Silicon Solar PV Market Revenue (Million) Forecast, by Application 2019 & 2032
- Table 42: China Crystalline Silicon Solar PV Market Volume (Gigawatt) Forecast, by Application 2019 & 2032
- Table 43: Japan Crystalline Silicon Solar PV Market Revenue (Million) Forecast, by Application 2019 & 2032
- Table 44: Japan Crystalline Silicon Solar PV Market Volume (Gigawatt) Forecast, by Application 2019 & 2032
- Table 45: India Crystalline Silicon Solar PV Market Revenue (Million) Forecast, by Application 2019 & 2032
- Table 46: India Crystalline Silicon Solar PV Market Volume (Gigawatt) Forecast, by Application 2019 & 2032
- Table 47: South Korea Crystalline Silicon Solar PV Market Revenue (Million) Forecast, by Application 2019 & 2032
- Table 48: South Korea Crystalline Silicon Solar PV Market Volume (Gigawatt) Forecast, by Application 2019 & 2032
- Table 49: Southeast Asia Crystalline Silicon Solar PV Market Revenue (Million) Forecast, by Application 2019 & 2032
- Table 50: Southeast Asia Crystalline Silicon Solar PV Market Volume (Gigawatt) Forecast, by Application 2019 & 2032
- Table 51: Australia Crystalline Silicon Solar PV Market Revenue (Million) Forecast, by Application 2019 & 2032
- Table 52: Australia Crystalline Silicon Solar PV Market Volume (Gigawatt) Forecast, by Application 2019 & 2032
- Table 53: Indonesia Crystalline Silicon Solar PV Market Revenue (Million) Forecast, by Application 2019 & 2032
- Table 54: Indonesia Crystalline Silicon Solar PV Market Volume (Gigawatt) Forecast, by Application 2019 & 2032
- Table 55: Phillipes Crystalline Silicon Solar PV Market Revenue (Million) Forecast, by Application 2019 & 2032
- Table 56: Phillipes Crystalline Silicon Solar PV Market Volume (Gigawatt) Forecast, by Application 2019 & 2032
- Table 57: Singapore Crystalline Silicon Solar PV Market Revenue (Million) Forecast, by Application 2019 & 2032
- Table 58: Singapore Crystalline Silicon Solar PV Market Volume (Gigawatt) Forecast, by Application 2019 & 2032
- Table 59: Thailandc Crystalline Silicon Solar PV Market Revenue (Million) Forecast, by Application 2019 & 2032
- Table 60: Thailandc Crystalline Silicon Solar PV Market Volume (Gigawatt) Forecast, by Application 2019 & 2032
- Table 61: Rest of Asia Pacific Crystalline Silicon Solar PV Market Revenue (Million) Forecast, by Application 2019 & 2032
- Table 62: Rest of Asia Pacific Crystalline Silicon Solar PV Market Volume (Gigawatt) Forecast, by Application 2019 & 2032
- Table 63: Global Crystalline Silicon Solar PV Market Revenue Million Forecast, by Country 2019 & 2032
- Table 64: Global Crystalline Silicon Solar PV Market Volume Gigawatt Forecast, by Country 2019 & 2032
- Table 65: Brazil Crystalline Silicon Solar PV Market Revenue (Million) Forecast, by Application 2019 & 2032
- Table 66: Brazil Crystalline Silicon Solar PV Market Volume (Gigawatt) Forecast, by Application 2019 & 2032
- Table 67: Argentina Crystalline Silicon Solar PV Market Revenue (Million) Forecast, by Application 2019 & 2032
- Table 68: Argentina Crystalline Silicon Solar PV Market Volume (Gigawatt) Forecast, by Application 2019 & 2032
- Table 69: Peru Crystalline Silicon Solar PV Market Revenue (Million) Forecast, by Application 2019 & 2032
- Table 70: Peru Crystalline Silicon Solar PV Market Volume (Gigawatt) Forecast, by Application 2019 & 2032
- Table 71: Chile Crystalline Silicon Solar PV Market Revenue (Million) Forecast, by Application 2019 & 2032
- Table 72: Chile Crystalline Silicon Solar PV Market Volume (Gigawatt) Forecast, by Application 2019 & 2032
- Table 73: Colombia Crystalline Silicon Solar PV Market Revenue (Million) Forecast, by Application 2019 & 2032
- Table 74: Colombia Crystalline Silicon Solar PV Market Volume (Gigawatt) Forecast, by Application 2019 & 2032
- Table 75: Ecuador Crystalline Silicon Solar PV Market Revenue (Million) Forecast, by Application 2019 & 2032
- Table 76: Ecuador Crystalline Silicon Solar PV Market Volume (Gigawatt) Forecast, by Application 2019 & 2032
- Table 77: Venezuela Crystalline Silicon Solar PV Market Revenue (Million) Forecast, by Application 2019 & 2032
- Table 78: Venezuela Crystalline Silicon Solar PV Market Volume (Gigawatt) Forecast, by Application 2019 & 2032
- Table 79: Rest of South America Crystalline Silicon Solar PV Market Revenue (Million) Forecast, by Application 2019 & 2032
- Table 80: Rest of South America Crystalline Silicon Solar PV Market Volume (Gigawatt) Forecast, by Application 2019 & 2032
- Table 81: Global Crystalline Silicon Solar PV Market Revenue Million Forecast, by Country 2019 & 2032
- Table 82: Global Crystalline Silicon Solar PV Market Volume Gigawatt Forecast, by Country 2019 & 2032
- Table 83: United Arab Emirates Crystalline Silicon Solar PV Market Revenue (Million) Forecast, by Application 2019 & 2032
- Table 84: United Arab Emirates Crystalline Silicon Solar PV Market Volume (Gigawatt) Forecast, by Application 2019 & 2032
- Table 85: Saudi Arabia Crystalline Silicon Solar PV Market Revenue (Million) Forecast, by Application 2019 & 2032
- Table 86: Saudi Arabia Crystalline Silicon Solar PV Market Volume (Gigawatt) Forecast, by Application 2019 & 2032
- Table 87: South Africa Crystalline Silicon Solar PV Market Revenue (Million) Forecast, by Application 2019 & 2032
- Table 88: South Africa Crystalline Silicon Solar PV Market Volume (Gigawatt) Forecast, by Application 2019 & 2032
- Table 89: Rest of Middle East and Africa Crystalline Silicon Solar PV Market Revenue (Million) Forecast, by Application 2019 & 2032
- Table 90: Rest of Middle East and Africa Crystalline Silicon Solar PV Market Volume (Gigawatt) Forecast, by Application 2019 & 2032
- Table 91: Global Crystalline Silicon Solar PV Market Revenue Million Forecast, by type 2019 & 2032
- Table 92: Global Crystalline Silicon Solar PV Market Volume Gigawatt Forecast, by type 2019 & 2032
- Table 93: Global Crystalline Silicon Solar PV Market Revenue Million Forecast, by End-User 2019 & 2032
- Table 94: Global Crystalline Silicon Solar PV Market Volume Gigawatt Forecast, by End-User 2019 & 2032
- Table 95: Global Crystalline Silicon Solar PV Market Revenue Million Forecast, by Country 2019 & 2032
- Table 96: Global Crystalline Silicon Solar PV Market Volume Gigawatt Forecast, by Country 2019 & 2032
- Table 97: Global Crystalline Silicon Solar PV Market Revenue Million Forecast, by type 2019 & 2032
- Table 98: Global Crystalline Silicon Solar PV Market Volume Gigawatt Forecast, by type 2019 & 2032
- Table 99: Global Crystalline Silicon Solar PV Market Revenue Million Forecast, by End-User 2019 & 2032
- Table 100: Global Crystalline Silicon Solar PV Market Volume Gigawatt Forecast, by End-User 2019 & 2032
- Table 101: Global Crystalline Silicon Solar PV Market Revenue Million Forecast, by Country 2019 & 2032
- Table 102: Global Crystalline Silicon Solar PV Market Volume Gigawatt Forecast, by Country 2019 & 2032
- Table 103: Global Crystalline Silicon Solar PV Market Revenue Million Forecast, by type 2019 & 2032
- Table 104: Global Crystalline Silicon Solar PV Market Volume Gigawatt Forecast, by type 2019 & 2032
- Table 105: Global Crystalline Silicon Solar PV Market Revenue Million Forecast, by End-User 2019 & 2032
- Table 106: Global Crystalline Silicon Solar PV Market Volume Gigawatt Forecast, by End-User 2019 & 2032
- Table 107: Global Crystalline Silicon Solar PV Market Revenue Million Forecast, by Country 2019 & 2032
- Table 108: Global Crystalline Silicon Solar PV Market Volume Gigawatt Forecast, by Country 2019 & 2032
- Table 109: Global Crystalline Silicon Solar PV Market Revenue Million Forecast, by type 2019 & 2032
- Table 110: Global Crystalline Silicon Solar PV Market Volume Gigawatt Forecast, by type 2019 & 2032
- Table 111: Global Crystalline Silicon Solar PV Market Revenue Million Forecast, by End-User 2019 & 2032
- Table 112: Global Crystalline Silicon Solar PV Market Volume Gigawatt Forecast, by End-User 2019 & 2032
- Table 113: Global Crystalline Silicon Solar PV Market Revenue Million Forecast, by Country 2019 & 2032
- Table 114: Global Crystalline Silicon Solar PV Market Volume Gigawatt Forecast, by Country 2019 & 2032
- Table 115: Global Crystalline Silicon Solar PV Market Revenue Million Forecast, by type 2019 & 2032
- Table 116: Global Crystalline Silicon Solar PV Market Volume Gigawatt Forecast, by type 2019 & 2032
- Table 117: Global Crystalline Silicon Solar PV Market Revenue Million Forecast, by End-User 2019 & 2032
- Table 118: Global Crystalline Silicon Solar PV Market Volume Gigawatt Forecast, by End-User 2019 & 2032
- Table 119: Global Crystalline Silicon Solar PV Market Revenue Million Forecast, by Country 2019 & 2032
- Table 120: Global Crystalline Silicon Solar PV Market Volume Gigawatt Forecast, by Country 2019 & 2032
Frequently Asked Questions
1. What is the projected Compound Annual Growth Rate (CAGR) of the Crystalline Silicon Solar PV Market?
The projected CAGR is approximately 5.30%.
2. Which companies are prominent players in the Crystalline Silicon Solar PV Market?
Key companies in the market include JinkoSolar Holding Co Ltd, SolarWorld AG, JA Solar Holdings, Canadian Solar Inc, Sharp Corporation, Hanwha Q CELLS Co Ltd, Trina Solar Limited.
3. What are the main segments of the Crystalline Silicon Solar PV Market?
The market segments include type, End-User.
4. Can you provide details about the market size?
The market size is estimated to be USD XX Million as of 2022.
5. What are some drivers contributing to market growth?
4.; Increasing Production from Unconventional Sources4.; Growing Energy Demand in the Region.
6. What are the notable trends driving market growth?
Multi-Crystalline Silicon PV is Expected to Dominate the Market.
7. Are there any restraints impacting market growth?
4.; Environmental Concerns.
8. Can you provide examples of recent developments in the market?
In January 2020, BLD Power Stations Inc has commissioned 0.673 MW solar photovoltaic plant in Nagasaki, Japan. Ningbo Ulica Solar Science & Technology Co Ltd has supplied 280W polycrystalline silicon solar modules for this project.
9. What pricing options are available for accessing the report?
Pricing options include single-user, multi-user, and enterprise licenses priced at USD 4750, USD 5250, and USD 8750 respectively.
10. Is the market size provided in terms of value or volume?
The market size is provided in terms of value, measured in Million and volume, measured in Gigawatt.
11. Are there any specific market keywords associated with the report?
Yes, the market keyword associated with the report is "Crystalline Silicon Solar PV Market," which aids in identifying and referencing the specific market segment covered.
12. How do I determine which pricing option suits my needs best?
The pricing options vary based on user requirements and access needs. Individual users may opt for single-user licenses, while businesses requiring broader access may choose multi-user or enterprise licenses for cost-effective access to the report.
13. Are there any additional resources or data provided in the Crystalline Silicon Solar PV Market report?
While the report offers comprehensive insights, it's advisable to review the specific contents or supplementary materials provided to ascertain if additional resources or data are available.
14. How can I stay updated on further developments or reports in the Crystalline Silicon Solar PV Market?
To stay informed about further developments, trends, and reports in the Crystalline Silicon Solar PV Market, consider subscribing to industry newsletters, following relevant companies and organizations, or regularly checking reputable industry news sources and publications.
Methodology
Step 1 - Identification of Relevant Samples Size from Population Database


Step 2 - Approaches for Defining Global Market Size (Value, Volume* & Price*)

Note*: In applicable scenarios
Step 3 - Data Sources
Primary Research
- Web Analytics
- Survey Reports
- Research Institute
- Latest Research Reports
- Opinion Leaders
Secondary Research
- Annual Reports
- White Paper
- Latest Press Release
- Industry Association
- Paid Database
- Investor Presentations

Step 4 - Data Triangulation
Involves using different sources of information in order to increase the validity of a study
These sources are likely to be stakeholders in a program - participants, other researchers, program staff, other community members, and so on.
Then we put all data in single framework & apply various statistical tools to find out the dynamic on the market.
During the analysis stage, feedback from the stakeholder groups would be compared to determine areas of agreement as well as areas of divergence


