


Key Insights
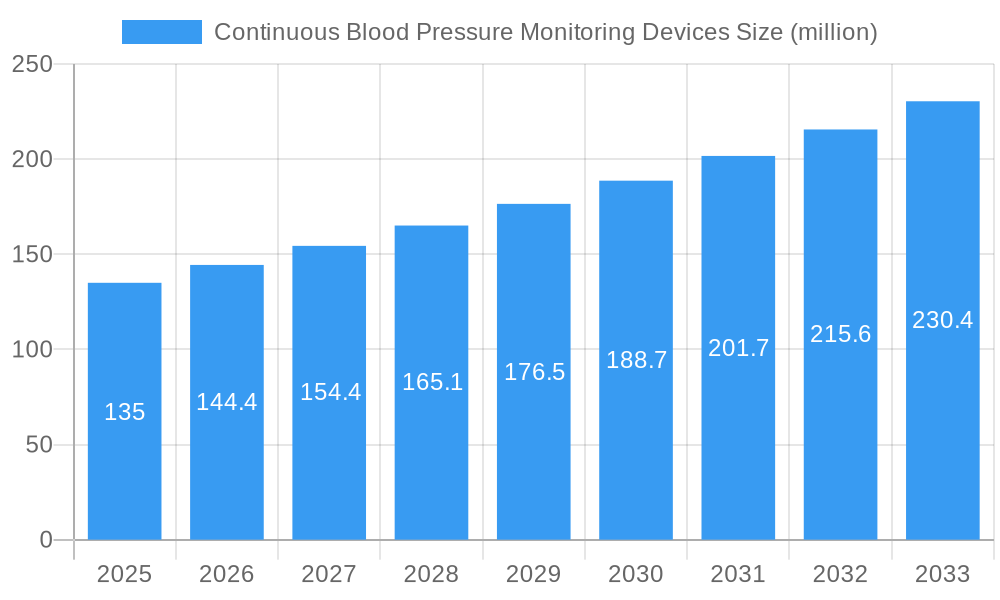
The global market for Continuous Blood Pressure Monitoring (CBPM) devices is experiencing robust growth, projected to reach a value of $135 million in 2025, expanding at a Compound Annual Growth Rate (CAGR) of 7.1% from 2025 to 2033. This expansion is fueled by several key drivers. The increasing prevalence of chronic diseases like hypertension and cardiovascular diseases necessitates continuous and accurate blood pressure monitoring for effective diagnosis and treatment management. Technological advancements leading to the development of more accurate, portable, and user-friendly CBPM devices are further contributing to market growth. Growing demand for remote patient monitoring (RPM) solutions, particularly amongst aging populations and those with limited mobility, is also significantly impacting market expansion. Moreover, the rising adoption of minimally invasive procedures and the increasing emphasis on preventative healthcare are boosting demand for these devices across various healthcare settings, including hospitals, clinics, and home care environments.
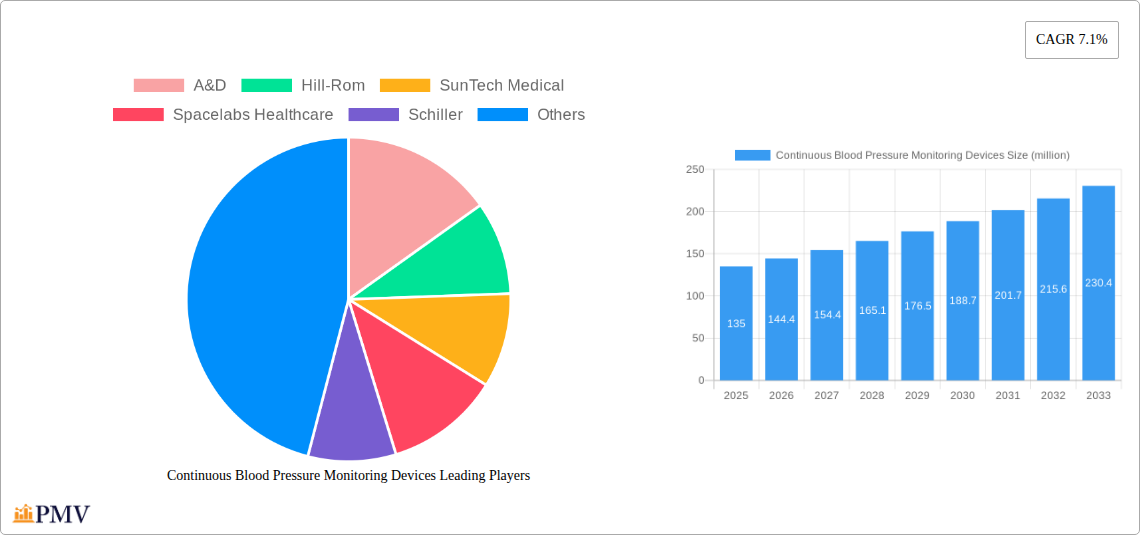
Continuous Blood Pressure Monitoring Devices Market Size (In Million)

The market's growth trajectory is, however, influenced by certain restraining factors. High initial costs associated with acquiring CBPM devices can limit accessibility, particularly in low-resource settings. The need for skilled professionals to operate and interpret data generated by these devices presents another challenge. Furthermore, regulatory hurdles and reimbursement policies can impact market penetration. Despite these challenges, the market is segmented by device type (invasive vs. non-invasive), end-user (hospitals, clinics, homecare), and geography, offering varied opportunities for growth. Key players like A&D, Hill-Rom, SunTech Medical, and others are actively investing in research and development to enhance device features, expand market reach, and capitalize on the growing demand for continuous blood pressure monitoring solutions. The market is anticipated to witness continuous evolution in technology and increased competition, eventually resulting in greater affordability and improved accessibility.
Continuous Blood Pressure Monitoring Devices Company Market Share
Continuous Blood Pressure Monitoring Devices Market Report: 2019-2033
This comprehensive report provides a detailed analysis of the global Continuous Blood Pressure Monitoring Devices market, offering invaluable insights for industry stakeholders, investors, and researchers. The study covers the period 2019-2033, with a focus on the forecast period 2025-2033, using 2025 as the base year and estimated year. The report projects a market value exceeding $XX million by 2033, representing a significant CAGR of XX%.
Continuous Blood Pressure Monitoring Devices Market Structure & Competitive Dynamics
The global Continuous Blood Pressure Monitoring Devices market is characterized by a moderately consolidated structure, with key players holding significant market share. A&D, Hill-Rom, SunTech Medical, and Spacelabs Healthcare are among the leading companies, collectively accounting for an estimated XX% of the market in 2025. Market concentration is influenced by factors such as technological innovation, regulatory approvals, and strategic mergers and acquisitions (M&A). The innovation ecosystem is highly active, with ongoing research and development focusing on improving accuracy, portability, and integration with other healthcare technologies. Regulatory frameworks vary across different geographies, impacting market entry and product approvals. Substitutes, such as intermittent blood pressure monitoring devices, pose a competitive challenge, particularly in low-cost segments. End-user preferences are increasingly shifting towards non-invasive, user-friendly devices with advanced data analysis capabilities. Over the historical period (2019-2024), M&A activity in the sector has been moderate, with deal values totaling approximately $XX million. Future consolidation is anticipated, driven by the pursuit of economies of scale and expanded market reach.
- Market Concentration: Moderately consolidated, with top 4 players holding approximately XX% market share (2025).
- M&A Activity (2019-2024): Total deal value estimated at $XX million.
- Key Innovation Areas: Miniaturization, wireless connectivity, AI-powered data analytics.
- Regulatory Landscape: Varies significantly across regions, impacting product approvals and market entry.
Continuous Blood Pressure Monitoring Devices Industry Trends & Insights
The Continuous Blood Pressure Monitoring Devices market is experiencing robust growth, driven by several key factors. The rising prevalence of chronic conditions like hypertension, coupled with the increasing demand for remote patient monitoring (RPM) solutions, is fueling market expansion. Technological advancements, such as the development of smaller, more accurate, and wearable devices, are further driving market growth. Consumer preference for convenient and user-friendly devices is another crucial factor. Competitive dynamics are shaping the market landscape, with companies investing heavily in research and development to improve product features and expand market reach. The market exhibits a strong focus on integration with electronic health record (EHR) systems and telehealth platforms. The global market is projected to reach $XX million by 2033, with a CAGR of XX% during the forecast period (2025-2033). Market penetration in developed economies is high, but significant growth potential exists in emerging markets.
Dominant Markets & Segments in Continuous Blood Pressure Monitoring Devices
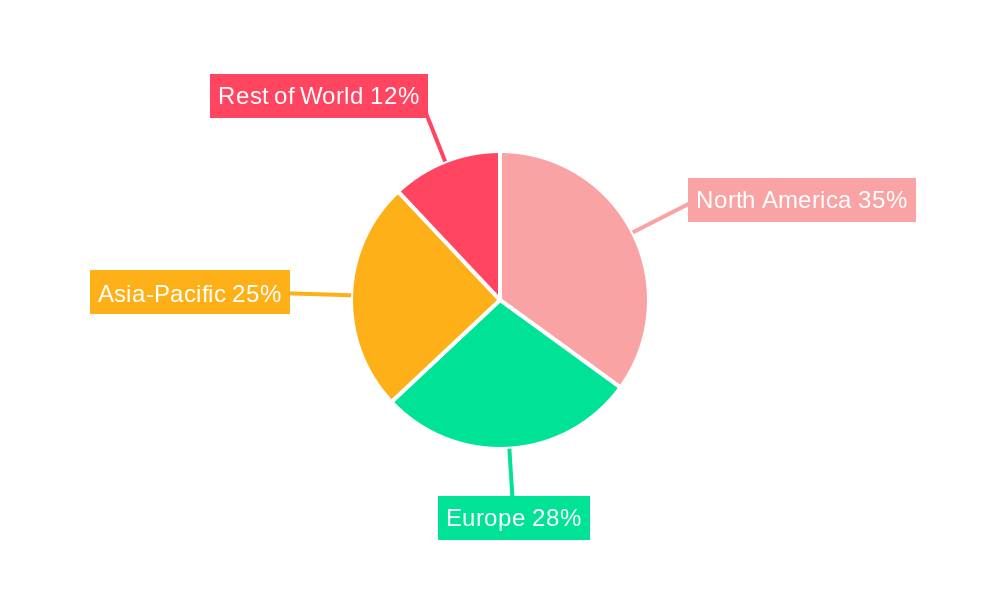
North America currently dominates the Continuous Blood Pressure Monitoring Devices market, driven by factors such as high healthcare expenditure, advanced healthcare infrastructure, and a large aging population. Europe follows as a significant market, with similar drivers but possibly slower growth rates. The strong regulatory frameworks and high adoption rates of innovative technologies in these regions contribute to their dominance. Asia-Pacific is witnessing rapid market expansion, fueled by increasing healthcare awareness, rising disposable incomes, and government initiatives to improve healthcare access.
- North America: High healthcare expenditure, advanced infrastructure, aging population.
- Europe: Strong regulatory frameworks, high adoption of innovative technologies.
- Asia-Pacific: Rising healthcare awareness, increasing disposable incomes, government initiatives.
Continuous Blood Pressure Monitoring Devices Product Innovations
Recent product innovations focus on enhancing accuracy, miniaturization, and integration capabilities. Wireless and wearable devices with advanced data analysis features are gaining popularity. Continuous ambulatory blood pressure monitoring (CBP) systems are becoming increasingly sophisticated, offering improved comfort and ease of use. The integration of artificial intelligence (AI) and machine learning (ML) algorithms is enabling more precise data interpretation and predictive analytics. These innovations improve patient outcomes and streamline healthcare workflows, creating a strong market fit.
Report Segmentation & Scope
The report segments the market by product type (e.g., invasive, non-invasive), application (e.g., hospitals, home care), and end-user (e.g., hospitals, clinics, home users). Each segment’s growth trajectory, market size, and competitive landscape are analyzed in detail, providing a granular understanding of market dynamics. The report also provides regional segmentation, analyzing market performance across key geographical areas. Growth projections are provided for each segment, along with estimations of market sizes for the forecast period.
Key Drivers of Continuous Blood Pressure Monitoring Devices Growth
The growth of the Continuous Blood Pressure Monitoring Devices market is propelled by several key factors. The rising prevalence of hypertension and other cardiovascular diseases is a major driver. Technological advancements, including the development of more accurate and comfortable devices, are also contributing significantly. The increasing adoption of remote patient monitoring and telehealth technologies is further fueling market growth. Government initiatives and healthcare reforms aimed at improving patient outcomes are creating favorable market conditions.
Challenges in the Continuous Blood Pressure Monitoring Devices Sector
The Continuous Blood Pressure Monitoring Devices sector faces certain challenges. High initial costs associated with the devices can limit accessibility, especially in low-income populations. The need for skilled professionals to operate and interpret the data from these devices presents another challenge. Furthermore, stringent regulatory requirements for device approval can slow down market entry and innovation. Supply chain disruptions can also lead to production delays and increased costs.
Leading Players in the Continuous Blood Pressure Monitoring Devices Market
- A&D
- Hill-Rom
- SunTech Medical
- Spacelabs Healthcare
- Schiller
- Bosch + Sohn
- Microlife
- Vasomedical
- Meditech
- Riester
- Mindray
- Suzuken
- HINGMED
Key Developments in Continuous Blood Pressure Monitoring Devices Sector
- January 2023: Company X launches a new generation of wearable continuous blood pressure monitoring device with enhanced accuracy and connectivity features.
- June 2022: Company Y announces a strategic partnership to integrate its device with a leading telehealth platform.
- October 2021: Regulatory approval granted for a new continuous blood pressure monitoring system in the EU.
Strategic Continuous Blood Pressure Monitoring Devices Market Outlook
The future of the Continuous Blood Pressure Monitoring Devices market looks promising, driven by continued technological innovation and growing demand for remote patient monitoring solutions. Strategic partnerships and acquisitions are expected to further consolidate the market. Companies investing in AI and ML-powered diagnostics stand to gain a competitive edge. Expansion into emerging markets will also provide significant growth opportunities. The market is poised for sustained growth, with considerable potential for innovation and market expansion in the coming years.
Continuous Blood Pressure Monitoring Devices Segmentation
-
1. Application
- 1.1. Hospital
- 1.2. Clinic
- 1.3. Others
-
2. Types
- 2.1. Ordinary
- 2.2. Mobile-based
Continuous Blood Pressure Monitoring Devices Segmentation By Geography
-
1. North America
- 1.1. United States
- 1.2. Canada
- 1.3. Mexico
-
2. South America
- 2.1. Brazil
- 2.2. Argentina
- 2.3. Rest of South America
-
3. Europe
- 3.1. United Kingdom
- 3.2. Germany
- 3.3. France
- 3.4. Italy
- 3.5. Spain
- 3.6. Russia
- 3.7. Benelux
- 3.8. Nordics
- 3.9. Rest of Europe
-
4. Middle East & Africa
- 4.1. Turkey
- 4.2. Israel
- 4.3. GCC
- 4.4. North Africa
- 4.5. South Africa
- 4.6. Rest of Middle East & Africa
-
5. Asia Pacific
- 5.1. China
- 5.2. India
- 5.3. Japan
- 5.4. South Korea
- 5.5. ASEAN
- 5.6. Oceania
- 5.7. Rest of Asia Pacific
Continuous Blood Pressure Monitoring Devices Regional Market Share
Geographic Coverage of Continuous Blood Pressure Monitoring Devices
Continuous Blood Pressure Monitoring Devices REPORT HIGHLIGHTS
| Aspects | Details |
|---|---|
| Study Period | 2020-2034 |
| Base Year | 2025 |
| Estimated Year | 2026 |
| Forecast Period | 2026-2034 |
| Historical Period | 2020-2025 |
| Growth Rate | CAGR of 7.1% from 2020-2034 |
| Segmentation |
|
Table of Contents
- 1. Introduction
- 1.1. Research Scope
- 1.2. Market Segmentation
- 1.3. Research Methodology
- 1.4. Definitions and Assumptions
- 2. Executive Summary
- 2.1. Introduction
- 3. Market Dynamics
- 3.1. Introduction
- 3.2. Market Drivers
- 3.3. Market Restrains
- 3.4. Market Trends
- 4. Market Factor Analysis
- 4.1. Porters Five Forces
- 4.2. Supply/Value Chain
- 4.3. PESTEL analysis
- 4.4. Market Entropy
- 4.5. Patent/Trademark Analysis
- 5. Global Continuous Blood Pressure Monitoring Devices Analysis, Insights and Forecast, 2020-2032
- 5.1. Market Analysis, Insights and Forecast - by Application
- 5.1.1. Hospital
- 5.1.2. Clinic
- 5.1.3. Others
- 5.2. Market Analysis, Insights and Forecast - by Types
- 5.2.1. Ordinary
- 5.2.2. Mobile-based
- 5.3. Market Analysis, Insights and Forecast - by Region
- 5.3.1. North America
- 5.3.2. South America
- 5.3.3. Europe
- 5.3.4. Middle East & Africa
- 5.3.5. Asia Pacific
- 5.1. Market Analysis, Insights and Forecast - by Application
- 6. North America Continuous Blood Pressure Monitoring Devices Analysis, Insights and Forecast, 2020-2032
- 6.1. Market Analysis, Insights and Forecast - by Application
- 6.1.1. Hospital
- 6.1.2. Clinic
- 6.1.3. Others
- 6.2. Market Analysis, Insights and Forecast - by Types
- 6.2.1. Ordinary
- 6.2.2. Mobile-based
- 6.1. Market Analysis, Insights and Forecast - by Application
- 7. South America Continuous Blood Pressure Monitoring Devices Analysis, Insights and Forecast, 2020-2032
- 7.1. Market Analysis, Insights and Forecast - by Application
- 7.1.1. Hospital
- 7.1.2. Clinic
- 7.1.3. Others
- 7.2. Market Analysis, Insights and Forecast - by Types
- 7.2.1. Ordinary
- 7.2.2. Mobile-based
- 7.1. Market Analysis, Insights and Forecast - by Application
- 8. Europe Continuous Blood Pressure Monitoring Devices Analysis, Insights and Forecast, 2020-2032
- 8.1. Market Analysis, Insights and Forecast - by Application
- 8.1.1. Hospital
- 8.1.2. Clinic
- 8.1.3. Others
- 8.2. Market Analysis, Insights and Forecast - by Types
- 8.2.1. Ordinary
- 8.2.2. Mobile-based
- 8.1. Market Analysis, Insights and Forecast - by Application
- 9. Middle East & Africa Continuous Blood Pressure Monitoring Devices Analysis, Insights and Forecast, 2020-2032
- 9.1. Market Analysis, Insights and Forecast - by Application
- 9.1.1. Hospital
- 9.1.2. Clinic
- 9.1.3. Others
- 9.2. Market Analysis, Insights and Forecast - by Types
- 9.2.1. Ordinary
- 9.2.2. Mobile-based
- 9.1. Market Analysis, Insights and Forecast - by Application
- 10. Asia Pacific Continuous Blood Pressure Monitoring Devices Analysis, Insights and Forecast, 2020-2032
- 10.1. Market Analysis, Insights and Forecast - by Application
- 10.1.1. Hospital
- 10.1.2. Clinic
- 10.1.3. Others
- 10.2. Market Analysis, Insights and Forecast - by Types
- 10.2.1. Ordinary
- 10.2.2. Mobile-based
- 10.1. Market Analysis, Insights and Forecast - by Application
- 11. Competitive Analysis
- 11.1. Global Market Share Analysis 2025
- 11.2. Company Profiles
- 11.2.1 A&D
- 11.2.1.1. Overview
- 11.2.1.2. Products
- 11.2.1.3. SWOT Analysis
- 11.2.1.4. Recent Developments
- 11.2.1.5. Financials (Based on Availability)
- 11.2.2 Hill-Rom
- 11.2.2.1. Overview
- 11.2.2.2. Products
- 11.2.2.3. SWOT Analysis
- 11.2.2.4. Recent Developments
- 11.2.2.5. Financials (Based on Availability)
- 11.2.3 SunTech Medical
- 11.2.3.1. Overview
- 11.2.3.2. Products
- 11.2.3.3. SWOT Analysis
- 11.2.3.4. Recent Developments
- 11.2.3.5. Financials (Based on Availability)
- 11.2.4 Spacelabs Healthcare
- 11.2.4.1. Overview
- 11.2.4.2. Products
- 11.2.4.3. SWOT Analysis
- 11.2.4.4. Recent Developments
- 11.2.4.5. Financials (Based on Availability)
- 11.2.5 Schiller
- 11.2.5.1. Overview
- 11.2.5.2. Products
- 11.2.5.3. SWOT Analysis
- 11.2.5.4. Recent Developments
- 11.2.5.5. Financials (Based on Availability)
- 11.2.6 Bosch + Sohn
- 11.2.6.1. Overview
- 11.2.6.2. Products
- 11.2.6.3. SWOT Analysis
- 11.2.6.4. Recent Developments
- 11.2.6.5. Financials (Based on Availability)
- 11.2.7 Microlife
- 11.2.7.1. Overview
- 11.2.7.2. Products
- 11.2.7.3. SWOT Analysis
- 11.2.7.4. Recent Developments
- 11.2.7.5. Financials (Based on Availability)
- 11.2.8 Vasomedical
- 11.2.8.1. Overview
- 11.2.8.2. Products
- 11.2.8.3. SWOT Analysis
- 11.2.8.4. Recent Developments
- 11.2.8.5. Financials (Based on Availability)
- 11.2.9 Meditech
- 11.2.9.1. Overview
- 11.2.9.2. Products
- 11.2.9.3. SWOT Analysis
- 11.2.9.4. Recent Developments
- 11.2.9.5. Financials (Based on Availability)
- 11.2.10 Riester
- 11.2.10.1. Overview
- 11.2.10.2. Products
- 11.2.10.3. SWOT Analysis
- 11.2.10.4. Recent Developments
- 11.2.10.5. Financials (Based on Availability)
- 11.2.11 Mindray
- 11.2.11.1. Overview
- 11.2.11.2. Products
- 11.2.11.3. SWOT Analysis
- 11.2.11.4. Recent Developments
- 11.2.11.5. Financials (Based on Availability)
- 11.2.12 Suzuken
- 11.2.12.1. Overview
- 11.2.12.2. Products
- 11.2.12.3. SWOT Analysis
- 11.2.12.4. Recent Developments
- 11.2.12.5. Financials (Based on Availability)
- 11.2.13 HINGMED
- 11.2.13.1. Overview
- 11.2.13.2. Products
- 11.2.13.3. SWOT Analysis
- 11.2.13.4. Recent Developments
- 11.2.13.5. Financials (Based on Availability)
- 11.2.1 A&D
List of Figures
- Figure 1: Global Continuous Blood Pressure Monitoring Devices Revenue Breakdown (million, %) by Region 2025 & 2033
- Figure 2: Global Continuous Blood Pressure Monitoring Devices Volume Breakdown (K, %) by Region 2025 & 2033
- Figure 3: North America Continuous Blood Pressure Monitoring Devices Revenue (million), by Application 2025 & 2033
- Figure 4: North America Continuous Blood Pressure Monitoring Devices Volume (K), by Application 2025 & 2033
- Figure 5: North America Continuous Blood Pressure Monitoring Devices Revenue Share (%), by Application 2025 & 2033
- Figure 6: North America Continuous Blood Pressure Monitoring Devices Volume Share (%), by Application 2025 & 2033
- Figure 7: North America Continuous Blood Pressure Monitoring Devices Revenue (million), by Types 2025 & 2033
- Figure 8: North America Continuous Blood Pressure Monitoring Devices Volume (K), by Types 2025 & 2033
- Figure 9: North America Continuous Blood Pressure Monitoring Devices Revenue Share (%), by Types 2025 & 2033
- Figure 10: North America Continuous Blood Pressure Monitoring Devices Volume Share (%), by Types 2025 & 2033
- Figure 11: North America Continuous Blood Pressure Monitoring Devices Revenue (million), by Country 2025 & 2033
- Figure 12: North America Continuous Blood Pressure Monitoring Devices Volume (K), by Country 2025 & 2033
- Figure 13: North America Continuous Blood Pressure Monitoring Devices Revenue Share (%), by Country 2025 & 2033
- Figure 14: North America Continuous Blood Pressure Monitoring Devices Volume Share (%), by Country 2025 & 2033
- Figure 15: South America Continuous Blood Pressure Monitoring Devices Revenue (million), by Application 2025 & 2033
- Figure 16: South America Continuous Blood Pressure Monitoring Devices Volume (K), by Application 2025 & 2033
- Figure 17: South America Continuous Blood Pressure Monitoring Devices Revenue Share (%), by Application 2025 & 2033
- Figure 18: South America Continuous Blood Pressure Monitoring Devices Volume Share (%), by Application 2025 & 2033
- Figure 19: South America Continuous Blood Pressure Monitoring Devices Revenue (million), by Types 2025 & 2033
- Figure 20: South America Continuous Blood Pressure Monitoring Devices Volume (K), by Types 2025 & 2033
- Figure 21: South America Continuous Blood Pressure Monitoring Devices Revenue Share (%), by Types 2025 & 2033
- Figure 22: South America Continuous Blood Pressure Monitoring Devices Volume Share (%), by Types 2025 & 2033
- Figure 23: South America Continuous Blood Pressure Monitoring Devices Revenue (million), by Country 2025 & 2033
- Figure 24: South America Continuous Blood Pressure Monitoring Devices Volume (K), by Country 2025 & 2033
- Figure 25: South America Continuous Blood Pressure Monitoring Devices Revenue Share (%), by Country 2025 & 2033
- Figure 26: South America Continuous Blood Pressure Monitoring Devices Volume Share (%), by Country 2025 & 2033
- Figure 27: Europe Continuous Blood Pressure Monitoring Devices Revenue (million), by Application 2025 & 2033
- Figure 28: Europe Continuous Blood Pressure Monitoring Devices Volume (K), by Application 2025 & 2033
- Figure 29: Europe Continuous Blood Pressure Monitoring Devices Revenue Share (%), by Application 2025 & 2033
- Figure 30: Europe Continuous Blood Pressure Monitoring Devices Volume Share (%), by Application 2025 & 2033
- Figure 31: Europe Continuous Blood Pressure Monitoring Devices Revenue (million), by Types 2025 & 2033
- Figure 32: Europe Continuous Blood Pressure Monitoring Devices Volume (K), by Types 2025 & 2033
- Figure 33: Europe Continuous Blood Pressure Monitoring Devices Revenue Share (%), by Types 2025 & 2033
- Figure 34: Europe Continuous Blood Pressure Monitoring Devices Volume Share (%), by Types 2025 & 2033
- Figure 35: Europe Continuous Blood Pressure Monitoring Devices Revenue (million), by Country 2025 & 2033
- Figure 36: Europe Continuous Blood Pressure Monitoring Devices Volume (K), by Country 2025 & 2033
- Figure 37: Europe Continuous Blood Pressure Monitoring Devices Revenue Share (%), by Country 2025 & 2033
- Figure 38: Europe Continuous Blood Pressure Monitoring Devices Volume Share (%), by Country 2025 & 2033
- Figure 39: Middle East & Africa Continuous Blood Pressure Monitoring Devices Revenue (million), by Application 2025 & 2033
- Figure 40: Middle East & Africa Continuous Blood Pressure Monitoring Devices Volume (K), by Application 2025 & 2033
- Figure 41: Middle East & Africa Continuous Blood Pressure Monitoring Devices Revenue Share (%), by Application 2025 & 2033
- Figure 42: Middle East & Africa Continuous Blood Pressure Monitoring Devices Volume Share (%), by Application 2025 & 2033
- Figure 43: Middle East & Africa Continuous Blood Pressure Monitoring Devices Revenue (million), by Types 2025 & 2033
- Figure 44: Middle East & Africa Continuous Blood Pressure Monitoring Devices Volume (K), by Types 2025 & 2033
- Figure 45: Middle East & Africa Continuous Blood Pressure Monitoring Devices Revenue Share (%), by Types 2025 & 2033
- Figure 46: Middle East & Africa Continuous Blood Pressure Monitoring Devices Volume Share (%), by Types 2025 & 2033
- Figure 47: Middle East & Africa Continuous Blood Pressure Monitoring Devices Revenue (million), by Country 2025 & 2033
- Figure 48: Middle East & Africa Continuous Blood Pressure Monitoring Devices Volume (K), by Country 2025 & 2033
- Figure 49: Middle East & Africa Continuous Blood Pressure Monitoring Devices Revenue Share (%), by Country 2025 & 2033
- Figure 50: Middle East & Africa Continuous Blood Pressure Monitoring Devices Volume Share (%), by Country 2025 & 2033
- Figure 51: Asia Pacific Continuous Blood Pressure Monitoring Devices Revenue (million), by Application 2025 & 2033
- Figure 52: Asia Pacific Continuous Blood Pressure Monitoring Devices Volume (K), by Application 2025 & 2033
- Figure 53: Asia Pacific Continuous Blood Pressure Monitoring Devices Revenue Share (%), by Application 2025 & 2033
- Figure 54: Asia Pacific Continuous Blood Pressure Monitoring Devices Volume Share (%), by Application 2025 & 2033
- Figure 55: Asia Pacific Continuous Blood Pressure Monitoring Devices Revenue (million), by Types 2025 & 2033
- Figure 56: Asia Pacific Continuous Blood Pressure Monitoring Devices Volume (K), by Types 2025 & 2033
- Figure 57: Asia Pacific Continuous Blood Pressure Monitoring Devices Revenue Share (%), by Types 2025 & 2033
- Figure 58: Asia Pacific Continuous Blood Pressure Monitoring Devices Volume Share (%), by Types 2025 & 2033
- Figure 59: Asia Pacific Continuous Blood Pressure Monitoring Devices Revenue (million), by Country 2025 & 2033
- Figure 60: Asia Pacific Continuous Blood Pressure Monitoring Devices Volume (K), by Country 2025 & 2033
- Figure 61: Asia Pacific Continuous Blood Pressure Monitoring Devices Revenue Share (%), by Country 2025 & 2033
- Figure 62: Asia Pacific Continuous Blood Pressure Monitoring Devices Volume Share (%), by Country 2025 & 2033
List of Tables
- Table 1: Global Continuous Blood Pressure Monitoring Devices Revenue million Forecast, by Application 2020 & 2033
- Table 2: Global Continuous Blood Pressure Monitoring Devices Volume K Forecast, by Application 2020 & 2033
- Table 3: Global Continuous Blood Pressure Monitoring Devices Revenue million Forecast, by Types 2020 & 2033
- Table 4: Global Continuous Blood Pressure Monitoring Devices Volume K Forecast, by Types 2020 & 2033
- Table 5: Global Continuous Blood Pressure Monitoring Devices Revenue million Forecast, by Region 2020 & 2033
- Table 6: Global Continuous Blood Pressure Monitoring Devices Volume K Forecast, by Region 2020 & 2033
- Table 7: Global Continuous Blood Pressure Monitoring Devices Revenue million Forecast, by Application 2020 & 2033
- Table 8: Global Continuous Blood Pressure Monitoring Devices Volume K Forecast, by Application 2020 & 2033
- Table 9: Global Continuous Blood Pressure Monitoring Devices Revenue million Forecast, by Types 2020 & 2033
- Table 10: Global Continuous Blood Pressure Monitoring Devices Volume K Forecast, by Types 2020 & 2033
- Table 11: Global Continuous Blood Pressure Monitoring Devices Revenue million Forecast, by Country 2020 & 2033
- Table 12: Global Continuous Blood Pressure Monitoring Devices Volume K Forecast, by Country 2020 & 2033
- Table 13: United States Continuous Blood Pressure Monitoring Devices Revenue (million) Forecast, by Application 2020 & 2033
- Table 14: United States Continuous Blood Pressure Monitoring Devices Volume (K) Forecast, by Application 2020 & 2033
- Table 15: Canada Continuous Blood Pressure Monitoring Devices Revenue (million) Forecast, by Application 2020 & 2033
- Table 16: Canada Continuous Blood Pressure Monitoring Devices Volume (K) Forecast, by Application 2020 & 2033
- Table 17: Mexico Continuous Blood Pressure Monitoring Devices Revenue (million) Forecast, by Application 2020 & 2033
- Table 18: Mexico Continuous Blood Pressure Monitoring Devices Volume (K) Forecast, by Application 2020 & 2033
- Table 19: Global Continuous Blood Pressure Monitoring Devices Revenue million Forecast, by Application 2020 & 2033
- Table 20: Global Continuous Blood Pressure Monitoring Devices Volume K Forecast, by Application 2020 & 2033
- Table 21: Global Continuous Blood Pressure Monitoring Devices Revenue million Forecast, by Types 2020 & 2033
- Table 22: Global Continuous Blood Pressure Monitoring Devices Volume K Forecast, by Types 2020 & 2033
- Table 23: Global Continuous Blood Pressure Monitoring Devices Revenue million Forecast, by Country 2020 & 2033
- Table 24: Global Continuous Blood Pressure Monitoring Devices Volume K Forecast, by Country 2020 & 2033
- Table 25: Brazil Continuous Blood Pressure Monitoring Devices Revenue (million) Forecast, by Application 2020 & 2033
- Table 26: Brazil Continuous Blood Pressure Monitoring Devices Volume (K) Forecast, by Application 2020 & 2033
- Table 27: Argentina Continuous Blood Pressure Monitoring Devices Revenue (million) Forecast, by Application 2020 & 2033
- Table 28: Argentina Continuous Blood Pressure Monitoring Devices Volume (K) Forecast, by Application 2020 & 2033
- Table 29: Rest of South America Continuous Blood Pressure Monitoring Devices Revenue (million) Forecast, by Application 2020 & 2033
- Table 30: Rest of South America Continuous Blood Pressure Monitoring Devices Volume (K) Forecast, by Application 2020 & 2033
- Table 31: Global Continuous Blood Pressure Monitoring Devices Revenue million Forecast, by Application 2020 & 2033
- Table 32: Global Continuous Blood Pressure Monitoring Devices Volume K Forecast, by Application 2020 & 2033
- Table 33: Global Continuous Blood Pressure Monitoring Devices Revenue million Forecast, by Types 2020 & 2033
- Table 34: Global Continuous Blood Pressure Monitoring Devices Volume K Forecast, by Types 2020 & 2033
- Table 35: Global Continuous Blood Pressure Monitoring Devices Revenue million Forecast, by Country 2020 & 2033
- Table 36: Global Continuous Blood Pressure Monitoring Devices Volume K Forecast, by Country 2020 & 2033
- Table 37: United Kingdom Continuous Blood Pressure Monitoring Devices Revenue (million) Forecast, by Application 2020 & 2033
- Table 38: United Kingdom Continuous Blood Pressure Monitoring Devices Volume (K) Forecast, by Application 2020 & 2033
- Table 39: Germany Continuous Blood Pressure Monitoring Devices Revenue (million) Forecast, by Application 2020 & 2033
- Table 40: Germany Continuous Blood Pressure Monitoring Devices Volume (K) Forecast, by Application 2020 & 2033
- Table 41: France Continuous Blood Pressure Monitoring Devices Revenue (million) Forecast, by Application 2020 & 2033
- Table 42: France Continuous Blood Pressure Monitoring Devices Volume (K) Forecast, by Application 2020 & 2033
- Table 43: Italy Continuous Blood Pressure Monitoring Devices Revenue (million) Forecast, by Application 2020 & 2033
- Table 44: Italy Continuous Blood Pressure Monitoring Devices Volume (K) Forecast, by Application 2020 & 2033
- Table 45: Spain Continuous Blood Pressure Monitoring Devices Revenue (million) Forecast, by Application 2020 & 2033
- Table 46: Spain Continuous Blood Pressure Monitoring Devices Volume (K) Forecast, by Application 2020 & 2033
- Table 47: Russia Continuous Blood Pressure Monitoring Devices Revenue (million) Forecast, by Application 2020 & 2033
- Table 48: Russia Continuous Blood Pressure Monitoring Devices Volume (K) Forecast, by Application 2020 & 2033
- Table 49: Benelux Continuous Blood Pressure Monitoring Devices Revenue (million) Forecast, by Application 2020 & 2033
- Table 50: Benelux Continuous Blood Pressure Monitoring Devices Volume (K) Forecast, by Application 2020 & 2033
- Table 51: Nordics Continuous Blood Pressure Monitoring Devices Revenue (million) Forecast, by Application 2020 & 2033
- Table 52: Nordics Continuous Blood Pressure Monitoring Devices Volume (K) Forecast, by Application 2020 & 2033
- Table 53: Rest of Europe Continuous Blood Pressure Monitoring Devices Revenue (million) Forecast, by Application 2020 & 2033
- Table 54: Rest of Europe Continuous Blood Pressure Monitoring Devices Volume (K) Forecast, by Application 2020 & 2033
- Table 55: Global Continuous Blood Pressure Monitoring Devices Revenue million Forecast, by Application 2020 & 2033
- Table 56: Global Continuous Blood Pressure Monitoring Devices Volume K Forecast, by Application 2020 & 2033
- Table 57: Global Continuous Blood Pressure Monitoring Devices Revenue million Forecast, by Types 2020 & 2033
- Table 58: Global Continuous Blood Pressure Monitoring Devices Volume K Forecast, by Types 2020 & 2033
- Table 59: Global Continuous Blood Pressure Monitoring Devices Revenue million Forecast, by Country 2020 & 2033
- Table 60: Global Continuous Blood Pressure Monitoring Devices Volume K Forecast, by Country 2020 & 2033
- Table 61: Turkey Continuous Blood Pressure Monitoring Devices Revenue (million) Forecast, by Application 2020 & 2033
- Table 62: Turkey Continuous Blood Pressure Monitoring Devices Volume (K) Forecast, by Application 2020 & 2033
- Table 63: Israel Continuous Blood Pressure Monitoring Devices Revenue (million) Forecast, by Application 2020 & 2033
- Table 64: Israel Continuous Blood Pressure Monitoring Devices Volume (K) Forecast, by Application 2020 & 2033
- Table 65: GCC Continuous Blood Pressure Monitoring Devices Revenue (million) Forecast, by Application 2020 & 2033
- Table 66: GCC Continuous Blood Pressure Monitoring Devices Volume (K) Forecast, by Application 2020 & 2033
- Table 67: North Africa Continuous Blood Pressure Monitoring Devices Revenue (million) Forecast, by Application 2020 & 2033
- Table 68: North Africa Continuous Blood Pressure Monitoring Devices Volume (K) Forecast, by Application 2020 & 2033
- Table 69: South Africa Continuous Blood Pressure Monitoring Devices Revenue (million) Forecast, by Application 2020 & 2033
- Table 70: South Africa Continuous Blood Pressure Monitoring Devices Volume (K) Forecast, by Application 2020 & 2033
- Table 71: Rest of Middle East & Africa Continuous Blood Pressure Monitoring Devices Revenue (million) Forecast, by Application 2020 & 2033
- Table 72: Rest of Middle East & Africa Continuous Blood Pressure Monitoring Devices Volume (K) Forecast, by Application 2020 & 2033
- Table 73: Global Continuous Blood Pressure Monitoring Devices Revenue million Forecast, by Application 2020 & 2033
- Table 74: Global Continuous Blood Pressure Monitoring Devices Volume K Forecast, by Application 2020 & 2033
- Table 75: Global Continuous Blood Pressure Monitoring Devices Revenue million Forecast, by Types 2020 & 2033
- Table 76: Global Continuous Blood Pressure Monitoring Devices Volume K Forecast, by Types 2020 & 2033
- Table 77: Global Continuous Blood Pressure Monitoring Devices Revenue million Forecast, by Country 2020 & 2033
- Table 78: Global Continuous Blood Pressure Monitoring Devices Volume K Forecast, by Country 2020 & 2033
- Table 79: China Continuous Blood Pressure Monitoring Devices Revenue (million) Forecast, by Application 2020 & 2033
- Table 80: China Continuous Blood Pressure Monitoring Devices Volume (K) Forecast, by Application 2020 & 2033
- Table 81: India Continuous Blood Pressure Monitoring Devices Revenue (million) Forecast, by Application 2020 & 2033
- Table 82: India Continuous Blood Pressure Monitoring Devices Volume (K) Forecast, by Application 2020 & 2033
- Table 83: Japan Continuous Blood Pressure Monitoring Devices Revenue (million) Forecast, by Application 2020 & 2033
- Table 84: Japan Continuous Blood Pressure Monitoring Devices Volume (K) Forecast, by Application 2020 & 2033
- Table 85: South Korea Continuous Blood Pressure Monitoring Devices Revenue (million) Forecast, by Application 2020 & 2033
- Table 86: South Korea Continuous Blood Pressure Monitoring Devices Volume (K) Forecast, by Application 2020 & 2033
- Table 87: ASEAN Continuous Blood Pressure Monitoring Devices Revenue (million) Forecast, by Application 2020 & 2033
- Table 88: ASEAN Continuous Blood Pressure Monitoring Devices Volume (K) Forecast, by Application 2020 & 2033
- Table 89: Oceania Continuous Blood Pressure Monitoring Devices Revenue (million) Forecast, by Application 2020 & 2033
- Table 90: Oceania Continuous Blood Pressure Monitoring Devices Volume (K) Forecast, by Application 2020 & 2033
- Table 91: Rest of Asia Pacific Continuous Blood Pressure Monitoring Devices Revenue (million) Forecast, by Application 2020 & 2033
- Table 92: Rest of Asia Pacific Continuous Blood Pressure Monitoring Devices Volume (K) Forecast, by Application 2020 & 2033
Frequently Asked Questions
1. What is the projected Compound Annual Growth Rate (CAGR) of the Continuous Blood Pressure Monitoring Devices?
The projected CAGR is approximately 7.1%.
2. Which companies are prominent players in the Continuous Blood Pressure Monitoring Devices?
Key companies in the market include A&D, Hill-Rom, SunTech Medical, Spacelabs Healthcare, Schiller, Bosch + Sohn, Microlife, Vasomedical, Meditech, Riester, Mindray, Suzuken, HINGMED.
3. What are the main segments of the Continuous Blood Pressure Monitoring Devices?
The market segments include Application, Types.
4. Can you provide details about the market size?
The market size is estimated to be USD 135 million as of 2022.
5. What are some drivers contributing to market growth?
N/A
6. What are the notable trends driving market growth?
N/A
7. Are there any restraints impacting market growth?
N/A
8. Can you provide examples of recent developments in the market?
N/A
9. What pricing options are available for accessing the report?
Pricing options include single-user, multi-user, and enterprise licenses priced at USD 4350.00, USD 6525.00, and USD 8700.00 respectively.
10. Is the market size provided in terms of value or volume?
The market size is provided in terms of value, measured in million and volume, measured in K.
11. Are there any specific market keywords associated with the report?
Yes, the market keyword associated with the report is "Continuous Blood Pressure Monitoring Devices," which aids in identifying and referencing the specific market segment covered.
12. How do I determine which pricing option suits my needs best?
The pricing options vary based on user requirements and access needs. Individual users may opt for single-user licenses, while businesses requiring broader access may choose multi-user or enterprise licenses for cost-effective access to the report.
13. Are there any additional resources or data provided in the Continuous Blood Pressure Monitoring Devices report?
While the report offers comprehensive insights, it's advisable to review the specific contents or supplementary materials provided to ascertain if additional resources or data are available.
14. How can I stay updated on further developments or reports in the Continuous Blood Pressure Monitoring Devices?
To stay informed about further developments, trends, and reports in the Continuous Blood Pressure Monitoring Devices, consider subscribing to industry newsletters, following relevant companies and organizations, or regularly checking reputable industry news sources and publications.
Methodology
Step 1 - Identification of Relevant Samples Size from Population Database


Step 2 - Approaches for Defining Global Market Size (Value, Volume* & Price*)

Note*: In applicable scenarios
Step 3 - Data Sources
Primary Research
- Web Analytics
- Survey Reports
- Research Institute
- Latest Research Reports
- Opinion Leaders
Secondary Research
- Annual Reports
- White Paper
- Latest Press Release
- Industry Association
- Paid Database
- Investor Presentations

Step 4 - Data Triangulation
Involves using different sources of information in order to increase the validity of a study
These sources are likely to be stakeholders in a program - participants, other researchers, program staff, other community members, and so on.
Then we put all data in single framework & apply various statistical tools to find out the dynamic on the market.
During the analysis stage, feedback from the stakeholder groups would be compared to determine areas of agreement as well as areas of divergence