
Key Insights
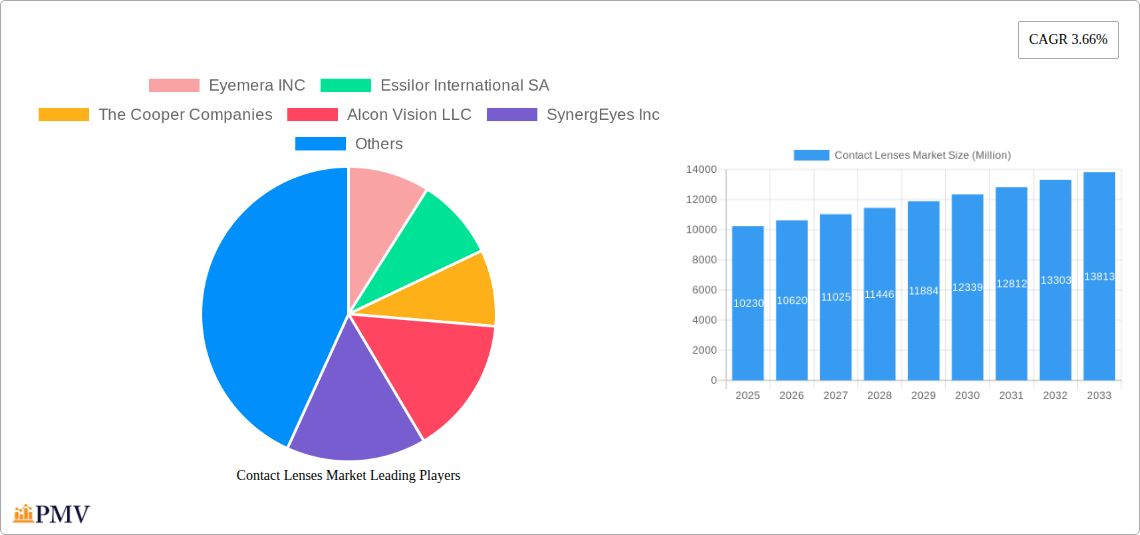
The global contact lenses market, valued at $10.23 billion in 2025, is projected to experience steady growth, driven by increasing prevalence of refractive errors like myopia and hyperopia, rising disposable income enabling greater access to vision correction solutions, and advancements in lens technology offering enhanced comfort and functionality. The market's Compound Annual Growth Rate (CAGR) of 3.66% from 2025 to 2033 suggests a consistent expansion, fueled by the increasing adoption of disposable contact lenses due to convenience and hygiene benefits. Furthermore, the growing popularity of cosmetic contact lenses, particularly among younger demographics, contributes significantly to market growth. Technological innovations, including the development of multifocal and toric lenses for presbyopia and astigmatism correction, respectively, are further expanding market opportunities. However, potential restraints include the risk of eye infections associated with improper lens care, relatively high costs compared to other vision correction methods like eyeglasses, and the presence of alternative vision correction procedures such as LASIK surgery.
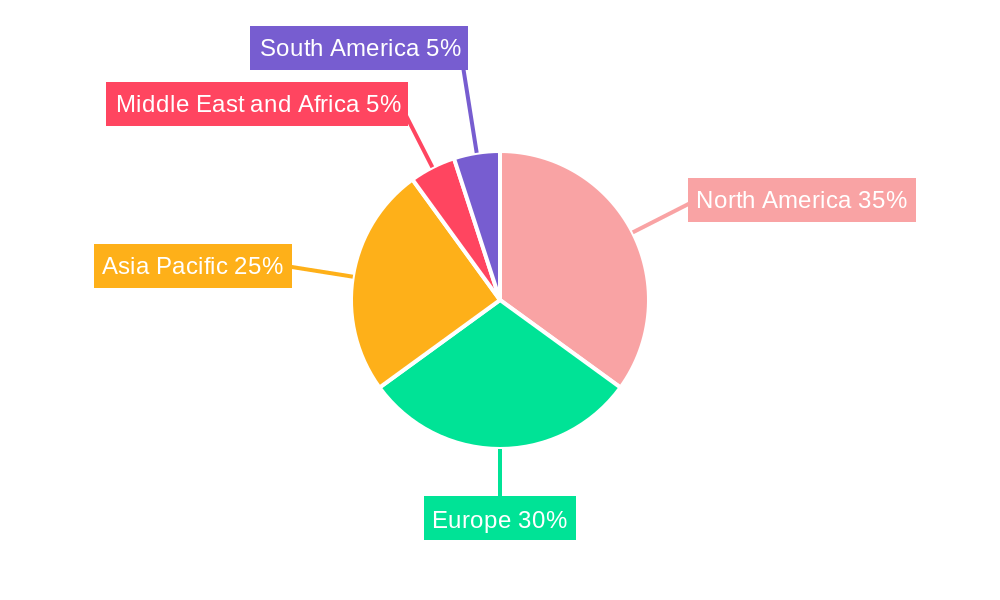
Segment-wise analysis reveals that disposable contact lenses dominate the modality segment due to hygiene and convenience factors. Within the usage segment, corrective lenses constitute the largest share, reflecting the primary application of contact lenses. Geographically, North America and Europe currently hold significant market shares due to high healthcare expenditure and established eye care infrastructure; however, the Asia-Pacific region is expected to witness substantial growth driven by rising awareness and adoption in developing economies. Major players like Johnson & Johnson Vision Care, Alcon, CooperVision, and Essilor are actively involved in research and development, focusing on innovations that improve comfort, vision correction efficacy, and patient safety. This continuous innovation, coupled with increasing demand, ensures the contact lenses market's promising trajectory in the coming years.
Contact Lenses Market: A Comprehensive Report (2019-2033)
This in-depth report provides a comprehensive analysis of the global Contact Lenses Market, offering valuable insights for industry stakeholders, investors, and strategic decision-makers. The report covers the period from 2019 to 2033, with a focus on the forecast period from 2025 to 2033. The Base Year is 2025 and the Estimated Year is 2025. The report segments the market by usage, modality, design, and product type, offering granular data and projections. Key market players like Johnson & Johnson Vision Care Inc, Essilor International SA, The Cooper Companies, Alcon Vision LLC, and others are analyzed in detail. The total market size is projected to reach xx Million by 2033.
Contact Lenses Market Structure & Competitive Dynamics
The Contact Lenses Market exhibits a moderately concentrated structure, with a few major players holding significant market share. The market is characterized by intense competition, driven by continuous product innovation, technological advancements, and strategic mergers and acquisitions (M&A). The global regulatory framework plays a crucial role, influencing product approvals and market access. Key industry players are investing heavily in R&D to develop advanced contact lens materials and designs, catering to the growing demand for enhanced comfort, vision correction, and therapeutic benefits. Substitutes, such as refractive surgeries (LASIK, SMILE), pose a competitive threat.
- Market Concentration: The top 5 players account for approximately xx% of the global market share in 2025.
- Innovation Ecosystems: Significant investments in R&D by major players drive innovation in materials, designs, and manufacturing processes. Collaboration with universities and research institutions is also prevalent.
- Regulatory Frameworks: FDA approvals and other global regulatory processes influence market entry and product commercialization. Stringent regulations ensure product safety and efficacy.
- Product Substitutes: Refractive surgeries present a significant competitive challenge, particularly for corrective contact lenses.
- End-User Trends: Growing demand for disposable contact lenses and customized solutions is reshaping market dynamics.
- M&A Activities: Consolidation activities are expected, with larger companies acquiring smaller specialized players, resulting in significant M&A deal values exceeding xx Million in the last five years.
Contact Lenses Market Industry Trends & Insights
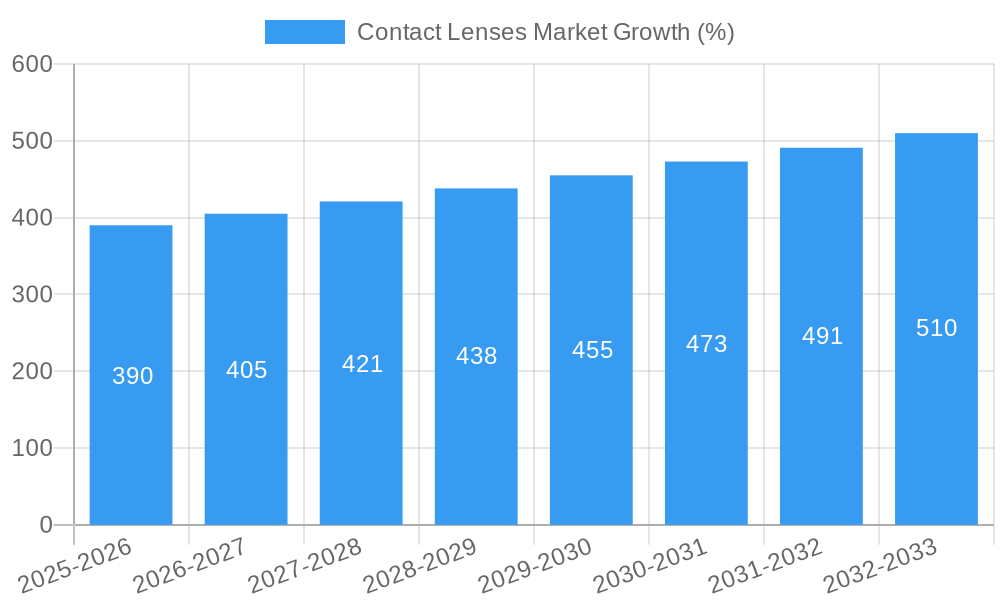
The Contact Lenses Market is experiencing robust growth, driven by factors such as the rising prevalence of refractive errors, increasing disposable income in emerging economies, and growing awareness about eye care. Technological advancements, like the development of silicone hydrogel materials and multifocal lenses, are enhancing the comfort and efficacy of contact lenses. Changing consumer preferences toward daily disposable lenses and increased demand for customized solutions are shaping market trends. The market is projected to witness a CAGR of xx% during the forecast period (2025-2033). Market penetration is increasing steadily, driven by growing adoption of contact lenses across various age groups. Intense competition amongst key players fuels innovation and affordability, further driving market expansion.
Dominant Markets & Segments in Contact Lenses Market
The North American market is expected to maintain its dominance, driven by factors such as high per capita disposable income and advanced healthcare infrastructure. Within the segments, Corrective Contact Lenses hold the largest market share, followed by Disposable Modality and Soft Contact Lenses.
- Leading Region: North America
- Key Drivers (North America):
- High prevalence of refractive errors
- Advanced healthcare infrastructure
- High disposable income
- Increased awareness about eye care
- Dominant Segments:
- Usage: Corrective Contact Lenses (market size xx Million in 2025)
- Modality: Disposable (market size xx Million in 2025)
- Design: Spherical (market size xx Million in 2025)
- Product Type: Soft Contact Lenses (market size xx Million in 2025)
The dominance of these segments is attributed to factors like the high prevalence of refractive errors necessitating vision correction, convenience offered by disposable lenses, and the comfort and affordability associated with soft contact lenses. Other regions like Asia Pacific are experiencing rapid growth, propelled by rising awareness and increasing affordability of contact lenses.
Contact Lenses Market Product Innovations
Recent innovations focus on improving comfort, vision correction accuracy, and lens material properties. The introduction of silicone hydrogel materials offers better oxygen permeability, addressing issues like dryness and discomfort. Advancements in multifocal lens designs are improving vision correction for presbyopia. Smart lenses with integrated functionalities are emerging as a future trend. These innovations are enhancing market fit by catering to specific needs and preferences, thus boosting market growth.
Report Segmentation & Scope
This report provides a detailed segmentation of the Contact Lenses Market, analyzing each segment's growth potential, market size, and competitive dynamics:
- Usage: Corrective, Therapeutic, Cosmetic, Prosthetic
- Modality: Conventional, Disposable
- Design: Spherical, Toric, Multifocal, Other Designs
- Product Type: Soft, Hybrid, Rigid Gas Permeable, Other Product Types
Each segment is analyzed individually, offering insights into its market size, growth rate, and key players. Projected growth rates vary across segments, with disposable and advanced design lenses showing higher growth potential. Competitive dynamics also differ across segments, with some experiencing higher levels of competition than others.
Key Drivers of Contact Lenses Market Growth
The Contact Lenses Market is fueled by several key factors:
- Rising Prevalence of Refractive Errors: The increasing incidence of myopia, hyperopia, and astigmatism is a major driver.
- Technological Advancements: Innovations in materials and designs are enhancing lens comfort and performance.
- Growing Disposable Income: Increasing disposable income in developing economies fuels demand.
- Changing Lifestyle Preferences: The convenience offered by contact lenses is a significant factor.
Challenges in the Contact Lenses Market Sector
Several challenges hinder market growth:
- Regulatory Hurdles: Stringent regulatory approvals can delay product launches and increase costs.
- Supply Chain Disruptions: Global supply chain issues can impact the availability and cost of materials.
- Intense Competition: Competition among major players can compress profit margins.
Leading Players in the Contact Lenses Market Market
- Eyemera INC
- Essilor International SA
- The Cooper Companies
- Alcon Vision LLC
- SynergEyes Inc
- Menicon Co Ltd
- Zeiss Group
- Johnson & Johnson Vision Care Inc
- Seed Co Ltd
- Bausch Health Companies Inc
- Hoya Corporation
Key Developments in Contact Lenses Market Sector
- June 2022: Johnson & Johnson Vision received FDA clearance for ACUVUE OASYS MAX 1-Day and ACUVUE OASYS MAX 1-Day MULTIFOCAL contact lenses, expanding its product portfolio in the daily disposable segment.
- April 2022: Alcon launched Precision, a daily disposable silicone hydrogel contact lens for astigmatism in Canada, strengthening its position in the astigmatism correction market.
Strategic Contact Lenses Market Outlook
The Contact Lenses Market is poised for continued growth, driven by technological advancements, evolving consumer preferences, and expanding global reach. Strategic opportunities exist for companies to focus on developing innovative products catering to unmet needs and expanding their market presence in emerging economies. Furthermore, strategic partnerships and collaborations can accelerate innovation and market penetration. Personalized contact lenses and smart lenses are expected to shape the future of the market.
Contact Lenses Market Segmentation
-
1. Product Type
- 1.1. Soft Contact Lenses
- 1.2. Hybrid Contact Lenses
- 1.3. Rigid Gas Permeable Contact Lenses
- 1.4. Other Product Types
-
2. Usage
- 2.1. Corrective Contact Lenses
- 2.2. Therapeutic Contact Lenses
- 2.3. Cosmetic Contact Lenses
- 2.4. Prosthetic Contact Lenses
-
3. Modality
- 3.1. Conventional
- 3.2. Disposable
-
4. Design
- 4.1. Spherical
- 4.2. Toric
- 4.3. Multifocal
- 4.4. Other Designs
Contact Lenses Market Segmentation By Geography
-
1. North America
- 1.1. United States
- 1.2. Canada
- 1.3. Mexico
-
2. Europe
- 2.1. United Kingdom
- 2.2. Germany
- 2.3. France
- 2.4. Italy
- 2.5. Spain
- 2.6. Rest of Europe
-
3. Asia Pacific
- 3.1. China
- 3.2. Japan
- 3.3. India
- 3.4. Australia
- 3.5. South Korea
- 3.6. Rest of Asia Pacific
-
4. Middle East and Africa
- 4.1. GCC
- 4.2. South Africa
- 4.3. Rest of Middle East and Africa
-
5. South America
- 5.1. Brazil
- 5.2. Argentina
- 5.3. Rest of South America
Contact Lenses Market REPORT HIGHLIGHTS
| Aspects | Details |
|---|---|
| Study Period | 2019-2033 |
| Base Year | 2024 |
| Estimated Year | 2025 |
| Forecast Period | 2025-2033 |
| Historical Period | 2019-2024 |
| Growth Rate | CAGR of 3.66% from 2019-2033 |
| Segmentation |
|
Table of Contents
- 1. Introduction
- 1.1. Research Scope
- 1.2. Market Segmentation
- 1.3. Research Methodology
- 1.4. Definitions and Assumptions
- 2. Executive Summary
- 2.1. Introduction
- 3. Market Dynamics
- 3.1. Introduction
- 3.2. Market Drivers
- 3.2.1. Increasing Burden of Optical Disorders; Increasing Tendency to Enhance Aesthetics
- 3.3. Market Restrains
- 3.3.1. Availability of Alternative Techniques and Complications Associated with Lenses4.3.2
- 3.4. Market Trends
- 3.4.1. Corrective Contact Lenses are Expected to Register a Significant Growth Rate over the Forecast Period
- 4. Market Factor Analysis
- 4.1. Porters Five Forces
- 4.2. Supply/Value Chain
- 4.3. PESTEL analysis
- 4.4. Market Entropy
- 4.5. Patent/Trademark Analysis
- 5. Global Contact Lenses Market Analysis, Insights and Forecast, 2019-2031
- 5.1. Market Analysis, Insights and Forecast - by Product Type
- 5.1.1. Soft Contact Lenses
- 5.1.2. Hybrid Contact Lenses
- 5.1.3. Rigid Gas Permeable Contact Lenses
- 5.1.4. Other Product Types
- 5.2. Market Analysis, Insights and Forecast - by Usage
- 5.2.1. Corrective Contact Lenses
- 5.2.2. Therapeutic Contact Lenses
- 5.2.3. Cosmetic Contact Lenses
- 5.2.4. Prosthetic Contact Lenses
- 5.3. Market Analysis, Insights and Forecast - by Modality
- 5.3.1. Conventional
- 5.3.2. Disposable
- 5.4. Market Analysis, Insights and Forecast - by Design
- 5.4.1. Spherical
- 5.4.2. Toric
- 5.4.3. Multifocal
- 5.4.4. Other Designs
- 5.5. Market Analysis, Insights and Forecast - by Region
- 5.5.1. North America
- 5.5.2. Europe
- 5.5.3. Asia Pacific
- 5.5.4. Middle East and Africa
- 5.5.5. South America
- 5.1. Market Analysis, Insights and Forecast - by Product Type
- 6. North America Contact Lenses Market Analysis, Insights and Forecast, 2019-2031
- 6.1. Market Analysis, Insights and Forecast - by Product Type
- 6.1.1. Soft Contact Lenses
- 6.1.2. Hybrid Contact Lenses
- 6.1.3. Rigid Gas Permeable Contact Lenses
- 6.1.4. Other Product Types
- 6.2. Market Analysis, Insights and Forecast - by Usage
- 6.2.1. Corrective Contact Lenses
- 6.2.2. Therapeutic Contact Lenses
- 6.2.3. Cosmetic Contact Lenses
- 6.2.4. Prosthetic Contact Lenses
- 6.3. Market Analysis, Insights and Forecast - by Modality
- 6.3.1. Conventional
- 6.3.2. Disposable
- 6.4. Market Analysis, Insights and Forecast - by Design
- 6.4.1. Spherical
- 6.4.2. Toric
- 6.4.3. Multifocal
- 6.4.4. Other Designs
- 6.1. Market Analysis, Insights and Forecast - by Product Type
- 7. Europe Contact Lenses Market Analysis, Insights and Forecast, 2019-2031
- 7.1. Market Analysis, Insights and Forecast - by Product Type
- 7.1.1. Soft Contact Lenses
- 7.1.2. Hybrid Contact Lenses
- 7.1.3. Rigid Gas Permeable Contact Lenses
- 7.1.4. Other Product Types
- 7.2. Market Analysis, Insights and Forecast - by Usage
- 7.2.1. Corrective Contact Lenses
- 7.2.2. Therapeutic Contact Lenses
- 7.2.3. Cosmetic Contact Lenses
- 7.2.4. Prosthetic Contact Lenses
- 7.3. Market Analysis, Insights and Forecast - by Modality
- 7.3.1. Conventional
- 7.3.2. Disposable
- 7.4. Market Analysis, Insights and Forecast - by Design
- 7.4.1. Spherical
- 7.4.2. Toric
- 7.4.3. Multifocal
- 7.4.4. Other Designs
- 7.1. Market Analysis, Insights and Forecast - by Product Type
- 8. Asia Pacific Contact Lenses Market Analysis, Insights and Forecast, 2019-2031
- 8.1. Market Analysis, Insights and Forecast - by Product Type
- 8.1.1. Soft Contact Lenses
- 8.1.2. Hybrid Contact Lenses
- 8.1.3. Rigid Gas Permeable Contact Lenses
- 8.1.4. Other Product Types
- 8.2. Market Analysis, Insights and Forecast - by Usage
- 8.2.1. Corrective Contact Lenses
- 8.2.2. Therapeutic Contact Lenses
- 8.2.3. Cosmetic Contact Lenses
- 8.2.4. Prosthetic Contact Lenses
- 8.3. Market Analysis, Insights and Forecast - by Modality
- 8.3.1. Conventional
- 8.3.2. Disposable
- 8.4. Market Analysis, Insights and Forecast - by Design
- 8.4.1. Spherical
- 8.4.2. Toric
- 8.4.3. Multifocal
- 8.4.4. Other Designs
- 8.1. Market Analysis, Insights and Forecast - by Product Type
- 9. Middle East and Africa Contact Lenses Market Analysis, Insights and Forecast, 2019-2031
- 9.1. Market Analysis, Insights and Forecast - by Product Type
- 9.1.1. Soft Contact Lenses
- 9.1.2. Hybrid Contact Lenses
- 9.1.3. Rigid Gas Permeable Contact Lenses
- 9.1.4. Other Product Types
- 9.2. Market Analysis, Insights and Forecast - by Usage
- 9.2.1. Corrective Contact Lenses
- 9.2.2. Therapeutic Contact Lenses
- 9.2.3. Cosmetic Contact Lenses
- 9.2.4. Prosthetic Contact Lenses
- 9.3. Market Analysis, Insights and Forecast - by Modality
- 9.3.1. Conventional
- 9.3.2. Disposable
- 9.4. Market Analysis, Insights and Forecast - by Design
- 9.4.1. Spherical
- 9.4.2. Toric
- 9.4.3. Multifocal
- 9.4.4. Other Designs
- 9.1. Market Analysis, Insights and Forecast - by Product Type
- 10. South America Contact Lenses Market Analysis, Insights and Forecast, 2019-2031
- 10.1. Market Analysis, Insights and Forecast - by Product Type
- 10.1.1. Soft Contact Lenses
- 10.1.2. Hybrid Contact Lenses
- 10.1.3. Rigid Gas Permeable Contact Lenses
- 10.1.4. Other Product Types
- 10.2. Market Analysis, Insights and Forecast - by Usage
- 10.2.1. Corrective Contact Lenses
- 10.2.2. Therapeutic Contact Lenses
- 10.2.3. Cosmetic Contact Lenses
- 10.2.4. Prosthetic Contact Lenses
- 10.3. Market Analysis, Insights and Forecast - by Modality
- 10.3.1. Conventional
- 10.3.2. Disposable
- 10.4. Market Analysis, Insights and Forecast - by Design
- 10.4.1. Spherical
- 10.4.2. Toric
- 10.4.3. Multifocal
- 10.4.4. Other Designs
- 10.1. Market Analysis, Insights and Forecast - by Product Type
- 11. North America Contact Lenses Market Analysis, Insights and Forecast, 2019-2031
- 11.1. Market Analysis, Insights and Forecast - By Country/Sub-region
- 11.1.1 United States
- 11.1.2 Canada
- 11.1.3 Mexico
- 12. Europe Contact Lenses Market Analysis, Insights and Forecast, 2019-2031
- 12.1. Market Analysis, Insights and Forecast - By Country/Sub-region
- 12.1.1 United Kingdom
- 12.1.2 Germany
- 12.1.3 France
- 12.1.4 Italy
- 12.1.5 Spain
- 12.1.6 Rest of Europe
- 13. Asia Pacific Contact Lenses Market Analysis, Insights and Forecast, 2019-2031
- 13.1. Market Analysis, Insights and Forecast - By Country/Sub-region
- 13.1.1 China
- 13.1.2 Japan
- 13.1.3 India
- 13.1.4 Australia
- 13.1.5 South Korea
- 13.1.6 Rest of Asia Pacific
- 14. Middle East and Africa Contact Lenses Market Analysis, Insights and Forecast, 2019-2031
- 14.1. Market Analysis, Insights and Forecast - By Country/Sub-region
- 14.1.1 GCC
- 14.1.2 South Africa
- 14.1.3 Rest of Middle East and Africa
- 15. South America Contact Lenses Market Analysis, Insights and Forecast, 2019-2031
- 15.1. Market Analysis, Insights and Forecast - By Country/Sub-region
- 15.1.1 Brazil
- 15.1.2 Argentina
- 15.1.3 Rest of South America
- 16. Competitive Analysis
- 16.1. Global Market Share Analysis 2024
- 16.2. Company Profiles
- 16.2.1 Eyemera INC
- 16.2.1.1. Overview
- 16.2.1.2. Products
- 16.2.1.3. SWOT Analysis
- 16.2.1.4. Recent Developments
- 16.2.1.5. Financials (Based on Availability)
- 16.2.2 Essilor International SA
- 16.2.2.1. Overview
- 16.2.2.2. Products
- 16.2.2.3. SWOT Analysis
- 16.2.2.4. Recent Developments
- 16.2.2.5. Financials (Based on Availability)
- 16.2.3 The Cooper Companies
- 16.2.3.1. Overview
- 16.2.3.2. Products
- 16.2.3.3. SWOT Analysis
- 16.2.3.4. Recent Developments
- 16.2.3.5. Financials (Based on Availability)
- 16.2.4 Alcon Vision LLC
- 16.2.4.1. Overview
- 16.2.4.2. Products
- 16.2.4.3. SWOT Analysis
- 16.2.4.4. Recent Developments
- 16.2.4.5. Financials (Based on Availability)
- 16.2.5 SynergEyes Inc
- 16.2.5.1. Overview
- 16.2.5.2. Products
- 16.2.5.3. SWOT Analysis
- 16.2.5.4. Recent Developments
- 16.2.5.5. Financials (Based on Availability)
- 16.2.6 Menicon Co Ltd
- 16.2.6.1. Overview
- 16.2.6.2. Products
- 16.2.6.3. SWOT Analysis
- 16.2.6.4. Recent Developments
- 16.2.6.5. Financials (Based on Availability)
- 16.2.7 Zeiss Group
- 16.2.7.1. Overview
- 16.2.7.2. Products
- 16.2.7.3. SWOT Analysis
- 16.2.7.4. Recent Developments
- 16.2.7.5. Financials (Based on Availability)
- 16.2.8 Johnson & Johnson Vision Care Inc
- 16.2.8.1. Overview
- 16.2.8.2. Products
- 16.2.8.3. SWOT Analysis
- 16.2.8.4. Recent Developments
- 16.2.8.5. Financials (Based on Availability)
- 16.2.9 Seed Co Ltd
- 16.2.9.1. Overview
- 16.2.9.2. Products
- 16.2.9.3. SWOT Analysis
- 16.2.9.4. Recent Developments
- 16.2.9.5. Financials (Based on Availability)
- 16.2.10 Bausch Health Companies Inc
- 16.2.10.1. Overview
- 16.2.10.2. Products
- 16.2.10.3. SWOT Analysis
- 16.2.10.4. Recent Developments
- 16.2.10.5. Financials (Based on Availability)
- 16.2.11 Hoya Corporation
- 16.2.11.1. Overview
- 16.2.11.2. Products
- 16.2.11.3. SWOT Analysis
- 16.2.11.4. Recent Developments
- 16.2.11.5. Financials (Based on Availability)
- 16.2.1 Eyemera INC
List of Figures
- Figure 1: Global Contact Lenses Market Revenue Breakdown (Million, %) by Region 2024 & 2032
- Figure 2: Global Contact Lenses Market Volume Breakdown (K Unit, %) by Region 2024 & 2032
- Figure 3: North America Contact Lenses Market Revenue (Million), by Country 2024 & 2032
- Figure 4: North America Contact Lenses Market Volume (K Unit), by Country 2024 & 2032
- Figure 5: North America Contact Lenses Market Revenue Share (%), by Country 2024 & 2032
- Figure 6: North America Contact Lenses Market Volume Share (%), by Country 2024 & 2032
- Figure 7: Europe Contact Lenses Market Revenue (Million), by Country 2024 & 2032
- Figure 8: Europe Contact Lenses Market Volume (K Unit), by Country 2024 & 2032
- Figure 9: Europe Contact Lenses Market Revenue Share (%), by Country 2024 & 2032
- Figure 10: Europe Contact Lenses Market Volume Share (%), by Country 2024 & 2032
- Figure 11: Asia Pacific Contact Lenses Market Revenue (Million), by Country 2024 & 2032
- Figure 12: Asia Pacific Contact Lenses Market Volume (K Unit), by Country 2024 & 2032
- Figure 13: Asia Pacific Contact Lenses Market Revenue Share (%), by Country 2024 & 2032
- Figure 14: Asia Pacific Contact Lenses Market Volume Share (%), by Country 2024 & 2032
- Figure 15: Middle East and Africa Contact Lenses Market Revenue (Million), by Country 2024 & 2032
- Figure 16: Middle East and Africa Contact Lenses Market Volume (K Unit), by Country 2024 & 2032
- Figure 17: Middle East and Africa Contact Lenses Market Revenue Share (%), by Country 2024 & 2032
- Figure 18: Middle East and Africa Contact Lenses Market Volume Share (%), by Country 2024 & 2032
- Figure 19: South America Contact Lenses Market Revenue (Million), by Country 2024 & 2032
- Figure 20: South America Contact Lenses Market Volume (K Unit), by Country 2024 & 2032
- Figure 21: South America Contact Lenses Market Revenue Share (%), by Country 2024 & 2032
- Figure 22: South America Contact Lenses Market Volume Share (%), by Country 2024 & 2032
- Figure 23: North America Contact Lenses Market Revenue (Million), by Product Type 2024 & 2032
- Figure 24: North America Contact Lenses Market Volume (K Unit), by Product Type 2024 & 2032
- Figure 25: North America Contact Lenses Market Revenue Share (%), by Product Type 2024 & 2032
- Figure 26: North America Contact Lenses Market Volume Share (%), by Product Type 2024 & 2032
- Figure 27: North America Contact Lenses Market Revenue (Million), by Usage 2024 & 2032
- Figure 28: North America Contact Lenses Market Volume (K Unit), by Usage 2024 & 2032
- Figure 29: North America Contact Lenses Market Revenue Share (%), by Usage 2024 & 2032
- Figure 30: North America Contact Lenses Market Volume Share (%), by Usage 2024 & 2032
- Figure 31: North America Contact Lenses Market Revenue (Million), by Modality 2024 & 2032
- Figure 32: North America Contact Lenses Market Volume (K Unit), by Modality 2024 & 2032
- Figure 33: North America Contact Lenses Market Revenue Share (%), by Modality 2024 & 2032
- Figure 34: North America Contact Lenses Market Volume Share (%), by Modality 2024 & 2032
- Figure 35: North America Contact Lenses Market Revenue (Million), by Design 2024 & 2032
- Figure 36: North America Contact Lenses Market Volume (K Unit), by Design 2024 & 2032
- Figure 37: North America Contact Lenses Market Revenue Share (%), by Design 2024 & 2032
- Figure 38: North America Contact Lenses Market Volume Share (%), by Design 2024 & 2032
- Figure 39: North America Contact Lenses Market Revenue (Million), by Country 2024 & 2032
- Figure 40: North America Contact Lenses Market Volume (K Unit), by Country 2024 & 2032
- Figure 41: North America Contact Lenses Market Revenue Share (%), by Country 2024 & 2032
- Figure 42: North America Contact Lenses Market Volume Share (%), by Country 2024 & 2032
- Figure 43: Europe Contact Lenses Market Revenue (Million), by Product Type 2024 & 2032
- Figure 44: Europe Contact Lenses Market Volume (K Unit), by Product Type 2024 & 2032
- Figure 45: Europe Contact Lenses Market Revenue Share (%), by Product Type 2024 & 2032
- Figure 46: Europe Contact Lenses Market Volume Share (%), by Product Type 2024 & 2032
- Figure 47: Europe Contact Lenses Market Revenue (Million), by Usage 2024 & 2032
- Figure 48: Europe Contact Lenses Market Volume (K Unit), by Usage 2024 & 2032
- Figure 49: Europe Contact Lenses Market Revenue Share (%), by Usage 2024 & 2032
- Figure 50: Europe Contact Lenses Market Volume Share (%), by Usage 2024 & 2032
- Figure 51: Europe Contact Lenses Market Revenue (Million), by Modality 2024 & 2032
- Figure 52: Europe Contact Lenses Market Volume (K Unit), by Modality 2024 & 2032
- Figure 53: Europe Contact Lenses Market Revenue Share (%), by Modality 2024 & 2032
- Figure 54: Europe Contact Lenses Market Volume Share (%), by Modality 2024 & 2032
- Figure 55: Europe Contact Lenses Market Revenue (Million), by Design 2024 & 2032
- Figure 56: Europe Contact Lenses Market Volume (K Unit), by Design 2024 & 2032
- Figure 57: Europe Contact Lenses Market Revenue Share (%), by Design 2024 & 2032
- Figure 58: Europe Contact Lenses Market Volume Share (%), by Design 2024 & 2032
- Figure 59: Europe Contact Lenses Market Revenue (Million), by Country 2024 & 2032
- Figure 60: Europe Contact Lenses Market Volume (K Unit), by Country 2024 & 2032
- Figure 61: Europe Contact Lenses Market Revenue Share (%), by Country 2024 & 2032
- Figure 62: Europe Contact Lenses Market Volume Share (%), by Country 2024 & 2032
- Figure 63: Asia Pacific Contact Lenses Market Revenue (Million), by Product Type 2024 & 2032
- Figure 64: Asia Pacific Contact Lenses Market Volume (K Unit), by Product Type 2024 & 2032
- Figure 65: Asia Pacific Contact Lenses Market Revenue Share (%), by Product Type 2024 & 2032
- Figure 66: Asia Pacific Contact Lenses Market Volume Share (%), by Product Type 2024 & 2032
- Figure 67: Asia Pacific Contact Lenses Market Revenue (Million), by Usage 2024 & 2032
- Figure 68: Asia Pacific Contact Lenses Market Volume (K Unit), by Usage 2024 & 2032
- Figure 69: Asia Pacific Contact Lenses Market Revenue Share (%), by Usage 2024 & 2032
- Figure 70: Asia Pacific Contact Lenses Market Volume Share (%), by Usage 2024 & 2032
- Figure 71: Asia Pacific Contact Lenses Market Revenue (Million), by Modality 2024 & 2032
- Figure 72: Asia Pacific Contact Lenses Market Volume (K Unit), by Modality 2024 & 2032
- Figure 73: Asia Pacific Contact Lenses Market Revenue Share (%), by Modality 2024 & 2032
- Figure 74: Asia Pacific Contact Lenses Market Volume Share (%), by Modality 2024 & 2032
- Figure 75: Asia Pacific Contact Lenses Market Revenue (Million), by Design 2024 & 2032
- Figure 76: Asia Pacific Contact Lenses Market Volume (K Unit), by Design 2024 & 2032
- Figure 77: Asia Pacific Contact Lenses Market Revenue Share (%), by Design 2024 & 2032
- Figure 78: Asia Pacific Contact Lenses Market Volume Share (%), by Design 2024 & 2032
- Figure 79: Asia Pacific Contact Lenses Market Revenue (Million), by Country 2024 & 2032
- Figure 80: Asia Pacific Contact Lenses Market Volume (K Unit), by Country 2024 & 2032
- Figure 81: Asia Pacific Contact Lenses Market Revenue Share (%), by Country 2024 & 2032
- Figure 82: Asia Pacific Contact Lenses Market Volume Share (%), by Country 2024 & 2032
- Figure 83: Middle East and Africa Contact Lenses Market Revenue (Million), by Product Type 2024 & 2032
- Figure 84: Middle East and Africa Contact Lenses Market Volume (K Unit), by Product Type 2024 & 2032
- Figure 85: Middle East and Africa Contact Lenses Market Revenue Share (%), by Product Type 2024 & 2032
- Figure 86: Middle East and Africa Contact Lenses Market Volume Share (%), by Product Type 2024 & 2032
- Figure 87: Middle East and Africa Contact Lenses Market Revenue (Million), by Usage 2024 & 2032
- Figure 88: Middle East and Africa Contact Lenses Market Volume (K Unit), by Usage 2024 & 2032
- Figure 89: Middle East and Africa Contact Lenses Market Revenue Share (%), by Usage 2024 & 2032
- Figure 90: Middle East and Africa Contact Lenses Market Volume Share (%), by Usage 2024 & 2032
- Figure 91: Middle East and Africa Contact Lenses Market Revenue (Million), by Modality 2024 & 2032
- Figure 92: Middle East and Africa Contact Lenses Market Volume (K Unit), by Modality 2024 & 2032
- Figure 93: Middle East and Africa Contact Lenses Market Revenue Share (%), by Modality 2024 & 2032
- Figure 94: Middle East and Africa Contact Lenses Market Volume Share (%), by Modality 2024 & 2032
- Figure 95: Middle East and Africa Contact Lenses Market Revenue (Million), by Design 2024 & 2032
- Figure 96: Middle East and Africa Contact Lenses Market Volume (K Unit), by Design 2024 & 2032
- Figure 97: Middle East and Africa Contact Lenses Market Revenue Share (%), by Design 2024 & 2032
- Figure 98: Middle East and Africa Contact Lenses Market Volume Share (%), by Design 2024 & 2032
- Figure 99: Middle East and Africa Contact Lenses Market Revenue (Million), by Country 2024 & 2032
- Figure 100: Middle East and Africa Contact Lenses Market Volume (K Unit), by Country 2024 & 2032
- Figure 101: Middle East and Africa Contact Lenses Market Revenue Share (%), by Country 2024 & 2032
- Figure 102: Middle East and Africa Contact Lenses Market Volume Share (%), by Country 2024 & 2032
- Figure 103: South America Contact Lenses Market Revenue (Million), by Product Type 2024 & 2032
- Figure 104: South America Contact Lenses Market Volume (K Unit), by Product Type 2024 & 2032
- Figure 105: South America Contact Lenses Market Revenue Share (%), by Product Type 2024 & 2032
- Figure 106: South America Contact Lenses Market Volume Share (%), by Product Type 2024 & 2032
- Figure 107: South America Contact Lenses Market Revenue (Million), by Usage 2024 & 2032
- Figure 108: South America Contact Lenses Market Volume (K Unit), by Usage 2024 & 2032
- Figure 109: South America Contact Lenses Market Revenue Share (%), by Usage 2024 & 2032
- Figure 110: South America Contact Lenses Market Volume Share (%), by Usage 2024 & 2032
- Figure 111: South America Contact Lenses Market Revenue (Million), by Modality 2024 & 2032
- Figure 112: South America Contact Lenses Market Volume (K Unit), by Modality 2024 & 2032
- Figure 113: South America Contact Lenses Market Revenue Share (%), by Modality 2024 & 2032
- Figure 114: South America Contact Lenses Market Volume Share (%), by Modality 2024 & 2032
- Figure 115: South America Contact Lenses Market Revenue (Million), by Design 2024 & 2032
- Figure 116: South America Contact Lenses Market Volume (K Unit), by Design 2024 & 2032
- Figure 117: South America Contact Lenses Market Revenue Share (%), by Design 2024 & 2032
- Figure 118: South America Contact Lenses Market Volume Share (%), by Design 2024 & 2032
- Figure 119: South America Contact Lenses Market Revenue (Million), by Country 2024 & 2032
- Figure 120: South America Contact Lenses Market Volume (K Unit), by Country 2024 & 2032
- Figure 121: South America Contact Lenses Market Revenue Share (%), by Country 2024 & 2032
- Figure 122: South America Contact Lenses Market Volume Share (%), by Country 2024 & 2032
List of Tables
- Table 1: Global Contact Lenses Market Revenue Million Forecast, by Region 2019 & 2032
- Table 2: Global Contact Lenses Market Volume K Unit Forecast, by Region 2019 & 2032
- Table 3: Global Contact Lenses Market Revenue Million Forecast, by Product Type 2019 & 2032
- Table 4: Global Contact Lenses Market Volume K Unit Forecast, by Product Type 2019 & 2032
- Table 5: Global Contact Lenses Market Revenue Million Forecast, by Usage 2019 & 2032
- Table 6: Global Contact Lenses Market Volume K Unit Forecast, by Usage 2019 & 2032
- Table 7: Global Contact Lenses Market Revenue Million Forecast, by Modality 2019 & 2032
- Table 8: Global Contact Lenses Market Volume K Unit Forecast, by Modality 2019 & 2032
- Table 9: Global Contact Lenses Market Revenue Million Forecast, by Design 2019 & 2032
- Table 10: Global Contact Lenses Market Volume K Unit Forecast, by Design 2019 & 2032
- Table 11: Global Contact Lenses Market Revenue Million Forecast, by Region 2019 & 2032
- Table 12: Global Contact Lenses Market Volume K Unit Forecast, by Region 2019 & 2032
- Table 13: Global Contact Lenses Market Revenue Million Forecast, by Country 2019 & 2032
- Table 14: Global Contact Lenses Market Volume K Unit Forecast, by Country 2019 & 2032
- Table 15: United States Contact Lenses Market Revenue (Million) Forecast, by Application 2019 & 2032
- Table 16: United States Contact Lenses Market Volume (K Unit) Forecast, by Application 2019 & 2032
- Table 17: Canada Contact Lenses Market Revenue (Million) Forecast, by Application 2019 & 2032
- Table 18: Canada Contact Lenses Market Volume (K Unit) Forecast, by Application 2019 & 2032
- Table 19: Mexico Contact Lenses Market Revenue (Million) Forecast, by Application 2019 & 2032
- Table 20: Mexico Contact Lenses Market Volume (K Unit) Forecast, by Application 2019 & 2032
- Table 21: Global Contact Lenses Market Revenue Million Forecast, by Country 2019 & 2032
- Table 22: Global Contact Lenses Market Volume K Unit Forecast, by Country 2019 & 2032
- Table 23: United Kingdom Contact Lenses Market Revenue (Million) Forecast, by Application 2019 & 2032
- Table 24: United Kingdom Contact Lenses Market Volume (K Unit) Forecast, by Application 2019 & 2032
- Table 25: Germany Contact Lenses Market Revenue (Million) Forecast, by Application 2019 & 2032
- Table 26: Germany Contact Lenses Market Volume (K Unit) Forecast, by Application 2019 & 2032
- Table 27: France Contact Lenses Market Revenue (Million) Forecast, by Application 2019 & 2032
- Table 28: France Contact Lenses Market Volume (K Unit) Forecast, by Application 2019 & 2032
- Table 29: Italy Contact Lenses Market Revenue (Million) Forecast, by Application 2019 & 2032
- Table 30: Italy Contact Lenses Market Volume (K Unit) Forecast, by Application 2019 & 2032
- Table 31: Spain Contact Lenses Market Revenue (Million) Forecast, by Application 2019 & 2032
- Table 32: Spain Contact Lenses Market Volume (K Unit) Forecast, by Application 2019 & 2032
- Table 33: Rest of Europe Contact Lenses Market Revenue (Million) Forecast, by Application 2019 & 2032
- Table 34: Rest of Europe Contact Lenses Market Volume (K Unit) Forecast, by Application 2019 & 2032
- Table 35: Global Contact Lenses Market Revenue Million Forecast, by Country 2019 & 2032
- Table 36: Global Contact Lenses Market Volume K Unit Forecast, by Country 2019 & 2032
- Table 37: China Contact Lenses Market Revenue (Million) Forecast, by Application 2019 & 2032
- Table 38: China Contact Lenses Market Volume (K Unit) Forecast, by Application 2019 & 2032
- Table 39: Japan Contact Lenses Market Revenue (Million) Forecast, by Application 2019 & 2032
- Table 40: Japan Contact Lenses Market Volume (K Unit) Forecast, by Application 2019 & 2032
- Table 41: India Contact Lenses Market Revenue (Million) Forecast, by Application 2019 & 2032
- Table 42: India Contact Lenses Market Volume (K Unit) Forecast, by Application 2019 & 2032
- Table 43: Australia Contact Lenses Market Revenue (Million) Forecast, by Application 2019 & 2032
- Table 44: Australia Contact Lenses Market Volume (K Unit) Forecast, by Application 2019 & 2032
- Table 45: South Korea Contact Lenses Market Revenue (Million) Forecast, by Application 2019 & 2032
- Table 46: South Korea Contact Lenses Market Volume (K Unit) Forecast, by Application 2019 & 2032
- Table 47: Rest of Asia Pacific Contact Lenses Market Revenue (Million) Forecast, by Application 2019 & 2032
- Table 48: Rest of Asia Pacific Contact Lenses Market Volume (K Unit) Forecast, by Application 2019 & 2032
- Table 49: Global Contact Lenses Market Revenue Million Forecast, by Country 2019 & 2032
- Table 50: Global Contact Lenses Market Volume K Unit Forecast, by Country 2019 & 2032
- Table 51: GCC Contact Lenses Market Revenue (Million) Forecast, by Application 2019 & 2032
- Table 52: GCC Contact Lenses Market Volume (K Unit) Forecast, by Application 2019 & 2032
- Table 53: South Africa Contact Lenses Market Revenue (Million) Forecast, by Application 2019 & 2032
- Table 54: South Africa Contact Lenses Market Volume (K Unit) Forecast, by Application 2019 & 2032
- Table 55: Rest of Middle East and Africa Contact Lenses Market Revenue (Million) Forecast, by Application 2019 & 2032
- Table 56: Rest of Middle East and Africa Contact Lenses Market Volume (K Unit) Forecast, by Application 2019 & 2032
- Table 57: Global Contact Lenses Market Revenue Million Forecast, by Country 2019 & 2032
- Table 58: Global Contact Lenses Market Volume K Unit Forecast, by Country 2019 & 2032
- Table 59: Brazil Contact Lenses Market Revenue (Million) Forecast, by Application 2019 & 2032
- Table 60: Brazil Contact Lenses Market Volume (K Unit) Forecast, by Application 2019 & 2032
- Table 61: Argentina Contact Lenses Market Revenue (Million) Forecast, by Application 2019 & 2032
- Table 62: Argentina Contact Lenses Market Volume (K Unit) Forecast, by Application 2019 & 2032
- Table 63: Rest of South America Contact Lenses Market Revenue (Million) Forecast, by Application 2019 & 2032
- Table 64: Rest of South America Contact Lenses Market Volume (K Unit) Forecast, by Application 2019 & 2032
- Table 65: Global Contact Lenses Market Revenue Million Forecast, by Product Type 2019 & 2032
- Table 66: Global Contact Lenses Market Volume K Unit Forecast, by Product Type 2019 & 2032
- Table 67: Global Contact Lenses Market Revenue Million Forecast, by Usage 2019 & 2032
- Table 68: Global Contact Lenses Market Volume K Unit Forecast, by Usage 2019 & 2032
- Table 69: Global Contact Lenses Market Revenue Million Forecast, by Modality 2019 & 2032
- Table 70: Global Contact Lenses Market Volume K Unit Forecast, by Modality 2019 & 2032
- Table 71: Global Contact Lenses Market Revenue Million Forecast, by Design 2019 & 2032
- Table 72: Global Contact Lenses Market Volume K Unit Forecast, by Design 2019 & 2032
- Table 73: Global Contact Lenses Market Revenue Million Forecast, by Country 2019 & 2032
- Table 74: Global Contact Lenses Market Volume K Unit Forecast, by Country 2019 & 2032
- Table 75: United States Contact Lenses Market Revenue (Million) Forecast, by Application 2019 & 2032
- Table 76: United States Contact Lenses Market Volume (K Unit) Forecast, by Application 2019 & 2032
- Table 77: Canada Contact Lenses Market Revenue (Million) Forecast, by Application 2019 & 2032
- Table 78: Canada Contact Lenses Market Volume (K Unit) Forecast, by Application 2019 & 2032
- Table 79: Mexico Contact Lenses Market Revenue (Million) Forecast, by Application 2019 & 2032
- Table 80: Mexico Contact Lenses Market Volume (K Unit) Forecast, by Application 2019 & 2032
- Table 81: Global Contact Lenses Market Revenue Million Forecast, by Product Type 2019 & 2032
- Table 82: Global Contact Lenses Market Volume K Unit Forecast, by Product Type 2019 & 2032
- Table 83: Global Contact Lenses Market Revenue Million Forecast, by Usage 2019 & 2032
- Table 84: Global Contact Lenses Market Volume K Unit Forecast, by Usage 2019 & 2032
- Table 85: Global Contact Lenses Market Revenue Million Forecast, by Modality 2019 & 2032
- Table 86: Global Contact Lenses Market Volume K Unit Forecast, by Modality 2019 & 2032
- Table 87: Global Contact Lenses Market Revenue Million Forecast, by Design 2019 & 2032
- Table 88: Global Contact Lenses Market Volume K Unit Forecast, by Design 2019 & 2032
- Table 89: Global Contact Lenses Market Revenue Million Forecast, by Country 2019 & 2032
- Table 90: Global Contact Lenses Market Volume K Unit Forecast, by Country 2019 & 2032
- Table 91: United Kingdom Contact Lenses Market Revenue (Million) Forecast, by Application 2019 & 2032
- Table 92: United Kingdom Contact Lenses Market Volume (K Unit) Forecast, by Application 2019 & 2032
- Table 93: Germany Contact Lenses Market Revenue (Million) Forecast, by Application 2019 & 2032
- Table 94: Germany Contact Lenses Market Volume (K Unit) Forecast, by Application 2019 & 2032
- Table 95: France Contact Lenses Market Revenue (Million) Forecast, by Application 2019 & 2032
- Table 96: France Contact Lenses Market Volume (K Unit) Forecast, by Application 2019 & 2032
- Table 97: Italy Contact Lenses Market Revenue (Million) Forecast, by Application 2019 & 2032
- Table 98: Italy Contact Lenses Market Volume (K Unit) Forecast, by Application 2019 & 2032
- Table 99: Spain Contact Lenses Market Revenue (Million) Forecast, by Application 2019 & 2032
- Table 100: Spain Contact Lenses Market Volume (K Unit) Forecast, by Application 2019 & 2032
- Table 101: Rest of Europe Contact Lenses Market Revenue (Million) Forecast, by Application 2019 & 2032
- Table 102: Rest of Europe Contact Lenses Market Volume (K Unit) Forecast, by Application 2019 & 2032
- Table 103: Global Contact Lenses Market Revenue Million Forecast, by Product Type 2019 & 2032
- Table 104: Global Contact Lenses Market Volume K Unit Forecast, by Product Type 2019 & 2032
- Table 105: Global Contact Lenses Market Revenue Million Forecast, by Usage 2019 & 2032
- Table 106: Global Contact Lenses Market Volume K Unit Forecast, by Usage 2019 & 2032
- Table 107: Global Contact Lenses Market Revenue Million Forecast, by Modality 2019 & 2032
- Table 108: Global Contact Lenses Market Volume K Unit Forecast, by Modality 2019 & 2032
- Table 109: Global Contact Lenses Market Revenue Million Forecast, by Design 2019 & 2032
- Table 110: Global Contact Lenses Market Volume K Unit Forecast, by Design 2019 & 2032
- Table 111: Global Contact Lenses Market Revenue Million Forecast, by Country 2019 & 2032
- Table 112: Global Contact Lenses Market Volume K Unit Forecast, by Country 2019 & 2032
- Table 113: China Contact Lenses Market Revenue (Million) Forecast, by Application 2019 & 2032
- Table 114: China Contact Lenses Market Volume (K Unit) Forecast, by Application 2019 & 2032
- Table 115: Japan Contact Lenses Market Revenue (Million) Forecast, by Application 2019 & 2032
- Table 116: Japan Contact Lenses Market Volume (K Unit) Forecast, by Application 2019 & 2032
- Table 117: India Contact Lenses Market Revenue (Million) Forecast, by Application 2019 & 2032
- Table 118: India Contact Lenses Market Volume (K Unit) Forecast, by Application 2019 & 2032
- Table 119: Australia Contact Lenses Market Revenue (Million) Forecast, by Application 2019 & 2032
- Table 120: Australia Contact Lenses Market Volume (K Unit) Forecast, by Application 2019 & 2032
- Table 121: South Korea Contact Lenses Market Revenue (Million) Forecast, by Application 2019 & 2032
- Table 122: South Korea Contact Lenses Market Volume (K Unit) Forecast, by Application 2019 & 2032
- Table 123: Rest of Asia Pacific Contact Lenses Market Revenue (Million) Forecast, by Application 2019 & 2032
- Table 124: Rest of Asia Pacific Contact Lenses Market Volume (K Unit) Forecast, by Application 2019 & 2032
- Table 125: Global Contact Lenses Market Revenue Million Forecast, by Product Type 2019 & 2032
- Table 126: Global Contact Lenses Market Volume K Unit Forecast, by Product Type 2019 & 2032
- Table 127: Global Contact Lenses Market Revenue Million Forecast, by Usage 2019 & 2032
- Table 128: Global Contact Lenses Market Volume K Unit Forecast, by Usage 2019 & 2032
- Table 129: Global Contact Lenses Market Revenue Million Forecast, by Modality 2019 & 2032
- Table 130: Global Contact Lenses Market Volume K Unit Forecast, by Modality 2019 & 2032
- Table 131: Global Contact Lenses Market Revenue Million Forecast, by Design 2019 & 2032
- Table 132: Global Contact Lenses Market Volume K Unit Forecast, by Design 2019 & 2032
- Table 133: Global Contact Lenses Market Revenue Million Forecast, by Country 2019 & 2032
- Table 134: Global Contact Lenses Market Volume K Unit Forecast, by Country 2019 & 2032
- Table 135: GCC Contact Lenses Market Revenue (Million) Forecast, by Application 2019 & 2032
- Table 136: GCC Contact Lenses Market Volume (K Unit) Forecast, by Application 2019 & 2032
- Table 137: South Africa Contact Lenses Market Revenue (Million) Forecast, by Application 2019 & 2032
- Table 138: South Africa Contact Lenses Market Volume (K Unit) Forecast, by Application 2019 & 2032
- Table 139: Rest of Middle East and Africa Contact Lenses Market Revenue (Million) Forecast, by Application 2019 & 2032
- Table 140: Rest of Middle East and Africa Contact Lenses Market Volume (K Unit) Forecast, by Application 2019 & 2032
- Table 141: Global Contact Lenses Market Revenue Million Forecast, by Product Type 2019 & 2032
- Table 142: Global Contact Lenses Market Volume K Unit Forecast, by Product Type 2019 & 2032
- Table 143: Global Contact Lenses Market Revenue Million Forecast, by Usage 2019 & 2032
- Table 144: Global Contact Lenses Market Volume K Unit Forecast, by Usage 2019 & 2032
- Table 145: Global Contact Lenses Market Revenue Million Forecast, by Modality 2019 & 2032
- Table 146: Global Contact Lenses Market Volume K Unit Forecast, by Modality 2019 & 2032
- Table 147: Global Contact Lenses Market Revenue Million Forecast, by Design 2019 & 2032
- Table 148: Global Contact Lenses Market Volume K Unit Forecast, by Design 2019 & 2032
- Table 149: Global Contact Lenses Market Revenue Million Forecast, by Country 2019 & 2032
- Table 150: Global Contact Lenses Market Volume K Unit Forecast, by Country 2019 & 2032
- Table 151: Brazil Contact Lenses Market Revenue (Million) Forecast, by Application 2019 & 2032
- Table 152: Brazil Contact Lenses Market Volume (K Unit) Forecast, by Application 2019 & 2032
- Table 153: Argentina Contact Lenses Market Revenue (Million) Forecast, by Application 2019 & 2032
- Table 154: Argentina Contact Lenses Market Volume (K Unit) Forecast, by Application 2019 & 2032
- Table 155: Rest of South America Contact Lenses Market Revenue (Million) Forecast, by Application 2019 & 2032
- Table 156: Rest of South America Contact Lenses Market Volume (K Unit) Forecast, by Application 2019 & 2032
Frequently Asked Questions
1. What is the projected Compound Annual Growth Rate (CAGR) of the Contact Lenses Market?
The projected CAGR is approximately 3.66%.
2. Which companies are prominent players in the Contact Lenses Market?
Key companies in the market include Eyemera INC, Essilor International SA, The Cooper Companies, Alcon Vision LLC, SynergEyes Inc, Menicon Co Ltd, Zeiss Group, Johnson & Johnson Vision Care Inc, Seed Co Ltd, Bausch Health Companies Inc, Hoya Corporation.
3. What are the main segments of the Contact Lenses Market?
The market segments include Product Type, Usage, Modality, Design.
4. Can you provide details about the market size?
The market size is estimated to be USD 10.23 Million as of 2022.
5. What are some drivers contributing to market growth?
Increasing Burden of Optical Disorders; Increasing Tendency to Enhance Aesthetics.
6. What are the notable trends driving market growth?
Corrective Contact Lenses are Expected to Register a Significant Growth Rate over the Forecast Period.
7. Are there any restraints impacting market growth?
Availability of Alternative Techniques and Complications Associated with Lenses4.3.2.
8. Can you provide examples of recent developments in the market?
June 2022: Johnson & Johnson Vision, a part of Johnson & Johnson MedTech, received FDA clearance for its latest contact lens innovation, ACUVUE OASYS MAX 1-Day and ACUVUE OASYS MAX 1-Day MULTIFOCAL.
9. What pricing options are available for accessing the report?
Pricing options include single-user, multi-user, and enterprise licenses priced at USD 4750, USD 5250, and USD 8750 respectively.
10. Is the market size provided in terms of value or volume?
The market size is provided in terms of value, measured in Million and volume, measured in K Unit.
11. Are there any specific market keywords associated with the report?
Yes, the market keyword associated with the report is "Contact Lenses Market," which aids in identifying and referencing the specific market segment covered.
12. How do I determine which pricing option suits my needs best?
The pricing options vary based on user requirements and access needs. Individual users may opt for single-user licenses, while businesses requiring broader access may choose multi-user or enterprise licenses for cost-effective access to the report.
13. Are there any additional resources or data provided in the Contact Lenses Market report?
While the report offers comprehensive insights, it's advisable to review the specific contents or supplementary materials provided to ascertain if additional resources or data are available.
14. How can I stay updated on further developments or reports in the Contact Lenses Market?
To stay informed about further developments, trends, and reports in the Contact Lenses Market, consider subscribing to industry newsletters, following relevant companies and organizations, or regularly checking reputable industry news sources and publications.
Methodology
Step 1 - Identification of Relevant Samples Size from Population Database


Step 2 - Approaches for Defining Global Market Size (Value, Volume* & Price*)

Note*: In applicable scenarios
Step 3 - Data Sources
Primary Research
- Web Analytics
- Survey Reports
- Research Institute
- Latest Research Reports
- Opinion Leaders
Secondary Research
- Annual Reports
- White Paper
- Latest Press Release
- Industry Association
- Paid Database
- Investor Presentations

Step 4 - Data Triangulation
Involves using different sources of information in order to increase the validity of a study
These sources are likely to be stakeholders in a program - participants, other researchers, program staff, other community members, and so on.
Then we put all data in single framework & apply various statistical tools to find out the dynamic on the market.
During the analysis stage, feedback from the stakeholder groups would be compared to determine areas of agreement as well as areas of divergence


