
Key Insights
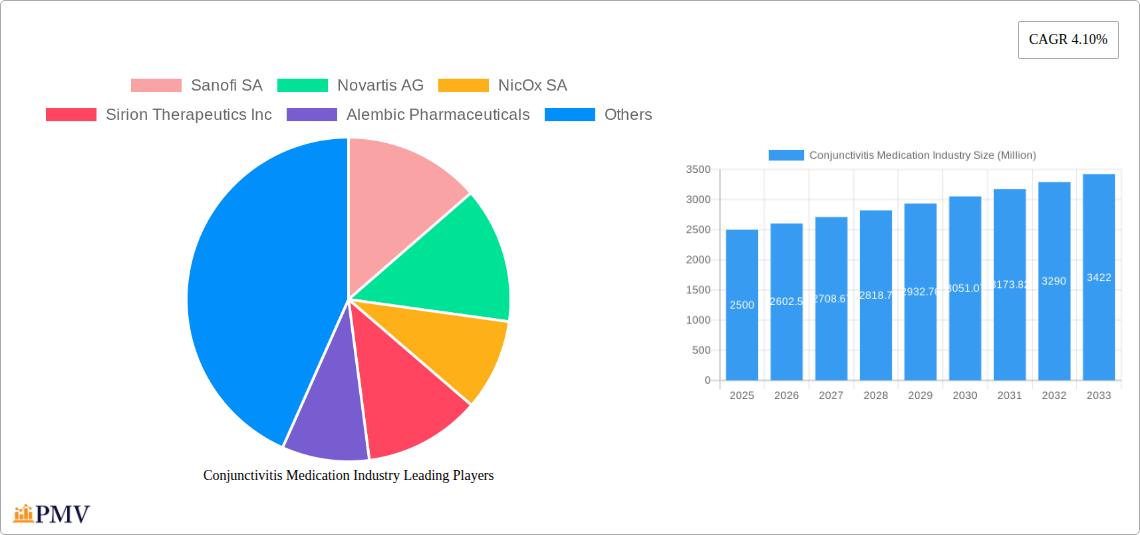
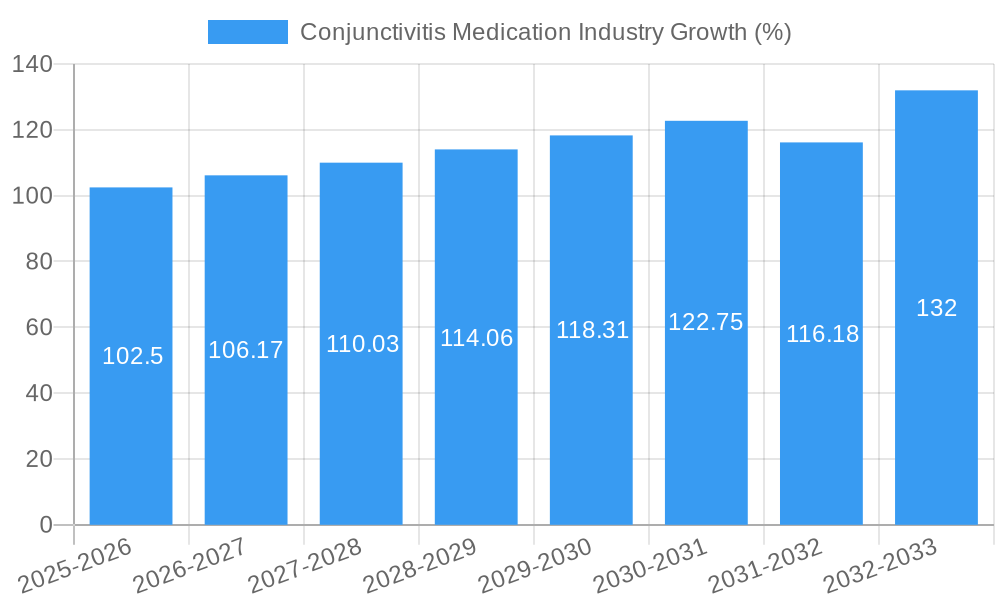
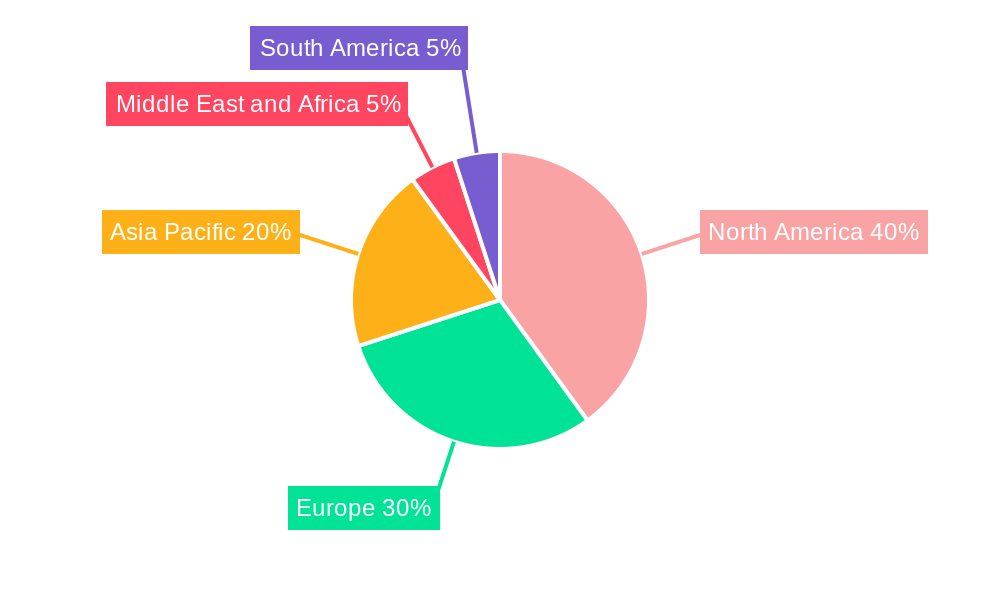
The global conjunctivitis medication market, valued at approximately $2.5 billion in 2025, is projected to experience steady growth, exhibiting a compound annual growth rate (CAGR) of 4.10% from 2025 to 2033. This growth is driven by several key factors. Rising prevalence of allergic conjunctivitis, particularly in regions with high levels of air pollution and pollen, is a significant contributor. Furthermore, increasing awareness of effective treatment options and improved healthcare infrastructure, especially in developing economies, are fueling market expansion. The shift towards convenient formulations like eye drops, alongside the development of novel, more effective medications, further stimulates market demand. However, the market faces certain restraints, including the availability of generic alternatives, which can exert price pressure, and the potential for adverse reactions associated with some medications, leading to patient hesitancy. Segmentation reveals that allergic conjunctivitis dominates the disease-type segment, while eye drops are the preferred formulation, showcasing the market's preference for convenient and readily available treatment options. The North American market currently holds a significant share, due to high healthcare expenditure and advanced medical infrastructure, but the Asia-Pacific region is anticipated to showcase robust growth, reflecting rising healthcare awareness and an expanding middle class.
The competitive landscape is characterized by the presence of both large multinational pharmaceutical companies and specialized ophthalmic players. Companies like Sanofi, Novartis, and Bausch & Lomb hold considerable market share, leveraging their extensive distribution networks and established brand recognition. However, smaller companies focusing on innovative therapies and niche markets are also actively contributing to the market's growth. The future of the conjunctivitis medication market hinges on continued innovation in treatment modalities, particularly targeting unmet medical needs like chronic conjunctivitis and resistant bacterial strains. Furthermore, strategic partnerships and collaborations between pharmaceutical companies and healthcare providers will play a crucial role in enhancing market penetration and expanding access to effective treatment options, especially in underserved populations.
Conjunctivitis Medication Industry: Market Report 2019-2033
This comprehensive report provides a detailed analysis of the Conjunctivitis Medication industry, covering market size, segmentation, competitive landscape, and future growth prospects. The study period spans from 2019 to 2033, with 2025 serving as the base and estimated year. The forecast period extends from 2025 to 2033, while the historical period encompasses 2019-2024. The report offers actionable insights for industry stakeholders, including pharmaceutical companies, investors, and healthcare professionals.
Conjunctivitis Medication Industry Market Structure & Competitive Dynamics
The Conjunctivitis Medication market is characterized by a moderately concentrated structure, with a few major players holding significant market share. The market's competitive intensity is driven by factors including product innovation, pricing strategies, and regulatory approvals. Key players engage in strategic alliances, mergers and acquisitions (M&A) to expand their product portfolios and geographic reach. While precise market share data for each company is proprietary information and not publicly available, estimates suggest that companies such as Sanofi SA, Novartis AG, and Bausch & Lomb Incorporated hold substantial market share. The total value of M&A deals in the sector during the historical period (2019-2024) is estimated to be around $xx Million.
- Market Concentration: Moderately concentrated, with a few dominant players.
- Innovation Ecosystem: Active R&D efforts focused on novel drug delivery systems and therapies for specific conjunctivitis types.
- Regulatory Frameworks: Stringent regulatory pathways influence product approvals and market entry.
- Product Substitutes: Over-the-counter remedies and traditional treatments compete with pharmaceutical products.
- End-User Trends: Increasing awareness of conjunctivitis and the demand for effective treatments drive market growth.
- M&A Activities: Significant consolidation through mergers and acquisitions aiming to increase market share and broaden product pipelines.
Conjunctivitis Medication Industry Industry Trends & Insights
The Conjunctivitis Medication market exhibits robust growth, driven by factors such as rising prevalence of conjunctivitis, increasing healthcare expenditure, and advancements in treatment options. The market is witnessing a Compound Annual Growth Rate (CAGR) of approximately xx% during the forecast period (2025-2033). Technological advancements, including the development of novel drug delivery systems and targeted therapies, are significantly influencing market dynamics. Consumer preferences are shifting towards convenient and effective formulations like eye drops. Market penetration of newer, more effective treatments is steadily increasing. Competitive dynamics involve continuous product innovation and strategic collaborations.
Dominant Markets & Segments in Conjunctivitis Medication Industry
The global Conjunctivitis Medication market is dominated by North America and Europe, driven by higher healthcare spending and advanced healthcare infrastructure. Within these regions, the United States holds a significant share.
By Disease Type:
- Allergic Conjunctivitis: This segment holds the largest market share due to high prevalence and increased awareness. Key drivers include rising allergies and air pollution levels.
- Bacterial Conjunctivitis: This segment displays significant growth potential, driven by increasing bacterial infections and the need for effective antibiotics.
- Viral Conjunctivitis: This segment shows moderate growth, influenced by the seasonal nature of viral outbreaks.
By Formulation Type:
Drops: This is the most dominant segment due to ease of application and widespread patient acceptance.
Ointment: This segment shows moderate growth, preferred for its longer duration of action.
Drugs: This segment holds a relatively smaller share compared to drops and ointments.
Key Drivers: Increased healthcare expenditure, improved diagnostics, rising awareness about conjunctivitis, and technological advancements in treatment methods.
Conjunctivitis Medication Industry Product Innovations
The Conjunctivitis Medication market is witnessing significant product innovations, focusing on improved efficacy, safety, and convenience. New drug delivery systems, such as nanotechnology-based formulations, are being developed to enhance drug absorption and reduce side effects. The market also observes a trend towards personalized medicine, with efforts to develop targeted therapies for specific conjunctivitis subtypes. These innovations aim to address unmet needs and improve treatment outcomes, resulting in improved market fit and competitive advantages.
Report Segmentation & Scope
This report segments the Conjunctivitis Medication market based on disease type (Allergic, Bacterial, Viral Conjunctivitis) and formulation type (Ointment, Drops, Drugs). Each segment's growth projection, market size (in Millions), and competitive dynamics are analyzed in detail. For instance, the Allergic Conjunctivitis segment is projected to exhibit a CAGR of xx% during the forecast period, driven by rising allergy prevalence. The Drops segment is expected to maintain its dominance due to convenient application. The Bacterial Conjunctivitis segment shows growth potential linked to antibiotic advancements.
Key Drivers of Conjunctivitis Medication Industry Growth
Several factors contribute to the growth of the Conjunctivitis Medication market. Technological advancements like novel drug delivery systems and improved diagnostic tools are pivotal. Rising healthcare expenditure globally, particularly in developing economies, fuels market expansion. Favorable regulatory landscapes facilitating drug approvals also contribute significantly. Finally, increased awareness campaigns educating patients on conjunctivitis and available treatments accelerate market growth.
Challenges in the Conjunctivitis Medication Industry Sector
The Conjunctivitis Medication market faces challenges including stringent regulatory requirements for drug approvals, leading to extended development timelines and increased costs. Supply chain disruptions due to global events can also impact product availability. Moreover, intense competition among existing players necessitates continuous innovation and efficient cost management to maintain profitability. The prevalence of generic medications and over-the-counter alternatives puts pressure on pricing strategies for branded drugs.
Leading Players in the Conjunctivitis Medication Industry Market
- Sanofi SA
- Novartis AG
- NicOx SA
- Sirion Therapeutics Inc
- Alembic Pharmaceuticals
- Santen Pharmaceuticals Co Ltd
- Bausch & Lomb Incorporated
- Allergan PLC (Now part of AbbVie)
- Auven Therapeutics
- IBA Vision Opthalmics
- Pfizer Inc
Key Developments in Conjunctivitis Medication Industry Sector
- May 2022: Santen Pharmaceutical received approval for Verkazia from the NMPA in China for treating severe vernal keratoconjunctivitis (VKC) in children and adolescents aged four years and above. This expands market access for Santen and highlights the growing focus on pediatric conjunctivitis treatments.
- March 2022: Visus Therapeutics Inc. announced the launch of pivotal Phase 3 trials for BRIMOCHOL PF, a topical preservative-free ophthalmic solution for treating presbyopia. This indicates potential expansion beyond conjunctivitis treatments into related ophthalmic areas.
Strategic Conjunctivitis Medication Industry Market Outlook
The Conjunctivitis Medication market presents significant growth opportunities fueled by unmet needs, particularly in developing economies. Strategic partnerships and collaborations between pharmaceutical companies and research institutions can accelerate innovation. Focusing on novel drug delivery systems and personalized therapies will further drive market growth. The development of effective treatments for less common forms of conjunctivitis, such as those associated with autoimmune diseases, represents another crucial avenue for future expansion and profitability.
Conjunctivitis Medication Industry Segmentation
-
1. Disease Type
- 1.1. Allergic Conjunctivitis
- 1.2. Bacterial Conjunctivitis
- 1.3. Viral Conjunctivitis
-
2. Formulation Type
- 2.1. Eye Drops
- 2.2. Ointments
- 2.3. Artificial Tears
- 2.4. Antihistamines
Conjunctivitis Medication Industry Segmentation By Geography
-
1. North America
- 1.1. United States
- 1.2. Canada
- 1.3. Mexico
-
2. Europe
- 2.1. Germany
- 2.2. United Kingdom
- 2.3. France
- 2.4. Italy
- 2.5. Spain
- 2.6. Rest of Europe
-
3. Asia Pacific
- 3.1. China
- 3.2. Japan
- 3.3. India
- 3.4. Australia
- 3.5. South Korea
- 3.6. Rest of Asia Pacific
-
4. Middle East and Africa
- 4.1. GCC
- 4.2. South Africa
- 4.3. Rest of Middle East and Africa
-
5. South America
- 5.1. Brazil
- 5.2. Argentina
- 5.3. Rest of South America
Conjunctivitis Medication Industry REPORT HIGHLIGHTS
| Aspects | Details |
|---|---|
| Study Period | 2019-2033 |
| Base Year | 2024 |
| Estimated Year | 2025 |
| Forecast Period | 2025-2033 |
| Historical Period | 2019-2024 |
| Growth Rate | CAGR of 4.10% from 2019-2033 |
| Segmentation |
|
Table of Contents
- 1. Introduction
- 1.1. Research Scope
- 1.2. Market Segmentation
- 1.3. Research Methodology
- 1.4. Definitions and Assumptions
- 2. Executive Summary
- 2.1. Introduction
- 3. Market Dynamics
- 3.1. Introduction
- 3.2. Market Drivers
- 3.2.1. Increasing Number of People Suffering From Conjunctivitis; Easy Availability of the Treatment
- 3.3. Market Restrains
- 3.3.1 Availability of Alternative Treatments
- 3.3.2 such as Home Remedies
- 3.4. Market Trends
- 3.4.1. Allergic Conjunctivitis is Expected to Witness a Steady Growth in the Conjunctivitis Treatment Over the Forecast Period
- 4. Market Factor Analysis
- 4.1. Porters Five Forces
- 4.2. Supply/Value Chain
- 4.3. PESTEL analysis
- 4.4. Market Entropy
- 4.5. Patent/Trademark Analysis
- 5. Global Conjunctivitis Medication Industry Analysis, Insights and Forecast, 2019-2031
- 5.1. Market Analysis, Insights and Forecast - by Disease Type
- 5.1.1. Allergic Conjunctivitis
- 5.1.2. Bacterial Conjunctivitis
- 5.1.3. Viral Conjunctivitis
- 5.2. Market Analysis, Insights and Forecast - by Formulation Type
- 5.2.1. Eye Drops
- 5.2.2. Ointments
- 5.2.3. Artificial Tears
- 5.2.4. Antihistamines
- 5.3. Market Analysis, Insights and Forecast - by Region
- 5.3.1. North America
- 5.3.2. Europe
- 5.3.3. Asia Pacific
- 5.3.4. Middle East and Africa
- 5.3.5. South America
- 5.1. Market Analysis, Insights and Forecast - by Disease Type
- 6. North America Conjunctivitis Medication Industry Analysis, Insights and Forecast, 2019-2031
- 6.1. Market Analysis, Insights and Forecast - by Disease Type
- 6.1.1. Allergic Conjunctivitis
- 6.1.2. Bacterial Conjunctivitis
- 6.1.3. Viral Conjunctivitis
- 6.2. Market Analysis, Insights and Forecast - by Formulation Type
- 6.2.1. Eye Drops
- 6.2.2. Ointments
- 6.2.3. Artificial Tears
- 6.2.4. Antihistamines
- 6.1. Market Analysis, Insights and Forecast - by Disease Type
- 7. Europe Conjunctivitis Medication Industry Analysis, Insights and Forecast, 2019-2031
- 7.1. Market Analysis, Insights and Forecast - by Disease Type
- 7.1.1. Allergic Conjunctivitis
- 7.1.2. Bacterial Conjunctivitis
- 7.1.3. Viral Conjunctivitis
- 7.2. Market Analysis, Insights and Forecast - by Formulation Type
- 7.2.1. Eye Drops
- 7.2.2. Ointments
- 7.2.3. Artificial Tears
- 7.2.4. Antihistamines
- 7.1. Market Analysis, Insights and Forecast - by Disease Type
- 8. Asia Pacific Conjunctivitis Medication Industry Analysis, Insights and Forecast, 2019-2031
- 8.1. Market Analysis, Insights and Forecast - by Disease Type
- 8.1.1. Allergic Conjunctivitis
- 8.1.2. Bacterial Conjunctivitis
- 8.1.3. Viral Conjunctivitis
- 8.2. Market Analysis, Insights and Forecast - by Formulation Type
- 8.2.1. Eye Drops
- 8.2.2. Ointments
- 8.2.3. Artificial Tears
- 8.2.4. Antihistamines
- 8.1. Market Analysis, Insights and Forecast - by Disease Type
- 9. Middle East and Africa Conjunctivitis Medication Industry Analysis, Insights and Forecast, 2019-2031
- 9.1. Market Analysis, Insights and Forecast - by Disease Type
- 9.1.1. Allergic Conjunctivitis
- 9.1.2. Bacterial Conjunctivitis
- 9.1.3. Viral Conjunctivitis
- 9.2. Market Analysis, Insights and Forecast - by Formulation Type
- 9.2.1. Eye Drops
- 9.2.2. Ointments
- 9.2.3. Artificial Tears
- 9.2.4. Antihistamines
- 9.1. Market Analysis, Insights and Forecast - by Disease Type
- 10. South America Conjunctivitis Medication Industry Analysis, Insights and Forecast, 2019-2031
- 10.1. Market Analysis, Insights and Forecast - by Disease Type
- 10.1.1. Allergic Conjunctivitis
- 10.1.2. Bacterial Conjunctivitis
- 10.1.3. Viral Conjunctivitis
- 10.2. Market Analysis, Insights and Forecast - by Formulation Type
- 10.2.1. Eye Drops
- 10.2.2. Ointments
- 10.2.3. Artificial Tears
- 10.2.4. Antihistamines
- 10.1. Market Analysis, Insights and Forecast - by Disease Type
- 11. North America Conjunctivitis Medication Industry Analysis, Insights and Forecast, 2019-2031
- 11.1. Market Analysis, Insights and Forecast - By Country/Sub-region
- 11.1.1 United States
- 11.1.2 Canada
- 11.1.3 Mexico
- 12. Europe Conjunctivitis Medication Industry Analysis, Insights and Forecast, 2019-2031
- 12.1. Market Analysis, Insights and Forecast - By Country/Sub-region
- 12.1.1 Germany
- 12.1.2 United Kingdom
- 12.1.3 France
- 12.1.4 Italy
- 12.1.5 Spain
- 12.1.6 Rest of Europe
- 13. Asia Pacific Conjunctivitis Medication Industry Analysis, Insights and Forecast, 2019-2031
- 13.1. Market Analysis, Insights and Forecast - By Country/Sub-region
- 13.1.1 China
- 13.1.2 Japan
- 13.1.3 India
- 13.1.4 Australia
- 13.1.5 South Korea
- 13.1.6 Rest of Asia Pacific
- 14. Middle East and Africa Conjunctivitis Medication Industry Analysis, Insights and Forecast, 2019-2031
- 14.1. Market Analysis, Insights and Forecast - By Country/Sub-region
- 14.1.1 GCC
- 14.1.2 South Africa
- 14.1.3 Rest of Middle East and Africa
- 15. South America Conjunctivitis Medication Industry Analysis, Insights and Forecast, 2019-2031
- 15.1. Market Analysis, Insights and Forecast - By Country/Sub-region
- 15.1.1 Brazil
- 15.1.2 Argentina
- 15.1.3 Rest of South America
- 16. Competitive Analysis
- 16.1. Global Market Share Analysis 2024
- 16.2. Company Profiles
- 16.2.1 Sanofi SA
- 16.2.1.1. Overview
- 16.2.1.2. Products
- 16.2.1.3. SWOT Analysis
- 16.2.1.4. Recent Developments
- 16.2.1.5. Financials (Based on Availability)
- 16.2.2 Novartis AG
- 16.2.2.1. Overview
- 16.2.2.2. Products
- 16.2.2.3. SWOT Analysis
- 16.2.2.4. Recent Developments
- 16.2.2.5. Financials (Based on Availability)
- 16.2.3 NicOx SA
- 16.2.3.1. Overview
- 16.2.3.2. Products
- 16.2.3.3. SWOT Analysis
- 16.2.3.4. Recent Developments
- 16.2.3.5. Financials (Based on Availability)
- 16.2.4 Sirion Therapeutics Inc
- 16.2.4.1. Overview
- 16.2.4.2. Products
- 16.2.4.3. SWOT Analysis
- 16.2.4.4. Recent Developments
- 16.2.4.5. Financials (Based on Availability)
- 16.2.5 Alembic Pharmaceuticals
- 16.2.5.1. Overview
- 16.2.5.2. Products
- 16.2.5.3. SWOT Analysis
- 16.2.5.4. Recent Developments
- 16.2.5.5. Financials (Based on Availability)
- 16.2.6 Santen Pharmaceuticals Co Ltd
- 16.2.6.1. Overview
- 16.2.6.2. Products
- 16.2.6.3. SWOT Analysis
- 16.2.6.4. Recent Developments
- 16.2.6.5. Financials (Based on Availability)
- 16.2.7 Bausch & Lomb Incorporated
- 16.2.7.1. Overview
- 16.2.7.2. Products
- 16.2.7.3. SWOT Analysis
- 16.2.7.4. Recent Developments
- 16.2.7.5. Financials (Based on Availability)
- 16.2.8 Allergan PLC
- 16.2.8.1. Overview
- 16.2.8.2. Products
- 16.2.8.3. SWOT Analysis
- 16.2.8.4. Recent Developments
- 16.2.8.5. Financials (Based on Availability)
- 16.2.9 Auven Therapeutics
- 16.2.9.1. Overview
- 16.2.9.2. Products
- 16.2.9.3. SWOT Analysis
- 16.2.9.4. Recent Developments
- 16.2.9.5. Financials (Based on Availability)
- 16.2.10 IBA Vision Opthalmics
- 16.2.10.1. Overview
- 16.2.10.2. Products
- 16.2.10.3. SWOT Analysis
- 16.2.10.4. Recent Developments
- 16.2.10.5. Financials (Based on Availability)
- 16.2.11 Pfizer Inc
- 16.2.11.1. Overview
- 16.2.11.2. Products
- 16.2.11.3. SWOT Analysis
- 16.2.11.4. Recent Developments
- 16.2.11.5. Financials (Based on Availability)
- 16.2.1 Sanofi SA
List of Figures
- Figure 1: Global Conjunctivitis Medication Industry Revenue Breakdown (Million, %) by Region 2024 & 2032
- Figure 2: Global Conjunctivitis Medication Industry Volume Breakdown (K Unit, %) by Region 2024 & 2032
- Figure 3: North America Conjunctivitis Medication Industry Revenue (Million), by Country 2024 & 2032
- Figure 4: North America Conjunctivitis Medication Industry Volume (K Unit), by Country 2024 & 2032
- Figure 5: North America Conjunctivitis Medication Industry Revenue Share (%), by Country 2024 & 2032
- Figure 6: North America Conjunctivitis Medication Industry Volume Share (%), by Country 2024 & 2032
- Figure 7: Europe Conjunctivitis Medication Industry Revenue (Million), by Country 2024 & 2032
- Figure 8: Europe Conjunctivitis Medication Industry Volume (K Unit), by Country 2024 & 2032
- Figure 9: Europe Conjunctivitis Medication Industry Revenue Share (%), by Country 2024 & 2032
- Figure 10: Europe Conjunctivitis Medication Industry Volume Share (%), by Country 2024 & 2032
- Figure 11: Asia Pacific Conjunctivitis Medication Industry Revenue (Million), by Country 2024 & 2032
- Figure 12: Asia Pacific Conjunctivitis Medication Industry Volume (K Unit), by Country 2024 & 2032
- Figure 13: Asia Pacific Conjunctivitis Medication Industry Revenue Share (%), by Country 2024 & 2032
- Figure 14: Asia Pacific Conjunctivitis Medication Industry Volume Share (%), by Country 2024 & 2032
- Figure 15: Middle East and Africa Conjunctivitis Medication Industry Revenue (Million), by Country 2024 & 2032
- Figure 16: Middle East and Africa Conjunctivitis Medication Industry Volume (K Unit), by Country 2024 & 2032
- Figure 17: Middle East and Africa Conjunctivitis Medication Industry Revenue Share (%), by Country 2024 & 2032
- Figure 18: Middle East and Africa Conjunctivitis Medication Industry Volume Share (%), by Country 2024 & 2032
- Figure 19: South America Conjunctivitis Medication Industry Revenue (Million), by Country 2024 & 2032
- Figure 20: South America Conjunctivitis Medication Industry Volume (K Unit), by Country 2024 & 2032
- Figure 21: South America Conjunctivitis Medication Industry Revenue Share (%), by Country 2024 & 2032
- Figure 22: South America Conjunctivitis Medication Industry Volume Share (%), by Country 2024 & 2032
- Figure 23: North America Conjunctivitis Medication Industry Revenue (Million), by Disease Type 2024 & 2032
- Figure 24: North America Conjunctivitis Medication Industry Volume (K Unit), by Disease Type 2024 & 2032
- Figure 25: North America Conjunctivitis Medication Industry Revenue Share (%), by Disease Type 2024 & 2032
- Figure 26: North America Conjunctivitis Medication Industry Volume Share (%), by Disease Type 2024 & 2032
- Figure 27: North America Conjunctivitis Medication Industry Revenue (Million), by Formulation Type 2024 & 2032
- Figure 28: North America Conjunctivitis Medication Industry Volume (K Unit), by Formulation Type 2024 & 2032
- Figure 29: North America Conjunctivitis Medication Industry Revenue Share (%), by Formulation Type 2024 & 2032
- Figure 30: North America Conjunctivitis Medication Industry Volume Share (%), by Formulation Type 2024 & 2032
- Figure 31: North America Conjunctivitis Medication Industry Revenue (Million), by Country 2024 & 2032
- Figure 32: North America Conjunctivitis Medication Industry Volume (K Unit), by Country 2024 & 2032
- Figure 33: North America Conjunctivitis Medication Industry Revenue Share (%), by Country 2024 & 2032
- Figure 34: North America Conjunctivitis Medication Industry Volume Share (%), by Country 2024 & 2032
- Figure 35: Europe Conjunctivitis Medication Industry Revenue (Million), by Disease Type 2024 & 2032
- Figure 36: Europe Conjunctivitis Medication Industry Volume (K Unit), by Disease Type 2024 & 2032
- Figure 37: Europe Conjunctivitis Medication Industry Revenue Share (%), by Disease Type 2024 & 2032
- Figure 38: Europe Conjunctivitis Medication Industry Volume Share (%), by Disease Type 2024 & 2032
- Figure 39: Europe Conjunctivitis Medication Industry Revenue (Million), by Formulation Type 2024 & 2032
- Figure 40: Europe Conjunctivitis Medication Industry Volume (K Unit), by Formulation Type 2024 & 2032
- Figure 41: Europe Conjunctivitis Medication Industry Revenue Share (%), by Formulation Type 2024 & 2032
- Figure 42: Europe Conjunctivitis Medication Industry Volume Share (%), by Formulation Type 2024 & 2032
- Figure 43: Europe Conjunctivitis Medication Industry Revenue (Million), by Country 2024 & 2032
- Figure 44: Europe Conjunctivitis Medication Industry Volume (K Unit), by Country 2024 & 2032
- Figure 45: Europe Conjunctivitis Medication Industry Revenue Share (%), by Country 2024 & 2032
- Figure 46: Europe Conjunctivitis Medication Industry Volume Share (%), by Country 2024 & 2032
- Figure 47: Asia Pacific Conjunctivitis Medication Industry Revenue (Million), by Disease Type 2024 & 2032
- Figure 48: Asia Pacific Conjunctivitis Medication Industry Volume (K Unit), by Disease Type 2024 & 2032
- Figure 49: Asia Pacific Conjunctivitis Medication Industry Revenue Share (%), by Disease Type 2024 & 2032
- Figure 50: Asia Pacific Conjunctivitis Medication Industry Volume Share (%), by Disease Type 2024 & 2032
- Figure 51: Asia Pacific Conjunctivitis Medication Industry Revenue (Million), by Formulation Type 2024 & 2032
- Figure 52: Asia Pacific Conjunctivitis Medication Industry Volume (K Unit), by Formulation Type 2024 & 2032
- Figure 53: Asia Pacific Conjunctivitis Medication Industry Revenue Share (%), by Formulation Type 2024 & 2032
- Figure 54: Asia Pacific Conjunctivitis Medication Industry Volume Share (%), by Formulation Type 2024 & 2032
- Figure 55: Asia Pacific Conjunctivitis Medication Industry Revenue (Million), by Country 2024 & 2032
- Figure 56: Asia Pacific Conjunctivitis Medication Industry Volume (K Unit), by Country 2024 & 2032
- Figure 57: Asia Pacific Conjunctivitis Medication Industry Revenue Share (%), by Country 2024 & 2032
- Figure 58: Asia Pacific Conjunctivitis Medication Industry Volume Share (%), by Country 2024 & 2032
- Figure 59: Middle East and Africa Conjunctivitis Medication Industry Revenue (Million), by Disease Type 2024 & 2032
- Figure 60: Middle East and Africa Conjunctivitis Medication Industry Volume (K Unit), by Disease Type 2024 & 2032
- Figure 61: Middle East and Africa Conjunctivitis Medication Industry Revenue Share (%), by Disease Type 2024 & 2032
- Figure 62: Middle East and Africa Conjunctivitis Medication Industry Volume Share (%), by Disease Type 2024 & 2032
- Figure 63: Middle East and Africa Conjunctivitis Medication Industry Revenue (Million), by Formulation Type 2024 & 2032
- Figure 64: Middle East and Africa Conjunctivitis Medication Industry Volume (K Unit), by Formulation Type 2024 & 2032
- Figure 65: Middle East and Africa Conjunctivitis Medication Industry Revenue Share (%), by Formulation Type 2024 & 2032
- Figure 66: Middle East and Africa Conjunctivitis Medication Industry Volume Share (%), by Formulation Type 2024 & 2032
- Figure 67: Middle East and Africa Conjunctivitis Medication Industry Revenue (Million), by Country 2024 & 2032
- Figure 68: Middle East and Africa Conjunctivitis Medication Industry Volume (K Unit), by Country 2024 & 2032
- Figure 69: Middle East and Africa Conjunctivitis Medication Industry Revenue Share (%), by Country 2024 & 2032
- Figure 70: Middle East and Africa Conjunctivitis Medication Industry Volume Share (%), by Country 2024 & 2032
- Figure 71: South America Conjunctivitis Medication Industry Revenue (Million), by Disease Type 2024 & 2032
- Figure 72: South America Conjunctivitis Medication Industry Volume (K Unit), by Disease Type 2024 & 2032
- Figure 73: South America Conjunctivitis Medication Industry Revenue Share (%), by Disease Type 2024 & 2032
- Figure 74: South America Conjunctivitis Medication Industry Volume Share (%), by Disease Type 2024 & 2032
- Figure 75: South America Conjunctivitis Medication Industry Revenue (Million), by Formulation Type 2024 & 2032
- Figure 76: South America Conjunctivitis Medication Industry Volume (K Unit), by Formulation Type 2024 & 2032
- Figure 77: South America Conjunctivitis Medication Industry Revenue Share (%), by Formulation Type 2024 & 2032
- Figure 78: South America Conjunctivitis Medication Industry Volume Share (%), by Formulation Type 2024 & 2032
- Figure 79: South America Conjunctivitis Medication Industry Revenue (Million), by Country 2024 & 2032
- Figure 80: South America Conjunctivitis Medication Industry Volume (K Unit), by Country 2024 & 2032
- Figure 81: South America Conjunctivitis Medication Industry Revenue Share (%), by Country 2024 & 2032
- Figure 82: South America Conjunctivitis Medication Industry Volume Share (%), by Country 2024 & 2032
List of Tables
- Table 1: Global Conjunctivitis Medication Industry Revenue Million Forecast, by Region 2019 & 2032
- Table 2: Global Conjunctivitis Medication Industry Volume K Unit Forecast, by Region 2019 & 2032
- Table 3: Global Conjunctivitis Medication Industry Revenue Million Forecast, by Disease Type 2019 & 2032
- Table 4: Global Conjunctivitis Medication Industry Volume K Unit Forecast, by Disease Type 2019 & 2032
- Table 5: Global Conjunctivitis Medication Industry Revenue Million Forecast, by Formulation Type 2019 & 2032
- Table 6: Global Conjunctivitis Medication Industry Volume K Unit Forecast, by Formulation Type 2019 & 2032
- Table 7: Global Conjunctivitis Medication Industry Revenue Million Forecast, by Region 2019 & 2032
- Table 8: Global Conjunctivitis Medication Industry Volume K Unit Forecast, by Region 2019 & 2032
- Table 9: Global Conjunctivitis Medication Industry Revenue Million Forecast, by Country 2019 & 2032
- Table 10: Global Conjunctivitis Medication Industry Volume K Unit Forecast, by Country 2019 & 2032
- Table 11: United States Conjunctivitis Medication Industry Revenue (Million) Forecast, by Application 2019 & 2032
- Table 12: United States Conjunctivitis Medication Industry Volume (K Unit) Forecast, by Application 2019 & 2032
- Table 13: Canada Conjunctivitis Medication Industry Revenue (Million) Forecast, by Application 2019 & 2032
- Table 14: Canada Conjunctivitis Medication Industry Volume (K Unit) Forecast, by Application 2019 & 2032
- Table 15: Mexico Conjunctivitis Medication Industry Revenue (Million) Forecast, by Application 2019 & 2032
- Table 16: Mexico Conjunctivitis Medication Industry Volume (K Unit) Forecast, by Application 2019 & 2032
- Table 17: Global Conjunctivitis Medication Industry Revenue Million Forecast, by Country 2019 & 2032
- Table 18: Global Conjunctivitis Medication Industry Volume K Unit Forecast, by Country 2019 & 2032
- Table 19: Germany Conjunctivitis Medication Industry Revenue (Million) Forecast, by Application 2019 & 2032
- Table 20: Germany Conjunctivitis Medication Industry Volume (K Unit) Forecast, by Application 2019 & 2032
- Table 21: United Kingdom Conjunctivitis Medication Industry Revenue (Million) Forecast, by Application 2019 & 2032
- Table 22: United Kingdom Conjunctivitis Medication Industry Volume (K Unit) Forecast, by Application 2019 & 2032
- Table 23: France Conjunctivitis Medication Industry Revenue (Million) Forecast, by Application 2019 & 2032
- Table 24: France Conjunctivitis Medication Industry Volume (K Unit) Forecast, by Application 2019 & 2032
- Table 25: Italy Conjunctivitis Medication Industry Revenue (Million) Forecast, by Application 2019 & 2032
- Table 26: Italy Conjunctivitis Medication Industry Volume (K Unit) Forecast, by Application 2019 & 2032
- Table 27: Spain Conjunctivitis Medication Industry Revenue (Million) Forecast, by Application 2019 & 2032
- Table 28: Spain Conjunctivitis Medication Industry Volume (K Unit) Forecast, by Application 2019 & 2032
- Table 29: Rest of Europe Conjunctivitis Medication Industry Revenue (Million) Forecast, by Application 2019 & 2032
- Table 30: Rest of Europe Conjunctivitis Medication Industry Volume (K Unit) Forecast, by Application 2019 & 2032
- Table 31: Global Conjunctivitis Medication Industry Revenue Million Forecast, by Country 2019 & 2032
- Table 32: Global Conjunctivitis Medication Industry Volume K Unit Forecast, by Country 2019 & 2032
- Table 33: China Conjunctivitis Medication Industry Revenue (Million) Forecast, by Application 2019 & 2032
- Table 34: China Conjunctivitis Medication Industry Volume (K Unit) Forecast, by Application 2019 & 2032
- Table 35: Japan Conjunctivitis Medication Industry Revenue (Million) Forecast, by Application 2019 & 2032
- Table 36: Japan Conjunctivitis Medication Industry Volume (K Unit) Forecast, by Application 2019 & 2032
- Table 37: India Conjunctivitis Medication Industry Revenue (Million) Forecast, by Application 2019 & 2032
- Table 38: India Conjunctivitis Medication Industry Volume (K Unit) Forecast, by Application 2019 & 2032
- Table 39: Australia Conjunctivitis Medication Industry Revenue (Million) Forecast, by Application 2019 & 2032
- Table 40: Australia Conjunctivitis Medication Industry Volume (K Unit) Forecast, by Application 2019 & 2032
- Table 41: South Korea Conjunctivitis Medication Industry Revenue (Million) Forecast, by Application 2019 & 2032
- Table 42: South Korea Conjunctivitis Medication Industry Volume (K Unit) Forecast, by Application 2019 & 2032
- Table 43: Rest of Asia Pacific Conjunctivitis Medication Industry Revenue (Million) Forecast, by Application 2019 & 2032
- Table 44: Rest of Asia Pacific Conjunctivitis Medication Industry Volume (K Unit) Forecast, by Application 2019 & 2032
- Table 45: Global Conjunctivitis Medication Industry Revenue Million Forecast, by Country 2019 & 2032
- Table 46: Global Conjunctivitis Medication Industry Volume K Unit Forecast, by Country 2019 & 2032
- Table 47: GCC Conjunctivitis Medication Industry Revenue (Million) Forecast, by Application 2019 & 2032
- Table 48: GCC Conjunctivitis Medication Industry Volume (K Unit) Forecast, by Application 2019 & 2032
- Table 49: South Africa Conjunctivitis Medication Industry Revenue (Million) Forecast, by Application 2019 & 2032
- Table 50: South Africa Conjunctivitis Medication Industry Volume (K Unit) Forecast, by Application 2019 & 2032
- Table 51: Rest of Middle East and Africa Conjunctivitis Medication Industry Revenue (Million) Forecast, by Application 2019 & 2032
- Table 52: Rest of Middle East and Africa Conjunctivitis Medication Industry Volume (K Unit) Forecast, by Application 2019 & 2032
- Table 53: Global Conjunctivitis Medication Industry Revenue Million Forecast, by Country 2019 & 2032
- Table 54: Global Conjunctivitis Medication Industry Volume K Unit Forecast, by Country 2019 & 2032
- Table 55: Brazil Conjunctivitis Medication Industry Revenue (Million) Forecast, by Application 2019 & 2032
- Table 56: Brazil Conjunctivitis Medication Industry Volume (K Unit) Forecast, by Application 2019 & 2032
- Table 57: Argentina Conjunctivitis Medication Industry Revenue (Million) Forecast, by Application 2019 & 2032
- Table 58: Argentina Conjunctivitis Medication Industry Volume (K Unit) Forecast, by Application 2019 & 2032
- Table 59: Rest of South America Conjunctivitis Medication Industry Revenue (Million) Forecast, by Application 2019 & 2032
- Table 60: Rest of South America Conjunctivitis Medication Industry Volume (K Unit) Forecast, by Application 2019 & 2032
- Table 61: Global Conjunctivitis Medication Industry Revenue Million Forecast, by Disease Type 2019 & 2032
- Table 62: Global Conjunctivitis Medication Industry Volume K Unit Forecast, by Disease Type 2019 & 2032
- Table 63: Global Conjunctivitis Medication Industry Revenue Million Forecast, by Formulation Type 2019 & 2032
- Table 64: Global Conjunctivitis Medication Industry Volume K Unit Forecast, by Formulation Type 2019 & 2032
- Table 65: Global Conjunctivitis Medication Industry Revenue Million Forecast, by Country 2019 & 2032
- Table 66: Global Conjunctivitis Medication Industry Volume K Unit Forecast, by Country 2019 & 2032
- Table 67: United States Conjunctivitis Medication Industry Revenue (Million) Forecast, by Application 2019 & 2032
- Table 68: United States Conjunctivitis Medication Industry Volume (K Unit) Forecast, by Application 2019 & 2032
- Table 69: Canada Conjunctivitis Medication Industry Revenue (Million) Forecast, by Application 2019 & 2032
- Table 70: Canada Conjunctivitis Medication Industry Volume (K Unit) Forecast, by Application 2019 & 2032
- Table 71: Mexico Conjunctivitis Medication Industry Revenue (Million) Forecast, by Application 2019 & 2032
- Table 72: Mexico Conjunctivitis Medication Industry Volume (K Unit) Forecast, by Application 2019 & 2032
- Table 73: Global Conjunctivitis Medication Industry Revenue Million Forecast, by Disease Type 2019 & 2032
- Table 74: Global Conjunctivitis Medication Industry Volume K Unit Forecast, by Disease Type 2019 & 2032
- Table 75: Global Conjunctivitis Medication Industry Revenue Million Forecast, by Formulation Type 2019 & 2032
- Table 76: Global Conjunctivitis Medication Industry Volume K Unit Forecast, by Formulation Type 2019 & 2032
- Table 77: Global Conjunctivitis Medication Industry Revenue Million Forecast, by Country 2019 & 2032
- Table 78: Global Conjunctivitis Medication Industry Volume K Unit Forecast, by Country 2019 & 2032
- Table 79: Germany Conjunctivitis Medication Industry Revenue (Million) Forecast, by Application 2019 & 2032
- Table 80: Germany Conjunctivitis Medication Industry Volume (K Unit) Forecast, by Application 2019 & 2032
- Table 81: United Kingdom Conjunctivitis Medication Industry Revenue (Million) Forecast, by Application 2019 & 2032
- Table 82: United Kingdom Conjunctivitis Medication Industry Volume (K Unit) Forecast, by Application 2019 & 2032
- Table 83: France Conjunctivitis Medication Industry Revenue (Million) Forecast, by Application 2019 & 2032
- Table 84: France Conjunctivitis Medication Industry Volume (K Unit) Forecast, by Application 2019 & 2032
- Table 85: Italy Conjunctivitis Medication Industry Revenue (Million) Forecast, by Application 2019 & 2032
- Table 86: Italy Conjunctivitis Medication Industry Volume (K Unit) Forecast, by Application 2019 & 2032
- Table 87: Spain Conjunctivitis Medication Industry Revenue (Million) Forecast, by Application 2019 & 2032
- Table 88: Spain Conjunctivitis Medication Industry Volume (K Unit) Forecast, by Application 2019 & 2032
- Table 89: Rest of Europe Conjunctivitis Medication Industry Revenue (Million) Forecast, by Application 2019 & 2032
- Table 90: Rest of Europe Conjunctivitis Medication Industry Volume (K Unit) Forecast, by Application 2019 & 2032
- Table 91: Global Conjunctivitis Medication Industry Revenue Million Forecast, by Disease Type 2019 & 2032
- Table 92: Global Conjunctivitis Medication Industry Volume K Unit Forecast, by Disease Type 2019 & 2032
- Table 93: Global Conjunctivitis Medication Industry Revenue Million Forecast, by Formulation Type 2019 & 2032
- Table 94: Global Conjunctivitis Medication Industry Volume K Unit Forecast, by Formulation Type 2019 & 2032
- Table 95: Global Conjunctivitis Medication Industry Revenue Million Forecast, by Country 2019 & 2032
- Table 96: Global Conjunctivitis Medication Industry Volume K Unit Forecast, by Country 2019 & 2032
- Table 97: China Conjunctivitis Medication Industry Revenue (Million) Forecast, by Application 2019 & 2032
- Table 98: China Conjunctivitis Medication Industry Volume (K Unit) Forecast, by Application 2019 & 2032
- Table 99: Japan Conjunctivitis Medication Industry Revenue (Million) Forecast, by Application 2019 & 2032
- Table 100: Japan Conjunctivitis Medication Industry Volume (K Unit) Forecast, by Application 2019 & 2032
- Table 101: India Conjunctivitis Medication Industry Revenue (Million) Forecast, by Application 2019 & 2032
- Table 102: India Conjunctivitis Medication Industry Volume (K Unit) Forecast, by Application 2019 & 2032
- Table 103: Australia Conjunctivitis Medication Industry Revenue (Million) Forecast, by Application 2019 & 2032
- Table 104: Australia Conjunctivitis Medication Industry Volume (K Unit) Forecast, by Application 2019 & 2032
- Table 105: South Korea Conjunctivitis Medication Industry Revenue (Million) Forecast, by Application 2019 & 2032
- Table 106: South Korea Conjunctivitis Medication Industry Volume (K Unit) Forecast, by Application 2019 & 2032
- Table 107: Rest of Asia Pacific Conjunctivitis Medication Industry Revenue (Million) Forecast, by Application 2019 & 2032
- Table 108: Rest of Asia Pacific Conjunctivitis Medication Industry Volume (K Unit) Forecast, by Application 2019 & 2032
- Table 109: Global Conjunctivitis Medication Industry Revenue Million Forecast, by Disease Type 2019 & 2032
- Table 110: Global Conjunctivitis Medication Industry Volume K Unit Forecast, by Disease Type 2019 & 2032
- Table 111: Global Conjunctivitis Medication Industry Revenue Million Forecast, by Formulation Type 2019 & 2032
- Table 112: Global Conjunctivitis Medication Industry Volume K Unit Forecast, by Formulation Type 2019 & 2032
- Table 113: Global Conjunctivitis Medication Industry Revenue Million Forecast, by Country 2019 & 2032
- Table 114: Global Conjunctivitis Medication Industry Volume K Unit Forecast, by Country 2019 & 2032
- Table 115: GCC Conjunctivitis Medication Industry Revenue (Million) Forecast, by Application 2019 & 2032
- Table 116: GCC Conjunctivitis Medication Industry Volume (K Unit) Forecast, by Application 2019 & 2032
- Table 117: South Africa Conjunctivitis Medication Industry Revenue (Million) Forecast, by Application 2019 & 2032
- Table 118: South Africa Conjunctivitis Medication Industry Volume (K Unit) Forecast, by Application 2019 & 2032
- Table 119: Rest of Middle East and Africa Conjunctivitis Medication Industry Revenue (Million) Forecast, by Application 2019 & 2032
- Table 120: Rest of Middle East and Africa Conjunctivitis Medication Industry Volume (K Unit) Forecast, by Application 2019 & 2032
- Table 121: Global Conjunctivitis Medication Industry Revenue Million Forecast, by Disease Type 2019 & 2032
- Table 122: Global Conjunctivitis Medication Industry Volume K Unit Forecast, by Disease Type 2019 & 2032
- Table 123: Global Conjunctivitis Medication Industry Revenue Million Forecast, by Formulation Type 2019 & 2032
- Table 124: Global Conjunctivitis Medication Industry Volume K Unit Forecast, by Formulation Type 2019 & 2032
- Table 125: Global Conjunctivitis Medication Industry Revenue Million Forecast, by Country 2019 & 2032
- Table 126: Global Conjunctivitis Medication Industry Volume K Unit Forecast, by Country 2019 & 2032
- Table 127: Brazil Conjunctivitis Medication Industry Revenue (Million) Forecast, by Application 2019 & 2032
- Table 128: Brazil Conjunctivitis Medication Industry Volume (K Unit) Forecast, by Application 2019 & 2032
- Table 129: Argentina Conjunctivitis Medication Industry Revenue (Million) Forecast, by Application 2019 & 2032
- Table 130: Argentina Conjunctivitis Medication Industry Volume (K Unit) Forecast, by Application 2019 & 2032
- Table 131: Rest of South America Conjunctivitis Medication Industry Revenue (Million) Forecast, by Application 2019 & 2032
- Table 132: Rest of South America Conjunctivitis Medication Industry Volume (K Unit) Forecast, by Application 2019 & 2032
Frequently Asked Questions
1. What is the projected Compound Annual Growth Rate (CAGR) of the Conjunctivitis Medication Industry?
The projected CAGR is approximately 4.10%.
2. Which companies are prominent players in the Conjunctivitis Medication Industry?
Key companies in the market include Sanofi SA, Novartis AG, NicOx SA, Sirion Therapeutics Inc, Alembic Pharmaceuticals, Santen Pharmaceuticals Co Ltd, Bausch & Lomb Incorporated, Allergan PLC, Auven Therapeutics , IBA Vision Opthalmics, Pfizer Inc.
3. What are the main segments of the Conjunctivitis Medication Industry?
The market segments include Disease Type, Formulation Type.
4. Can you provide details about the market size?
The market size is estimated to be USD XX Million as of 2022.
5. What are some drivers contributing to market growth?
Increasing Number of People Suffering From Conjunctivitis; Easy Availability of the Treatment.
6. What are the notable trends driving market growth?
Allergic Conjunctivitis is Expected to Witness a Steady Growth in the Conjunctivitis Treatment Over the Forecast Period.
7. Are there any restraints impacting market growth?
Availability of Alternative Treatments. such as Home Remedies.
8. Can you provide examples of recent developments in the market?
In May 2022 Santen Pharmaceutical received approval for Verkazia from the National Medical Products Administration (NMPA) in China through its legal entity for treating severe vernal keratoconjunctivitis (VKC) in children and adolescents aged four years and above.
9. What pricing options are available for accessing the report?
Pricing options include single-user, multi-user, and enterprise licenses priced at USD 4750, USD 5250, and USD 8750 respectively.
10. Is the market size provided in terms of value or volume?
The market size is provided in terms of value, measured in Million and volume, measured in K Unit.
11. Are there any specific market keywords associated with the report?
Yes, the market keyword associated with the report is "Conjunctivitis Medication Industry," which aids in identifying and referencing the specific market segment covered.
12. How do I determine which pricing option suits my needs best?
The pricing options vary based on user requirements and access needs. Individual users may opt for single-user licenses, while businesses requiring broader access may choose multi-user or enterprise licenses for cost-effective access to the report.
13. Are there any additional resources or data provided in the Conjunctivitis Medication Industry report?
While the report offers comprehensive insights, it's advisable to review the specific contents or supplementary materials provided to ascertain if additional resources or data are available.
14. How can I stay updated on further developments or reports in the Conjunctivitis Medication Industry?
To stay informed about further developments, trends, and reports in the Conjunctivitis Medication Industry, consider subscribing to industry newsletters, following relevant companies and organizations, or regularly checking reputable industry news sources and publications.
Methodology
Step 1 - Identification of Relevant Samples Size from Population Database


Step 2 - Approaches for Defining Global Market Size (Value, Volume* & Price*)

Note*: In applicable scenarios
Step 3 - Data Sources
Primary Research
- Web Analytics
- Survey Reports
- Research Institute
- Latest Research Reports
- Opinion Leaders
Secondary Research
- Annual Reports
- White Paper
- Latest Press Release
- Industry Association
- Paid Database
- Investor Presentations

Step 4 - Data Triangulation
Involves using different sources of information in order to increase the validity of a study
These sources are likely to be stakeholders in a program - participants, other researchers, program staff, other community members, and so on.
Then we put all data in single framework & apply various statistical tools to find out the dynamic on the market.
During the analysis stage, feedback from the stakeholder groups would be compared to determine areas of agreement as well as areas of divergence


