
Key Insights
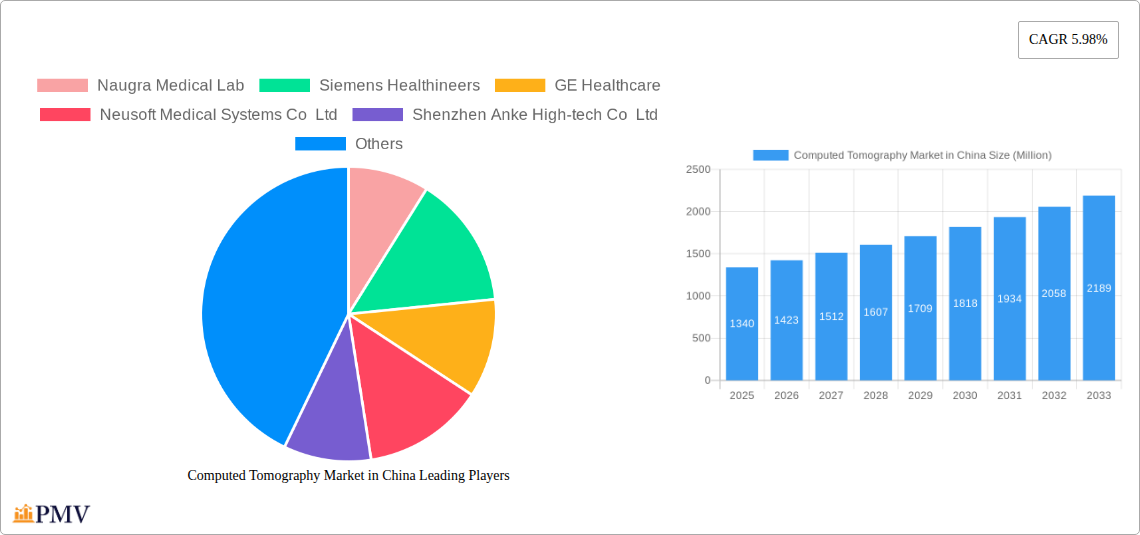
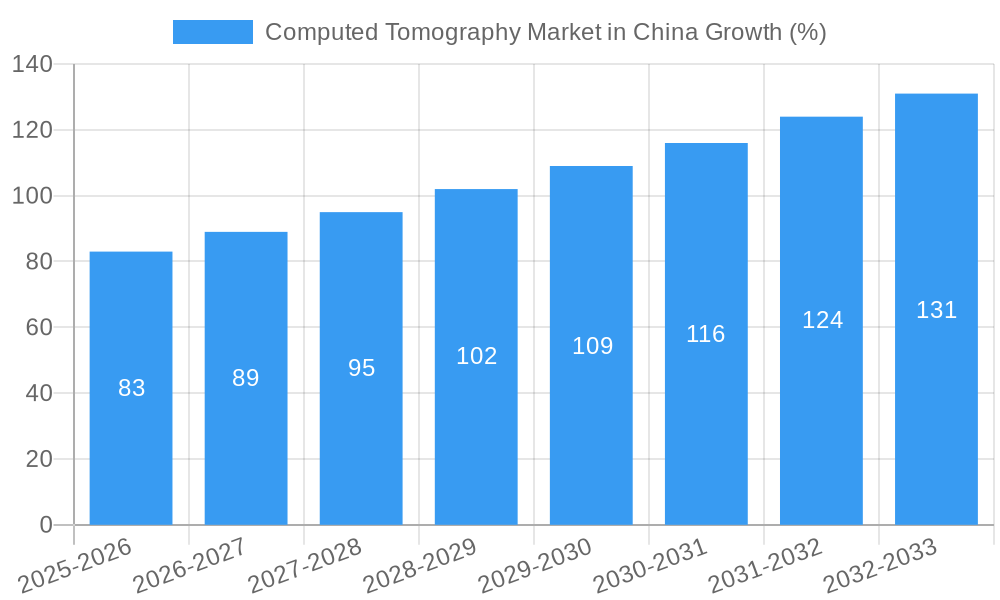
The Chinese Computed Tomography (CT) market, valued at $1.34 billion in 2025, is poised for robust growth, exhibiting a Compound Annual Growth Rate (CAGR) of 5.98% from 2025 to 2033. This expansion is driven by several factors. Increasing prevalence of chronic diseases like cardiovascular ailments, cancer, and neurological disorders necessitates advanced diagnostic tools, fueling demand for CT scans. Technological advancements, such as multi-slice CT scanners offering faster scan times and improved image quality, are further enhancing market appeal. Government initiatives promoting healthcare infrastructure development and increasing healthcare expenditure contribute significantly to market growth. The market is segmented by end-user (hospitals, diagnostic centers, others), type (low, medium, and high slice CT scanners), and application (oncology, neurology, cardiovascular, musculoskeletal, and others). Hospitals currently dominate the end-user segment, reflecting their crucial role in providing comprehensive diagnostic services. High-slice CT scanners, offering superior image resolution and speed, are witnessing higher growth compared to their lower-slice counterparts. Oncology and cardiology applications are significant drivers, given the rising incidence of related diseases in China. However, high equipment costs and the need for skilled professionals remain potential restraints, although ongoing technological advancements and training programs are mitigating these challenges. Key players like Siemens Healthineers, GE Healthcare, and Canon Medical Systems are actively shaping the market landscape through innovation and strategic partnerships.
The continued expansion of the Chinese CT market is expected to be fueled by a burgeoning middle class with increased disposable income, leading to greater accessibility to advanced healthcare. Furthermore, the expanding medical tourism sector in China may also contribute to market growth by attracting patients from neighboring countries. While the market faces challenges, including regulatory hurdles and the need for consistent technological upgrades, the underlying growth drivers are expected to outweigh these limitations, making the Chinese CT market an attractive prospect for both domestic and international players. Future market performance will heavily depend on the success of government healthcare policies, technological innovation within the sector, and evolving patient demands for faster, more accurate, and less invasive diagnostic procedures.
Computed Tomography Market in China: A Comprehensive Market Analysis (2019-2033)
This in-depth report provides a comprehensive analysis of the Computed Tomography (CT) market in China, covering market size, segmentation, competitive landscape, and future growth prospects. The study period spans from 2019 to 2033, with 2025 serving as the base and estimated year. The report offers actionable insights for stakeholders across the value chain, including manufacturers, distributors, and healthcare providers.
Computed Tomography Market in China Market Structure & Competitive Dynamics
This section analyzes the competitive intensity, innovation landscape, regulatory environment, and market dynamics within the Chinese CT market. The market is moderately concentrated, with key players like Siemens Healthineers, GE Healthcare, and Fujifilm Holdings Corporation holding significant market share. However, domestic players such as Neusoft Medical Systems Co Ltd and Shenzhen Anke High-tech Co Ltd are increasingly challenging established players.
Market share distribution is estimated as follows (2025): Siemens Healthineers (25%), GE Healthcare (20%), Fujifilm Holdings Corporation (15%), Neusoft Medical Systems Co Ltd (10%), other players (30%). The total market value in 2025 is estimated at xx Million. Innovation within the sector is driven by advancements in detector technology (e.g., high-slice CT scanners), AI-powered image analysis, and the integration of 5G for remote diagnostics. Regulatory frameworks, while supportive of technological advancement, also emphasize safety and efficacy. The market faces challenges from potential substitutes (e.g., MRI) and pricing pressures. M&A activities have been moderate, with deal values in the range of xx Million in recent years. Recent trends suggest increased focus on strategic partnerships, particularly for expanding market access and enhancing technological capabilities.
Computed Tomography Market in China Industry Trends & Insights
The Chinese CT market exhibits robust growth, driven by several factors. Rising prevalence of chronic diseases like cancer and cardiovascular conditions fuels demand for advanced diagnostic imaging solutions. Government initiatives to improve healthcare infrastructure and access, particularly in underserved regions, further stimulate market expansion. The rising adoption of minimally invasive surgical procedures, which often rely on CT imaging for guidance, supports the increasing demand. Technological advancements such as AI-integrated CT scanners with improved image quality and speed, coupled with the increasing affordability of CT scans are boosting adoption rates across various segments. The Compound Annual Growth Rate (CAGR) for the period 2025-2033 is projected to be xx%, with market penetration increasing from xx% in 2025 to xx% by 2033. The competitive landscape is characterized by both intense competition and strategic collaborations. This reflects a dynamic market with significant opportunities for growth and innovation.
Dominant Markets & Segments in Computed Tomography Market in China
The Hospitals segment dominates the end-user landscape, accounting for the largest market share due to higher patient volumes and advanced medical capabilities. Within the product type segment, High-Slice CT scanners hold a significant share due to their superior image quality and faster scan times, despite higher costs. On the application side, Oncology applications lead the market owing to the rising prevalence of cancer and increasing demand for precise cancer diagnosis and treatment planning.
- Key Drivers for Hospital Segment Dominance:
- High patient volume and sophisticated diagnostic capabilities.
- Higher investment capacity for advanced imaging equipment.
- Presence of specialized radiologists and experienced personnel.
- Key Drivers for High-Slice CT Scanner Dominance:
- Superior image quality and faster scan times.
- Improved diagnostic accuracy and reduced radiation dose.
- Enhanced workflow efficiency.
- Key Drivers for Oncology Application Dominance:
- Rising cancer incidence rates.
- Need for precise cancer detection and treatment planning.
- Growing adoption of targeted therapies and radiation oncology.
The geographical distribution showcases strong growth across major urban centers and rapidly developing regions. Government investments in healthcare infrastructure, along with favorable economic conditions, play a crucial role in driving market expansion.
Computed Tomography Market in China Product Innovations
Recent innovations focus on enhanced image quality through advanced detector technology and AI-powered image processing. Miniaturization and portability of CT scanners are also key trends, particularly for applications in remote areas or mobile imaging services. The integration of 5G technology facilitates remote diagnostics and telemedicine, streamlining the workflow and improving patient access to high-quality CT imaging. These innovations are improving diagnostic accuracy, speed, and efficiency. The market is also witnessing an increased emphasis on cost-effective solutions, catering to the growing demand in the mid-tier and lower-tier cities of China.
Report Segmentation & Scope
This report segments the Chinese CT market based on End-User (Hospitals, Diagnostic Centers, Other End-Users), Type (Low Slice, Medium Slice, High Slice), and Application (Oncology, Neurology, Cardiovascular, Musculoskeletal, Other Applications). Each segment is analyzed based on market size, growth projections, and competitive dynamics. Growth rates vary across these segments with high-slice CT and oncology applications projected for above-average growth. Hospitals, as mentioned above, dominate the end-user market. The competitive dynamics differ across segments; larger players dominate the high-slice market, while domestic companies are increasingly active in lower-slice segments.
Key Drivers of Computed Tomography Market in China Growth
The Chinese CT market is driven by the rising prevalence of chronic diseases, government initiatives to improve healthcare infrastructure, increasing disposable income and affordability, and technological advancements in CT scanner technology, including AI integration and 5G connectivity. Government policies promoting advanced medical technologies and improved healthcare access in rural areas also contribute significantly to market growth.
Challenges in the Computed Tomography Market in China Sector
Challenges include stringent regulatory approvals, potential supply chain disruptions, competition from other imaging modalities (like MRI), and the need for skilled radiologists. Price sensitivity among consumers, especially in lower-tier cities, and the high cost of advanced CT scanners remain hurdles to market penetration.
Leading Players in the Computed Tomography Market in China Market
- Naugra Medical Lab
- Siemens Healthineers
- GE Healthcare
- Neusoft Medical Systems Co Ltd
- Shenzhen Anke High-tech Co Ltd
- Koninklijke Philips NV
- Canon Medical Systems Corporation
- MinFound Medical Systems Co Ltd
- Planmed Oy
- Fujifilm Holdings Corporation
Key Developments in Computed Tomography Market in China Sector
- February 2022: Siemens Healthineers and Universal Medical Imaging partnered to promote 5G remote imaging diagnosis for primary care in China. This development expands access to CT services in remote areas.
- March 2023: Elekta's collaboration with Sinopharm aims to increase radiation therapy access in lower-tier cities, boosting demand for CT scans used for treatment planning and monitoring in a significant portion of the population.
Strategic Computed Tomography Market in China Market Outlook
The Chinese CT market presents significant growth opportunities driven by increasing healthcare spending, technological innovations, and government initiatives to improve healthcare infrastructure. Strategic partnerships, focusing on technology integration and market penetration, are crucial for success. Opportunities exist in expanding access to CT services in underserved areas and developing cost-effective solutions to cater to a broader range of patients. The focus on AI-driven image analysis and remote diagnostics will shape the future trajectory of the market.
Computed Tomography Market in China Segmentation
-
1. Type
- 1.1. Low Slice
- 1.2. Medium Slice
- 1.3. High Slice
-
2. Application
- 2.1. Oncology
- 2.2. Neurology
- 2.3. Cardiovascular
- 2.4. Musculoskeletal
- 2.5. Other Applications
-
3. End User
- 3.1. Hospitals
- 3.2. Diagnostic Centers
- 3.3. Other End Users
Computed Tomography Market in China Segmentation By Geography
-
1. North America
- 1.1. United States
- 1.2. Canada
- 1.3. Mexico
-
2. South America
- 2.1. Brazil
- 2.2. Argentina
- 2.3. Rest of South America
-
3. Europe
- 3.1. United Kingdom
- 3.2. Germany
- 3.3. France
- 3.4. Italy
- 3.5. Spain
- 3.6. Russia
- 3.7. Benelux
- 3.8. Nordics
- 3.9. Rest of Europe
-
4. Middle East & Africa
- 4.1. Turkey
- 4.2. Israel
- 4.3. GCC
- 4.4. North Africa
- 4.5. South Africa
- 4.6. Rest of Middle East & Africa
-
5. Asia Pacific
- 5.1. China
- 5.2. India
- 5.3. Japan
- 5.4. South Korea
- 5.5. ASEAN
- 5.6. Oceania
- 5.7. Rest of Asia Pacific
Computed Tomography Market in China REPORT HIGHLIGHTS
| Aspects | Details |
|---|---|
| Study Period | 2019-2033 |
| Base Year | 2024 |
| Estimated Year | 2025 |
| Forecast Period | 2025-2033 |
| Historical Period | 2019-2024 |
| Growth Rate | CAGR of 5.98% from 2019-2033 |
| Segmentation |
|
Table of Contents
- 1. Introduction
- 1.1. Research Scope
- 1.2. Market Segmentation
- 1.3. Research Methodology
- 1.4. Definitions and Assumptions
- 2. Executive Summary
- 2.1. Introduction
- 3. Market Dynamics
- 3.1. Introduction
- 3.2. Market Drivers
- 3.2.1. Increasing Geriatric Population and Chronic Disease Burden; Technological Advancements in Computed Tomography
- 3.3. Market Restrains
- 3.3.1. High Cost Associated With CT Scan Procedure and Equipment
- 3.4. Market Trends
- 3.4.1. Diagnostic Centers to Hold Significant Share in End-User Segment Over the Forecast Period
- 4. Market Factor Analysis
- 4.1. Porters Five Forces
- 4.2. Supply/Value Chain
- 4.3. PESTEL analysis
- 4.4. Market Entropy
- 4.5. Patent/Trademark Analysis
- 5. Global Computed Tomography Market in China Analysis, Insights and Forecast, 2019-2031
- 5.1. Market Analysis, Insights and Forecast - by Type
- 5.1.1. Low Slice
- 5.1.2. Medium Slice
- 5.1.3. High Slice
- 5.2. Market Analysis, Insights and Forecast - by Application
- 5.2.1. Oncology
- 5.2.2. Neurology
- 5.2.3. Cardiovascular
- 5.2.4. Musculoskeletal
- 5.2.5. Other Applications
- 5.3. Market Analysis, Insights and Forecast - by End User
- 5.3.1. Hospitals
- 5.3.2. Diagnostic Centers
- 5.3.3. Other End Users
- 5.4. Market Analysis, Insights and Forecast - by Region
- 5.4.1. North America
- 5.4.2. South America
- 5.4.3. Europe
- 5.4.4. Middle East & Africa
- 5.4.5. Asia Pacific
- 5.1. Market Analysis, Insights and Forecast - by Type
- 6. North America Computed Tomography Market in China Analysis, Insights and Forecast, 2019-2031
- 6.1. Market Analysis, Insights and Forecast - by Type
- 6.1.1. Low Slice
- 6.1.2. Medium Slice
- 6.1.3. High Slice
- 6.2. Market Analysis, Insights and Forecast - by Application
- 6.2.1. Oncology
- 6.2.2. Neurology
- 6.2.3. Cardiovascular
- 6.2.4. Musculoskeletal
- 6.2.5. Other Applications
- 6.3. Market Analysis, Insights and Forecast - by End User
- 6.3.1. Hospitals
- 6.3.2. Diagnostic Centers
- 6.3.3. Other End Users
- 6.1. Market Analysis, Insights and Forecast - by Type
- 7. South America Computed Tomography Market in China Analysis, Insights and Forecast, 2019-2031
- 7.1. Market Analysis, Insights and Forecast - by Type
- 7.1.1. Low Slice
- 7.1.2. Medium Slice
- 7.1.3. High Slice
- 7.2. Market Analysis, Insights and Forecast - by Application
- 7.2.1. Oncology
- 7.2.2. Neurology
- 7.2.3. Cardiovascular
- 7.2.4. Musculoskeletal
- 7.2.5. Other Applications
- 7.3. Market Analysis, Insights and Forecast - by End User
- 7.3.1. Hospitals
- 7.3.2. Diagnostic Centers
- 7.3.3. Other End Users
- 7.1. Market Analysis, Insights and Forecast - by Type
- 8. Europe Computed Tomography Market in China Analysis, Insights and Forecast, 2019-2031
- 8.1. Market Analysis, Insights and Forecast - by Type
- 8.1.1. Low Slice
- 8.1.2. Medium Slice
- 8.1.3. High Slice
- 8.2. Market Analysis, Insights and Forecast - by Application
- 8.2.1. Oncology
- 8.2.2. Neurology
- 8.2.3. Cardiovascular
- 8.2.4. Musculoskeletal
- 8.2.5. Other Applications
- 8.3. Market Analysis, Insights and Forecast - by End User
- 8.3.1. Hospitals
- 8.3.2. Diagnostic Centers
- 8.3.3. Other End Users
- 8.1. Market Analysis, Insights and Forecast - by Type
- 9. Middle East & Africa Computed Tomography Market in China Analysis, Insights and Forecast, 2019-2031
- 9.1. Market Analysis, Insights and Forecast - by Type
- 9.1.1. Low Slice
- 9.1.2. Medium Slice
- 9.1.3. High Slice
- 9.2. Market Analysis, Insights and Forecast - by Application
- 9.2.1. Oncology
- 9.2.2. Neurology
- 9.2.3. Cardiovascular
- 9.2.4. Musculoskeletal
- 9.2.5. Other Applications
- 9.3. Market Analysis, Insights and Forecast - by End User
- 9.3.1. Hospitals
- 9.3.2. Diagnostic Centers
- 9.3.3. Other End Users
- 9.1. Market Analysis, Insights and Forecast - by Type
- 10. Asia Pacific Computed Tomography Market in China Analysis, Insights and Forecast, 2019-2031
- 10.1. Market Analysis, Insights and Forecast - by Type
- 10.1.1. Low Slice
- 10.1.2. Medium Slice
- 10.1.3. High Slice
- 10.2. Market Analysis, Insights and Forecast - by Application
- 10.2.1. Oncology
- 10.2.2. Neurology
- 10.2.3. Cardiovascular
- 10.2.4. Musculoskeletal
- 10.2.5. Other Applications
- 10.3. Market Analysis, Insights and Forecast - by End User
- 10.3.1. Hospitals
- 10.3.2. Diagnostic Centers
- 10.3.3. Other End Users
- 10.1. Market Analysis, Insights and Forecast - by Type
- 11. Competitive Analysis
- 11.1. Global Market Share Analysis 2024
- 11.2. Company Profiles
- 11.2.1 Naugra Medical Lab
- 11.2.1.1. Overview
- 11.2.1.2. Products
- 11.2.1.3. SWOT Analysis
- 11.2.1.4. Recent Developments
- 11.2.1.5. Financials (Based on Availability)
- 11.2.2 Siemens Healthineers
- 11.2.2.1. Overview
- 11.2.2.2. Products
- 11.2.2.3. SWOT Analysis
- 11.2.2.4. Recent Developments
- 11.2.2.5. Financials (Based on Availability)
- 11.2.3 GE Healthcare
- 11.2.3.1. Overview
- 11.2.3.2. Products
- 11.2.3.3. SWOT Analysis
- 11.2.3.4. Recent Developments
- 11.2.3.5. Financials (Based on Availability)
- 11.2.4 Neusoft Medical Systems Co Ltd
- 11.2.4.1. Overview
- 11.2.4.2. Products
- 11.2.4.3. SWOT Analysis
- 11.2.4.4. Recent Developments
- 11.2.4.5. Financials (Based on Availability)
- 11.2.5 Shenzhen Anke High-tech Co Ltd
- 11.2.5.1. Overview
- 11.2.5.2. Products
- 11.2.5.3. SWOT Analysis
- 11.2.5.4. Recent Developments
- 11.2.5.5. Financials (Based on Availability)
- 11.2.6 Koninklijke Philips NV
- 11.2.6.1. Overview
- 11.2.6.2. Products
- 11.2.6.3. SWOT Analysis
- 11.2.6.4. Recent Developments
- 11.2.6.5. Financials (Based on Availability)
- 11.2.7 Canon Medical Systems Corporation
- 11.2.7.1. Overview
- 11.2.7.2. Products
- 11.2.7.3. SWOT Analysis
- 11.2.7.4. Recent Developments
- 11.2.7.5. Financials (Based on Availability)
- 11.2.8 MinFound Medical Systems Co Ltd
- 11.2.8.1. Overview
- 11.2.8.2. Products
- 11.2.8.3. SWOT Analysis
- 11.2.8.4. Recent Developments
- 11.2.8.5. Financials (Based on Availability)
- 11.2.9 Planmed Oy
- 11.2.9.1. Overview
- 11.2.9.2. Products
- 11.2.9.3. SWOT Analysis
- 11.2.9.4. Recent Developments
- 11.2.9.5. Financials (Based on Availability)
- 11.2.10 Fujifilm Holdings Corporation
- 11.2.10.1. Overview
- 11.2.10.2. Products
- 11.2.10.3. SWOT Analysis
- 11.2.10.4. Recent Developments
- 11.2.10.5. Financials (Based on Availability)
- 11.2.1 Naugra Medical Lab
List of Figures
- Figure 1: Global Computed Tomography Market in China Revenue Breakdown (Million, %) by Region 2024 & 2032
- Figure 2: China Computed Tomography Market in China Revenue (Million), by Country 2024 & 2032
- Figure 3: China Computed Tomography Market in China Revenue Share (%), by Country 2024 & 2032
- Figure 4: North America Computed Tomography Market in China Revenue (Million), by Type 2024 & 2032
- Figure 5: North America Computed Tomography Market in China Revenue Share (%), by Type 2024 & 2032
- Figure 6: North America Computed Tomography Market in China Revenue (Million), by Application 2024 & 2032
- Figure 7: North America Computed Tomography Market in China Revenue Share (%), by Application 2024 & 2032
- Figure 8: North America Computed Tomography Market in China Revenue (Million), by End User 2024 & 2032
- Figure 9: North America Computed Tomography Market in China Revenue Share (%), by End User 2024 & 2032
- Figure 10: North America Computed Tomography Market in China Revenue (Million), by Country 2024 & 2032
- Figure 11: North America Computed Tomography Market in China Revenue Share (%), by Country 2024 & 2032
- Figure 12: South America Computed Tomography Market in China Revenue (Million), by Type 2024 & 2032
- Figure 13: South America Computed Tomography Market in China Revenue Share (%), by Type 2024 & 2032
- Figure 14: South America Computed Tomography Market in China Revenue (Million), by Application 2024 & 2032
- Figure 15: South America Computed Tomography Market in China Revenue Share (%), by Application 2024 & 2032
- Figure 16: South America Computed Tomography Market in China Revenue (Million), by End User 2024 & 2032
- Figure 17: South America Computed Tomography Market in China Revenue Share (%), by End User 2024 & 2032
- Figure 18: South America Computed Tomography Market in China Revenue (Million), by Country 2024 & 2032
- Figure 19: South America Computed Tomography Market in China Revenue Share (%), by Country 2024 & 2032
- Figure 20: Europe Computed Tomography Market in China Revenue (Million), by Type 2024 & 2032
- Figure 21: Europe Computed Tomography Market in China Revenue Share (%), by Type 2024 & 2032
- Figure 22: Europe Computed Tomography Market in China Revenue (Million), by Application 2024 & 2032
- Figure 23: Europe Computed Tomography Market in China Revenue Share (%), by Application 2024 & 2032
- Figure 24: Europe Computed Tomography Market in China Revenue (Million), by End User 2024 & 2032
- Figure 25: Europe Computed Tomography Market in China Revenue Share (%), by End User 2024 & 2032
- Figure 26: Europe Computed Tomography Market in China Revenue (Million), by Country 2024 & 2032
- Figure 27: Europe Computed Tomography Market in China Revenue Share (%), by Country 2024 & 2032
- Figure 28: Middle East & Africa Computed Tomography Market in China Revenue (Million), by Type 2024 & 2032
- Figure 29: Middle East & Africa Computed Tomography Market in China Revenue Share (%), by Type 2024 & 2032
- Figure 30: Middle East & Africa Computed Tomography Market in China Revenue (Million), by Application 2024 & 2032
- Figure 31: Middle East & Africa Computed Tomography Market in China Revenue Share (%), by Application 2024 & 2032
- Figure 32: Middle East & Africa Computed Tomography Market in China Revenue (Million), by End User 2024 & 2032
- Figure 33: Middle East & Africa Computed Tomography Market in China Revenue Share (%), by End User 2024 & 2032
- Figure 34: Middle East & Africa Computed Tomography Market in China Revenue (Million), by Country 2024 & 2032
- Figure 35: Middle East & Africa Computed Tomography Market in China Revenue Share (%), by Country 2024 & 2032
- Figure 36: Asia Pacific Computed Tomography Market in China Revenue (Million), by Type 2024 & 2032
- Figure 37: Asia Pacific Computed Tomography Market in China Revenue Share (%), by Type 2024 & 2032
- Figure 38: Asia Pacific Computed Tomography Market in China Revenue (Million), by Application 2024 & 2032
- Figure 39: Asia Pacific Computed Tomography Market in China Revenue Share (%), by Application 2024 & 2032
- Figure 40: Asia Pacific Computed Tomography Market in China Revenue (Million), by End User 2024 & 2032
- Figure 41: Asia Pacific Computed Tomography Market in China Revenue Share (%), by End User 2024 & 2032
- Figure 42: Asia Pacific Computed Tomography Market in China Revenue (Million), by Country 2024 & 2032
- Figure 43: Asia Pacific Computed Tomography Market in China Revenue Share (%), by Country 2024 & 2032
List of Tables
- Table 1: Global Computed Tomography Market in China Revenue Million Forecast, by Region 2019 & 2032
- Table 2: Global Computed Tomography Market in China Revenue Million Forecast, by Type 2019 & 2032
- Table 3: Global Computed Tomography Market in China Revenue Million Forecast, by Application 2019 & 2032
- Table 4: Global Computed Tomography Market in China Revenue Million Forecast, by End User 2019 & 2032
- Table 5: Global Computed Tomography Market in China Revenue Million Forecast, by Region 2019 & 2032
- Table 6: Global Computed Tomography Market in China Revenue Million Forecast, by Country 2019 & 2032
- Table 7: Global Computed Tomography Market in China Revenue Million Forecast, by Type 2019 & 2032
- Table 8: Global Computed Tomography Market in China Revenue Million Forecast, by Application 2019 & 2032
- Table 9: Global Computed Tomography Market in China Revenue Million Forecast, by End User 2019 & 2032
- Table 10: Global Computed Tomography Market in China Revenue Million Forecast, by Country 2019 & 2032
- Table 11: United States Computed Tomography Market in China Revenue (Million) Forecast, by Application 2019 & 2032
- Table 12: Canada Computed Tomography Market in China Revenue (Million) Forecast, by Application 2019 & 2032
- Table 13: Mexico Computed Tomography Market in China Revenue (Million) Forecast, by Application 2019 & 2032
- Table 14: Global Computed Tomography Market in China Revenue Million Forecast, by Type 2019 & 2032
- Table 15: Global Computed Tomography Market in China Revenue Million Forecast, by Application 2019 & 2032
- Table 16: Global Computed Tomography Market in China Revenue Million Forecast, by End User 2019 & 2032
- Table 17: Global Computed Tomography Market in China Revenue Million Forecast, by Country 2019 & 2032
- Table 18: Brazil Computed Tomography Market in China Revenue (Million) Forecast, by Application 2019 & 2032
- Table 19: Argentina Computed Tomography Market in China Revenue (Million) Forecast, by Application 2019 & 2032
- Table 20: Rest of South America Computed Tomography Market in China Revenue (Million) Forecast, by Application 2019 & 2032
- Table 21: Global Computed Tomography Market in China Revenue Million Forecast, by Type 2019 & 2032
- Table 22: Global Computed Tomography Market in China Revenue Million Forecast, by Application 2019 & 2032
- Table 23: Global Computed Tomography Market in China Revenue Million Forecast, by End User 2019 & 2032
- Table 24: Global Computed Tomography Market in China Revenue Million Forecast, by Country 2019 & 2032
- Table 25: United Kingdom Computed Tomography Market in China Revenue (Million) Forecast, by Application 2019 & 2032
- Table 26: Germany Computed Tomography Market in China Revenue (Million) Forecast, by Application 2019 & 2032
- Table 27: France Computed Tomography Market in China Revenue (Million) Forecast, by Application 2019 & 2032
- Table 28: Italy Computed Tomography Market in China Revenue (Million) Forecast, by Application 2019 & 2032
- Table 29: Spain Computed Tomography Market in China Revenue (Million) Forecast, by Application 2019 & 2032
- Table 30: Russia Computed Tomography Market in China Revenue (Million) Forecast, by Application 2019 & 2032
- Table 31: Benelux Computed Tomography Market in China Revenue (Million) Forecast, by Application 2019 & 2032
- Table 32: Nordics Computed Tomography Market in China Revenue (Million) Forecast, by Application 2019 & 2032
- Table 33: Rest of Europe Computed Tomography Market in China Revenue (Million) Forecast, by Application 2019 & 2032
- Table 34: Global Computed Tomography Market in China Revenue Million Forecast, by Type 2019 & 2032
- Table 35: Global Computed Tomography Market in China Revenue Million Forecast, by Application 2019 & 2032
- Table 36: Global Computed Tomography Market in China Revenue Million Forecast, by End User 2019 & 2032
- Table 37: Global Computed Tomography Market in China Revenue Million Forecast, by Country 2019 & 2032
- Table 38: Turkey Computed Tomography Market in China Revenue (Million) Forecast, by Application 2019 & 2032
- Table 39: Israel Computed Tomography Market in China Revenue (Million) Forecast, by Application 2019 & 2032
- Table 40: GCC Computed Tomography Market in China Revenue (Million) Forecast, by Application 2019 & 2032
- Table 41: North Africa Computed Tomography Market in China Revenue (Million) Forecast, by Application 2019 & 2032
- Table 42: South Africa Computed Tomography Market in China Revenue (Million) Forecast, by Application 2019 & 2032
- Table 43: Rest of Middle East & Africa Computed Tomography Market in China Revenue (Million) Forecast, by Application 2019 & 2032
- Table 44: Global Computed Tomography Market in China Revenue Million Forecast, by Type 2019 & 2032
- Table 45: Global Computed Tomography Market in China Revenue Million Forecast, by Application 2019 & 2032
- Table 46: Global Computed Tomography Market in China Revenue Million Forecast, by End User 2019 & 2032
- Table 47: Global Computed Tomography Market in China Revenue Million Forecast, by Country 2019 & 2032
- Table 48: China Computed Tomography Market in China Revenue (Million) Forecast, by Application 2019 & 2032
- Table 49: India Computed Tomography Market in China Revenue (Million) Forecast, by Application 2019 & 2032
- Table 50: Japan Computed Tomography Market in China Revenue (Million) Forecast, by Application 2019 & 2032
- Table 51: South Korea Computed Tomography Market in China Revenue (Million) Forecast, by Application 2019 & 2032
- Table 52: ASEAN Computed Tomography Market in China Revenue (Million) Forecast, by Application 2019 & 2032
- Table 53: Oceania Computed Tomography Market in China Revenue (Million) Forecast, by Application 2019 & 2032
- Table 54: Rest of Asia Pacific Computed Tomography Market in China Revenue (Million) Forecast, by Application 2019 & 2032
Frequently Asked Questions
1. What is the projected Compound Annual Growth Rate (CAGR) of the Computed Tomography Market in China?
The projected CAGR is approximately 5.98%.
2. Which companies are prominent players in the Computed Tomography Market in China?
Key companies in the market include Naugra Medical Lab, Siemens Healthineers, GE Healthcare, Neusoft Medical Systems Co Ltd, Shenzhen Anke High-tech Co Ltd, Koninklijke Philips NV, Canon Medical Systems Corporation, MinFound Medical Systems Co Ltd, Planmed Oy, Fujifilm Holdings Corporation.
3. What are the main segments of the Computed Tomography Market in China?
The market segments include Type, Application, End User.
4. Can you provide details about the market size?
The market size is estimated to be USD 1.34 Million as of 2022.
5. What are some drivers contributing to market growth?
Increasing Geriatric Population and Chronic Disease Burden; Technological Advancements in Computed Tomography.
6. What are the notable trends driving market growth?
Diagnostic Centers to Hold Significant Share in End-User Segment Over the Forecast Period.
7. Are there any restraints impacting market growth?
High Cost Associated With CT Scan Procedure and Equipment.
8. Can you provide examples of recent developments in the market?
March 2023: Elekta launched a cooperative venture with China National Pharmaceutical Group Co., Ltd. (Sinopharm) to expand the use of radiation therapy in so-called lower-tier cities, where around 70% of the population lives.
9. What pricing options are available for accessing the report?
Pricing options include single-user, multi-user, and enterprise licenses priced at USD 3800, USD 4500, and USD 5800 respectively.
10. Is the market size provided in terms of value or volume?
The market size is provided in terms of value, measured in Million.
11. Are there any specific market keywords associated with the report?
Yes, the market keyword associated with the report is "Computed Tomography Market in China," which aids in identifying and referencing the specific market segment covered.
12. How do I determine which pricing option suits my needs best?
The pricing options vary based on user requirements and access needs. Individual users may opt for single-user licenses, while businesses requiring broader access may choose multi-user or enterprise licenses for cost-effective access to the report.
13. Are there any additional resources or data provided in the Computed Tomography Market in China report?
While the report offers comprehensive insights, it's advisable to review the specific contents or supplementary materials provided to ascertain if additional resources or data are available.
14. How can I stay updated on further developments or reports in the Computed Tomography Market in China?
To stay informed about further developments, trends, and reports in the Computed Tomography Market in China, consider subscribing to industry newsletters, following relevant companies and organizations, or regularly checking reputable industry news sources and publications.
Methodology
Step 1 - Identification of Relevant Samples Size from Population Database


Step 2 - Approaches for Defining Global Market Size (Value, Volume* & Price*)

Note*: In applicable scenarios
Step 3 - Data Sources
Primary Research
- Web Analytics
- Survey Reports
- Research Institute
- Latest Research Reports
- Opinion Leaders
Secondary Research
- Annual Reports
- White Paper
- Latest Press Release
- Industry Association
- Paid Database
- Investor Presentations

Step 4 - Data Triangulation
Involves using different sources of information in order to increase the validity of a study
These sources are likely to be stakeholders in a program - participants, other researchers, program staff, other community members, and so on.
Then we put all data in single framework & apply various statistical tools to find out the dynamic on the market.
During the analysis stage, feedback from the stakeholder groups would be compared to determine areas of agreement as well as areas of divergence


