
Key Insights
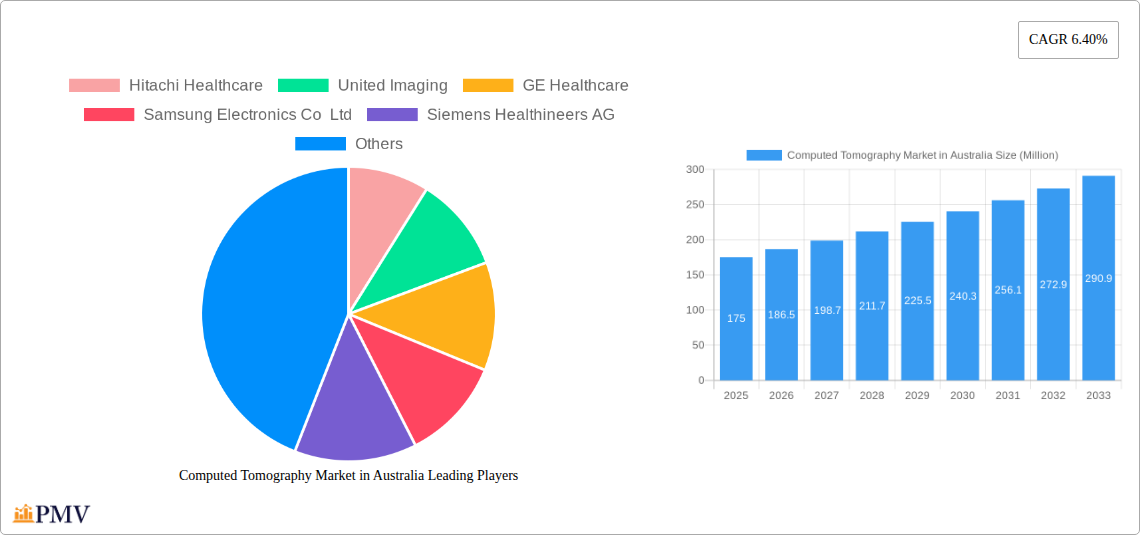
The Australian computed tomography (CT) market exhibits robust growth, driven by factors such as rising prevalence of chronic diseases necessitating advanced diagnostic imaging, increasing geriatric population, technological advancements leading to faster scan times and improved image quality, and government initiatives promoting healthcare infrastructure development. The market is segmented by application (oncology, neurology, cardiovascular, musculoskeletal, and other applications), end-user (hospitals, diagnostic centers, and other end-users), and CT scanner type (low, medium, and high slice). While the precise market size for 2025 is unavailable, considering a CAGR of 6.40% from 2019 to 2024, and projecting this forward, a reasonable estimate for the 2025 Australian CT market value would place it in the range of AU$150-200 million. This projection considers the ongoing investment in healthcare infrastructure and the sustained demand for sophisticated diagnostic tools. Major players like Hitachi Healthcare, GE Healthcare, and Siemens Healthineers are key market competitors, consistently striving to innovate and improve their CT scanner offerings. The market's growth is, however, subject to restraints such as the high cost of advanced CT scanners, limited reimbursement policies, and the potential for regulatory hurdles in technology adoption.
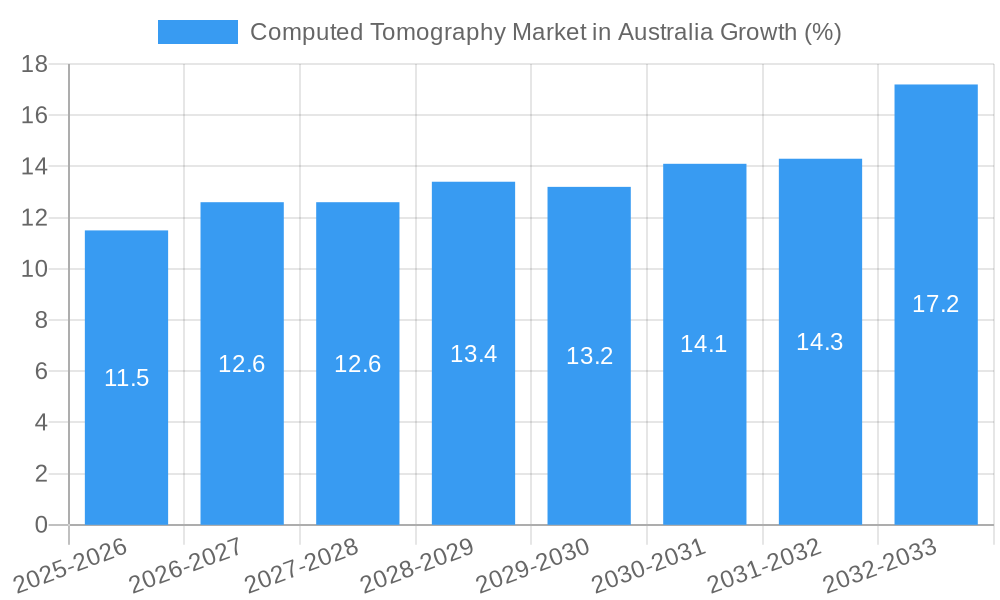
The forecast period from 2025 to 2033 anticipates continued expansion, with the CAGR of 6.40% likely to be maintained or slightly adjusted based on technological advancements and economic factors. The high-slice CT segment is poised for substantial growth, driven by its superior imaging capabilities, enabling more accurate diagnoses and treatment planning. Hospitals will remain the dominant end-users, given their extensive diagnostic needs and established infrastructure. The ongoing focus on early disease detection and the increasing preference for minimally invasive procedures further contribute to the market's positive trajectory. Growth will likely be most pronounced in metropolitan areas with higher population densities and advanced healthcare facilities. While predicting precise figures remains challenging without complete data, the Australian CT market presents a significant opportunity for both established players and emerging innovators in the medical imaging sector.
Computed Tomography Market in Australia: A Comprehensive Report (2019-2033)
This detailed report provides a comprehensive analysis of the Computed Tomography (CT) market in Australia, covering the period from 2019 to 2033. It offers in-depth insights into market dynamics, competitive landscape, technological advancements, and future growth prospects. The report is essential for stakeholders including manufacturers, healthcare providers, investors, and regulatory bodies seeking to understand and navigate this dynamic market.
Computed Tomography Market in Australia Market Structure & Competitive Dynamics
The Australian CT market exhibits a moderately concentrated structure, with key players like GE Healthcare, Siemens Healthineers AG, Hitachi Healthcare, Koninklijke Philips NV, and Samsung Electronics Co Ltd holding significant market share. Market concentration is influenced by factors such as regulatory approvals, technological innovation, and established distribution networks. The market demonstrates a robust innovation ecosystem, with ongoing advancements in CT scanner technology driving market growth. Regulatory frameworks, such as those set by the Therapeutic Goods Administration (TGA), play a crucial role in shaping market access and product approvals. The market experiences some competition from alternative imaging modalities such as MRI and ultrasound, but CT remains vital for many applications due to its speed and versatility. End-user trends favor advanced CT systems offering improved image quality, faster scan times, and reduced radiation dose. M&A activity in the Australian CT market has been moderate in recent years, with deal values averaging xx Million over the historical period (2019-2024). While precise market share data for each player is proprietary, GE Healthcare and Siemens Healthineers are projected to hold a combined market share exceeding xx% in 2025.
Computed Tomography Market in Australia Industry Trends & Insights
The Australian CT market is experiencing robust growth, driven by a confluence of factors. The increasing prevalence of chronic diseases, such as cardiovascular diseases and cancer, fuels demand for diagnostic imaging services. Technological advancements, including the development of multi-slice CT scanners with improved image quality and reduced radiation exposure, are propelling market expansion. Furthermore, government initiatives aimed at improving healthcare infrastructure and access to advanced medical technologies are positively impacting market growth. The market exhibits a strong preference for high-end CT systems offering advanced functionalities like iterative reconstruction techniques and advanced post-processing software. The adoption rate of these systems is expected to increase significantly during the forecast period (2025-2033). The competitive dynamics are characterized by intense competition among established players, leading to continuous innovation and price optimization. The Compound Annual Growth Rate (CAGR) for the Australian CT market is projected to be xx% during the forecast period (2025-2033), with market penetration exceeding xx% by 2033.
Dominant Markets & Segments in Computed Tomography Market in Australia
By Application: Oncology remains the dominant application segment, driven by the rising incidence of cancer and the need for precise diagnosis and treatment planning. Cardiovascular applications are also significant, with substantial demand for CT angiography. Musculoskeletal applications are growing steadily, particularly due to an aging population and increased incidence of related injuries and disorders. Key drivers for these segments include increasing disease prevalence, technological advancements, and favorable reimbursement policies.
By End User: Hospitals constitute the largest end-user segment, accounting for a substantial portion of the CT market. This is attributed to the availability of comprehensive imaging facilities and highly qualified personnel in hospitals. Diagnostic centers represent a significant and rapidly growing segment, driven by increasing outsourcing of imaging services and the emergence of specialized diagnostic facilities. The growth of this segment is supported by increased investment in private healthcare facilities and a growing demand for readily available diagnostic services.
By Type: High-slice CT scanners represent the fastest-growing segment, driven by their superior image quality, faster scan speeds, and advanced functionalities. Medium-slice scanners maintain a significant market share due to their cost-effectiveness and suitability for a wide range of applications. Low-slice scanners cater to niche applications and cost-sensitive settings. The preference for higher-slice scanners is largely driven by the improved diagnostic capabilities and the potential for reduced re-scans, resulting in a higher overall efficiency.
Computed Tomography Market in Australia Product Innovations
Recent advancements in CT technology focus on improving image quality, reducing radiation dose, and enhancing workflow efficiency. Manufacturers are increasingly incorporating artificial intelligence (AI) and machine learning (ML) algorithms for automated image analysis and improved diagnostic accuracy. The development of dual-energy CT and spectral CT provides further advancements in diagnostic capabilities, facilitating differentiation of tissue types and improved visualization of subtle abnormalities. These innovations are enhancing the overall clinical value of CT scans and further solidifying their position as a critical diagnostic tool.
Report Segmentation & Scope
This report segments the Australian CT market by application (Oncology, Neurology, Cardiovascular, Musculoskeletal, Other Applications), end-user (Hospitals, Diagnostic Centers, Other End Users), and type (Low Slice, Medium Slice, High Slice). Each segment's growth projections, market size estimations, and competitive dynamics are meticulously analyzed throughout the forecast period (2025-2033). The detailed breakdown allows for a granular understanding of the various market forces at play within each segment. Market size is predicted to reach xx Million by 2033.
Key Drivers of Computed Tomography Market in Australia Growth
Several factors contribute to the growth of the Australian CT market: an aging population necessitating more diagnostic procedures; rising prevalence of chronic diseases like cancer and cardiovascular ailments; technological advancements resulting in faster, more accurate, and lower radiation dose scans; government initiatives supporting healthcare infrastructure development; and the increased adoption of private health insurance boosting access to diagnostic imaging services. These combined drivers are fostering a significant increase in demand for advanced CT systems.
Challenges in the Computed Tomography Market in Australia Sector
Challenges facing the market include high costs associated with advanced CT equipment and maintenance, stringent regulatory requirements for medical device approvals (TGA), potential supply chain disruptions impacting equipment availability, and the competitive pressure from alternative imaging modalities. These factors influence pricing strategies and potentially limit market penetration in certain segments. The cost implications for both patients and healthcare providers remains a constant challenge in expanding access to this crucial technology.
Leading Players in the Computed Tomography Market in Australia Market
- Hitachi Healthcare
- United Imaging
- GE Healthcare
- Samsung Electronics Co Ltd
- Siemens Healthineers AG
- Carestream Health
- Koninklijke Philips NV
- J Morita Corporation
- Neusoft Medical Systems
- Planmeca Group (Planmed OY)
Key Developments in Computed Tomography Market in Australia Sector
- May 2023: Launch of a mobile radiography clinic utilizing a Philips' 128-slice Incisive CT Pro scanner, expanding access to lung screenings for Australian minors.
- April 2022: USD 17.2 Million in Federal Government funding for mobile health clinics, providing services including CT and X-ray imaging, enhancing accessibility and affordability of diagnostic services.
Strategic Computed Tomography Market in Australia Market Outlook
The Australian CT market is poised for continued growth, driven by the factors outlined above. Strategic opportunities exist for manufacturers in developing and deploying innovative CT technologies, particularly those incorporating AI and ML. Expansion of mobile CT services and telemedicine platforms can increase access to care in underserved regions. Focus on enhancing patient experience and reducing healthcare costs will be vital for market success in the coming years. The market shows excellent prospects for growth and innovation, offering significant returns on investment for players who can adapt to the evolving technological and regulatory landscape.
Computed Tomography Market in Australia Segmentation
-
1. Type
- 1.1. Low Slice
- 1.2. Medium Slice
- 1.3. High Slice
-
2. Application
- 2.1. Oncology
- 2.2. Neurology
- 2.3. Cardiovascular
- 2.4. Musculoskeletal
- 2.5. Other Applications
-
3. End User
- 3.1. Hospitals
- 3.2. Diagnostic Centers
- 3.3. Other End Users
Computed Tomography Market in Australia Segmentation By Geography
-
1. North America
- 1.1. United States
- 1.2. Canada
- 1.3. Mexico
-
2. South America
- 2.1. Brazil
- 2.2. Argentina
- 2.3. Rest of South America
-
3. Europe
- 3.1. United Kingdom
- 3.2. Germany
- 3.3. France
- 3.4. Italy
- 3.5. Spain
- 3.6. Russia
- 3.7. Benelux
- 3.8. Nordics
- 3.9. Rest of Europe
-
4. Middle East & Africa
- 4.1. Turkey
- 4.2. Israel
- 4.3. GCC
- 4.4. North Africa
- 4.5. South Africa
- 4.6. Rest of Middle East & Africa
-
5. Asia Pacific
- 5.1. China
- 5.2. India
- 5.3. Japan
- 5.4. South Korea
- 5.5. ASEAN
- 5.6. Oceania
- 5.7. Rest of Asia Pacific
Computed Tomography Market in Australia REPORT HIGHLIGHTS
| Aspects | Details |
|---|---|
| Study Period | 2019-2033 |
| Base Year | 2024 |
| Estimated Year | 2025 |
| Forecast Period | 2025-2033 |
| Historical Period | 2019-2024 |
| Growth Rate | CAGR of 6.40% from 2019-2033 |
| Segmentation |
|
Table of Contents
- 1. Introduction
- 1.1. Research Scope
- 1.2. Market Segmentation
- 1.3. Research Methodology
- 1.4. Definitions and Assumptions
- 2. Executive Summary
- 2.1. Introduction
- 3. Market Dynamics
- 3.1. Introduction
- 3.2. Market Drivers
- 3.2.1. Increasing Prevalence of Chronic Diseases and Rising Geriatric Population; Technological Advancement and Investment in Healthcare Facilities
- 3.3. Market Restrains
- 3.3.1. Lack of Proper Reimbursement and Stringent Regulatory Approval Procedures; High Cost of Equipment
- 3.4. Market Trends
- 3.4.1. Hospitals Segment is Expected to Hold a Significant Market Share Over the Forecast Period
- 4. Market Factor Analysis
- 4.1. Porters Five Forces
- 4.2. Supply/Value Chain
- 4.3. PESTEL analysis
- 4.4. Market Entropy
- 4.5. Patent/Trademark Analysis
- 5. Global Computed Tomography Market in Australia Analysis, Insights and Forecast, 2019-2031
- 5.1. Market Analysis, Insights and Forecast - by Type
- 5.1.1. Low Slice
- 5.1.2. Medium Slice
- 5.1.3. High Slice
- 5.2. Market Analysis, Insights and Forecast - by Application
- 5.2.1. Oncology
- 5.2.2. Neurology
- 5.2.3. Cardiovascular
- 5.2.4. Musculoskeletal
- 5.2.5. Other Applications
- 5.3. Market Analysis, Insights and Forecast - by End User
- 5.3.1. Hospitals
- 5.3.2. Diagnostic Centers
- 5.3.3. Other End Users
- 5.4. Market Analysis, Insights and Forecast - by Region
- 5.4.1. North America
- 5.4.2. South America
- 5.4.3. Europe
- 5.4.4. Middle East & Africa
- 5.4.5. Asia Pacific
- 5.1. Market Analysis, Insights and Forecast - by Type
- 6. North America Computed Tomography Market in Australia Analysis, Insights and Forecast, 2019-2031
- 6.1. Market Analysis, Insights and Forecast - by Type
- 6.1.1. Low Slice
- 6.1.2. Medium Slice
- 6.1.3. High Slice
- 6.2. Market Analysis, Insights and Forecast - by Application
- 6.2.1. Oncology
- 6.2.2. Neurology
- 6.2.3. Cardiovascular
- 6.2.4. Musculoskeletal
- 6.2.5. Other Applications
- 6.3. Market Analysis, Insights and Forecast - by End User
- 6.3.1. Hospitals
- 6.3.2. Diagnostic Centers
- 6.3.3. Other End Users
- 6.1. Market Analysis, Insights and Forecast - by Type
- 7. South America Computed Tomography Market in Australia Analysis, Insights and Forecast, 2019-2031
- 7.1. Market Analysis, Insights and Forecast - by Type
- 7.1.1. Low Slice
- 7.1.2. Medium Slice
- 7.1.3. High Slice
- 7.2. Market Analysis, Insights and Forecast - by Application
- 7.2.1. Oncology
- 7.2.2. Neurology
- 7.2.3. Cardiovascular
- 7.2.4. Musculoskeletal
- 7.2.5. Other Applications
- 7.3. Market Analysis, Insights and Forecast - by End User
- 7.3.1. Hospitals
- 7.3.2. Diagnostic Centers
- 7.3.3. Other End Users
- 7.1. Market Analysis, Insights and Forecast - by Type
- 8. Europe Computed Tomography Market in Australia Analysis, Insights and Forecast, 2019-2031
- 8.1. Market Analysis, Insights and Forecast - by Type
- 8.1.1. Low Slice
- 8.1.2. Medium Slice
- 8.1.3. High Slice
- 8.2. Market Analysis, Insights and Forecast - by Application
- 8.2.1. Oncology
- 8.2.2. Neurology
- 8.2.3. Cardiovascular
- 8.2.4. Musculoskeletal
- 8.2.5. Other Applications
- 8.3. Market Analysis, Insights and Forecast - by End User
- 8.3.1. Hospitals
- 8.3.2. Diagnostic Centers
- 8.3.3. Other End Users
- 8.1. Market Analysis, Insights and Forecast - by Type
- 9. Middle East & Africa Computed Tomography Market in Australia Analysis, Insights and Forecast, 2019-2031
- 9.1. Market Analysis, Insights and Forecast - by Type
- 9.1.1. Low Slice
- 9.1.2. Medium Slice
- 9.1.3. High Slice
- 9.2. Market Analysis, Insights and Forecast - by Application
- 9.2.1. Oncology
- 9.2.2. Neurology
- 9.2.3. Cardiovascular
- 9.2.4. Musculoskeletal
- 9.2.5. Other Applications
- 9.3. Market Analysis, Insights and Forecast - by End User
- 9.3.1. Hospitals
- 9.3.2. Diagnostic Centers
- 9.3.3. Other End Users
- 9.1. Market Analysis, Insights and Forecast - by Type
- 10. Asia Pacific Computed Tomography Market in Australia Analysis, Insights and Forecast, 2019-2031
- 10.1. Market Analysis, Insights and Forecast - by Type
- 10.1.1. Low Slice
- 10.1.2. Medium Slice
- 10.1.3. High Slice
- 10.2. Market Analysis, Insights and Forecast - by Application
- 10.2.1. Oncology
- 10.2.2. Neurology
- 10.2.3. Cardiovascular
- 10.2.4. Musculoskeletal
- 10.2.5. Other Applications
- 10.3. Market Analysis, Insights and Forecast - by End User
- 10.3.1. Hospitals
- 10.3.2. Diagnostic Centers
- 10.3.3. Other End Users
- 10.1. Market Analysis, Insights and Forecast - by Type
- 11. Competitive Analysis
- 11.1. Global Market Share Analysis 2024
- 11.2. Company Profiles
- 11.2.1 Hitachi Healthcare
- 11.2.1.1. Overview
- 11.2.1.2. Products
- 11.2.1.3. SWOT Analysis
- 11.2.1.4. Recent Developments
- 11.2.1.5. Financials (Based on Availability)
- 11.2.2 United Imaging
- 11.2.2.1. Overview
- 11.2.2.2. Products
- 11.2.2.3. SWOT Analysis
- 11.2.2.4. Recent Developments
- 11.2.2.5. Financials (Based on Availability)
- 11.2.3 GE Healthcare
- 11.2.3.1. Overview
- 11.2.3.2. Products
- 11.2.3.3. SWOT Analysis
- 11.2.3.4. Recent Developments
- 11.2.3.5. Financials (Based on Availability)
- 11.2.4 Samsung Electronics Co Ltd
- 11.2.4.1. Overview
- 11.2.4.2. Products
- 11.2.4.3. SWOT Analysis
- 11.2.4.4. Recent Developments
- 11.2.4.5. Financials (Based on Availability)
- 11.2.5 Siemens Healthineers AG
- 11.2.5.1. Overview
- 11.2.5.2. Products
- 11.2.5.3. SWOT Analysis
- 11.2.5.4. Recent Developments
- 11.2.5.5. Financials (Based on Availability)
- 11.2.6 Carestream Health
- 11.2.6.1. Overview
- 11.2.6.2. Products
- 11.2.6.3. SWOT Analysis
- 11.2.6.4. Recent Developments
- 11.2.6.5. Financials (Based on Availability)
- 11.2.7 Koninklijke Philips NV
- 11.2.7.1. Overview
- 11.2.7.2. Products
- 11.2.7.3. SWOT Analysis
- 11.2.7.4. Recent Developments
- 11.2.7.5. Financials (Based on Availability)
- 11.2.8 J Morita Corporation
- 11.2.8.1. Overview
- 11.2.8.2. Products
- 11.2.8.3. SWOT Analysis
- 11.2.8.4. Recent Developments
- 11.2.8.5. Financials (Based on Availability)
- 11.2.9 Neusoft Medical Systems*List Not Exhaustive
- 11.2.9.1. Overview
- 11.2.9.2. Products
- 11.2.9.3. SWOT Analysis
- 11.2.9.4. Recent Developments
- 11.2.9.5. Financials (Based on Availability)
- 11.2.10 Planmeca Group (Planmed OY)
- 11.2.10.1. Overview
- 11.2.10.2. Products
- 11.2.10.3. SWOT Analysis
- 11.2.10.4. Recent Developments
- 11.2.10.5. Financials (Based on Availability)
- 11.2.1 Hitachi Healthcare
List of Figures
- Figure 1: Global Computed Tomography Market in Australia Revenue Breakdown (Million, %) by Region 2024 & 2032
- Figure 2: Australia Computed Tomography Market in Australia Revenue (Million), by Country 2024 & 2032
- Figure 3: Australia Computed Tomography Market in Australia Revenue Share (%), by Country 2024 & 2032
- Figure 4: North America Computed Tomography Market in Australia Revenue (Million), by Type 2024 & 2032
- Figure 5: North America Computed Tomography Market in Australia Revenue Share (%), by Type 2024 & 2032
- Figure 6: North America Computed Tomography Market in Australia Revenue (Million), by Application 2024 & 2032
- Figure 7: North America Computed Tomography Market in Australia Revenue Share (%), by Application 2024 & 2032
- Figure 8: North America Computed Tomography Market in Australia Revenue (Million), by End User 2024 & 2032
- Figure 9: North America Computed Tomography Market in Australia Revenue Share (%), by End User 2024 & 2032
- Figure 10: North America Computed Tomography Market in Australia Revenue (Million), by Country 2024 & 2032
- Figure 11: North America Computed Tomography Market in Australia Revenue Share (%), by Country 2024 & 2032
- Figure 12: South America Computed Tomography Market in Australia Revenue (Million), by Type 2024 & 2032
- Figure 13: South America Computed Tomography Market in Australia Revenue Share (%), by Type 2024 & 2032
- Figure 14: South America Computed Tomography Market in Australia Revenue (Million), by Application 2024 & 2032
- Figure 15: South America Computed Tomography Market in Australia Revenue Share (%), by Application 2024 & 2032
- Figure 16: South America Computed Tomography Market in Australia Revenue (Million), by End User 2024 & 2032
- Figure 17: South America Computed Tomography Market in Australia Revenue Share (%), by End User 2024 & 2032
- Figure 18: South America Computed Tomography Market in Australia Revenue (Million), by Country 2024 & 2032
- Figure 19: South America Computed Tomography Market in Australia Revenue Share (%), by Country 2024 & 2032
- Figure 20: Europe Computed Tomography Market in Australia Revenue (Million), by Type 2024 & 2032
- Figure 21: Europe Computed Tomography Market in Australia Revenue Share (%), by Type 2024 & 2032
- Figure 22: Europe Computed Tomography Market in Australia Revenue (Million), by Application 2024 & 2032
- Figure 23: Europe Computed Tomography Market in Australia Revenue Share (%), by Application 2024 & 2032
- Figure 24: Europe Computed Tomography Market in Australia Revenue (Million), by End User 2024 & 2032
- Figure 25: Europe Computed Tomography Market in Australia Revenue Share (%), by End User 2024 & 2032
- Figure 26: Europe Computed Tomography Market in Australia Revenue (Million), by Country 2024 & 2032
- Figure 27: Europe Computed Tomography Market in Australia Revenue Share (%), by Country 2024 & 2032
- Figure 28: Middle East & Africa Computed Tomography Market in Australia Revenue (Million), by Type 2024 & 2032
- Figure 29: Middle East & Africa Computed Tomography Market in Australia Revenue Share (%), by Type 2024 & 2032
- Figure 30: Middle East & Africa Computed Tomography Market in Australia Revenue (Million), by Application 2024 & 2032
- Figure 31: Middle East & Africa Computed Tomography Market in Australia Revenue Share (%), by Application 2024 & 2032
- Figure 32: Middle East & Africa Computed Tomography Market in Australia Revenue (Million), by End User 2024 & 2032
- Figure 33: Middle East & Africa Computed Tomography Market in Australia Revenue Share (%), by End User 2024 & 2032
- Figure 34: Middle East & Africa Computed Tomography Market in Australia Revenue (Million), by Country 2024 & 2032
- Figure 35: Middle East & Africa Computed Tomography Market in Australia Revenue Share (%), by Country 2024 & 2032
- Figure 36: Asia Pacific Computed Tomography Market in Australia Revenue (Million), by Type 2024 & 2032
- Figure 37: Asia Pacific Computed Tomography Market in Australia Revenue Share (%), by Type 2024 & 2032
- Figure 38: Asia Pacific Computed Tomography Market in Australia Revenue (Million), by Application 2024 & 2032
- Figure 39: Asia Pacific Computed Tomography Market in Australia Revenue Share (%), by Application 2024 & 2032
- Figure 40: Asia Pacific Computed Tomography Market in Australia Revenue (Million), by End User 2024 & 2032
- Figure 41: Asia Pacific Computed Tomography Market in Australia Revenue Share (%), by End User 2024 & 2032
- Figure 42: Asia Pacific Computed Tomography Market in Australia Revenue (Million), by Country 2024 & 2032
- Figure 43: Asia Pacific Computed Tomography Market in Australia Revenue Share (%), by Country 2024 & 2032
List of Tables
- Table 1: Global Computed Tomography Market in Australia Revenue Million Forecast, by Region 2019 & 2032
- Table 2: Global Computed Tomography Market in Australia Revenue Million Forecast, by Type 2019 & 2032
- Table 3: Global Computed Tomography Market in Australia Revenue Million Forecast, by Application 2019 & 2032
- Table 4: Global Computed Tomography Market in Australia Revenue Million Forecast, by End User 2019 & 2032
- Table 5: Global Computed Tomography Market in Australia Revenue Million Forecast, by Region 2019 & 2032
- Table 6: Global Computed Tomography Market in Australia Revenue Million Forecast, by Country 2019 & 2032
- Table 7: Global Computed Tomography Market in Australia Revenue Million Forecast, by Type 2019 & 2032
- Table 8: Global Computed Tomography Market in Australia Revenue Million Forecast, by Application 2019 & 2032
- Table 9: Global Computed Tomography Market in Australia Revenue Million Forecast, by End User 2019 & 2032
- Table 10: Global Computed Tomography Market in Australia Revenue Million Forecast, by Country 2019 & 2032
- Table 11: United States Computed Tomography Market in Australia Revenue (Million) Forecast, by Application 2019 & 2032
- Table 12: Canada Computed Tomography Market in Australia Revenue (Million) Forecast, by Application 2019 & 2032
- Table 13: Mexico Computed Tomography Market in Australia Revenue (Million) Forecast, by Application 2019 & 2032
- Table 14: Global Computed Tomography Market in Australia Revenue Million Forecast, by Type 2019 & 2032
- Table 15: Global Computed Tomography Market in Australia Revenue Million Forecast, by Application 2019 & 2032
- Table 16: Global Computed Tomography Market in Australia Revenue Million Forecast, by End User 2019 & 2032
- Table 17: Global Computed Tomography Market in Australia Revenue Million Forecast, by Country 2019 & 2032
- Table 18: Brazil Computed Tomography Market in Australia Revenue (Million) Forecast, by Application 2019 & 2032
- Table 19: Argentina Computed Tomography Market in Australia Revenue (Million) Forecast, by Application 2019 & 2032
- Table 20: Rest of South America Computed Tomography Market in Australia Revenue (Million) Forecast, by Application 2019 & 2032
- Table 21: Global Computed Tomography Market in Australia Revenue Million Forecast, by Type 2019 & 2032
- Table 22: Global Computed Tomography Market in Australia Revenue Million Forecast, by Application 2019 & 2032
- Table 23: Global Computed Tomography Market in Australia Revenue Million Forecast, by End User 2019 & 2032
- Table 24: Global Computed Tomography Market in Australia Revenue Million Forecast, by Country 2019 & 2032
- Table 25: United Kingdom Computed Tomography Market in Australia Revenue (Million) Forecast, by Application 2019 & 2032
- Table 26: Germany Computed Tomography Market in Australia Revenue (Million) Forecast, by Application 2019 & 2032
- Table 27: France Computed Tomography Market in Australia Revenue (Million) Forecast, by Application 2019 & 2032
- Table 28: Italy Computed Tomography Market in Australia Revenue (Million) Forecast, by Application 2019 & 2032
- Table 29: Spain Computed Tomography Market in Australia Revenue (Million) Forecast, by Application 2019 & 2032
- Table 30: Russia Computed Tomography Market in Australia Revenue (Million) Forecast, by Application 2019 & 2032
- Table 31: Benelux Computed Tomography Market in Australia Revenue (Million) Forecast, by Application 2019 & 2032
- Table 32: Nordics Computed Tomography Market in Australia Revenue (Million) Forecast, by Application 2019 & 2032
- Table 33: Rest of Europe Computed Tomography Market in Australia Revenue (Million) Forecast, by Application 2019 & 2032
- Table 34: Global Computed Tomography Market in Australia Revenue Million Forecast, by Type 2019 & 2032
- Table 35: Global Computed Tomography Market in Australia Revenue Million Forecast, by Application 2019 & 2032
- Table 36: Global Computed Tomography Market in Australia Revenue Million Forecast, by End User 2019 & 2032
- Table 37: Global Computed Tomography Market in Australia Revenue Million Forecast, by Country 2019 & 2032
- Table 38: Turkey Computed Tomography Market in Australia Revenue (Million) Forecast, by Application 2019 & 2032
- Table 39: Israel Computed Tomography Market in Australia Revenue (Million) Forecast, by Application 2019 & 2032
- Table 40: GCC Computed Tomography Market in Australia Revenue (Million) Forecast, by Application 2019 & 2032
- Table 41: North Africa Computed Tomography Market in Australia Revenue (Million) Forecast, by Application 2019 & 2032
- Table 42: South Africa Computed Tomography Market in Australia Revenue (Million) Forecast, by Application 2019 & 2032
- Table 43: Rest of Middle East & Africa Computed Tomography Market in Australia Revenue (Million) Forecast, by Application 2019 & 2032
- Table 44: Global Computed Tomography Market in Australia Revenue Million Forecast, by Type 2019 & 2032
- Table 45: Global Computed Tomography Market in Australia Revenue Million Forecast, by Application 2019 & 2032
- Table 46: Global Computed Tomography Market in Australia Revenue Million Forecast, by End User 2019 & 2032
- Table 47: Global Computed Tomography Market in Australia Revenue Million Forecast, by Country 2019 & 2032
- Table 48: China Computed Tomography Market in Australia Revenue (Million) Forecast, by Application 2019 & 2032
- Table 49: India Computed Tomography Market in Australia Revenue (Million) Forecast, by Application 2019 & 2032
- Table 50: Japan Computed Tomography Market in Australia Revenue (Million) Forecast, by Application 2019 & 2032
- Table 51: South Korea Computed Tomography Market in Australia Revenue (Million) Forecast, by Application 2019 & 2032
- Table 52: ASEAN Computed Tomography Market in Australia Revenue (Million) Forecast, by Application 2019 & 2032
- Table 53: Oceania Computed Tomography Market in Australia Revenue (Million) Forecast, by Application 2019 & 2032
- Table 54: Rest of Asia Pacific Computed Tomography Market in Australia Revenue (Million) Forecast, by Application 2019 & 2032
Frequently Asked Questions
1. What is the projected Compound Annual Growth Rate (CAGR) of the Computed Tomography Market in Australia?
The projected CAGR is approximately 6.40%.
2. Which companies are prominent players in the Computed Tomography Market in Australia?
Key companies in the market include Hitachi Healthcare, United Imaging, GE Healthcare, Samsung Electronics Co Ltd, Siemens Healthineers AG, Carestream Health, Koninklijke Philips NV, J Morita Corporation, Neusoft Medical Systems*List Not Exhaustive, Planmeca Group (Planmed OY).
3. What are the main segments of the Computed Tomography Market in Australia?
The market segments include Type, Application, End User.
4. Can you provide details about the market size?
The market size is estimated to be USD XX Million as of 2022.
5. What are some drivers contributing to market growth?
Increasing Prevalence of Chronic Diseases and Rising Geriatric Population; Technological Advancement and Investment in Healthcare Facilities.
6. What are the notable trends driving market growth?
Hospitals Segment is Expected to Hold a Significant Market Share Over the Forecast Period.
7. Are there any restraints impacting market growth?
Lack of Proper Reimbursement and Stringent Regulatory Approval Procedures; High Cost of Equipment.
8. Can you provide examples of recent developments in the market?
In May 2023, the mobile radiography clinic, after four years, reached the Heart of Australia truck, which was launched in February 2022. The truck took the Philips' 128-slice Incisive CT Pro scanner to screen the lungs of Australian minors.
9. What pricing options are available for accessing the report?
Pricing options include single-user, multi-user, and enterprise licenses priced at USD 3800, USD 4500, and USD 5800 respectively.
10. Is the market size provided in terms of value or volume?
The market size is provided in terms of value, measured in Million.
11. Are there any specific market keywords associated with the report?
Yes, the market keyword associated with the report is "Computed Tomography Market in Australia," which aids in identifying and referencing the specific market segment covered.
12. How do I determine which pricing option suits my needs best?
The pricing options vary based on user requirements and access needs. Individual users may opt for single-user licenses, while businesses requiring broader access may choose multi-user or enterprise licenses for cost-effective access to the report.
13. Are there any additional resources or data provided in the Computed Tomography Market in Australia report?
While the report offers comprehensive insights, it's advisable to review the specific contents or supplementary materials provided to ascertain if additional resources or data are available.
14. How can I stay updated on further developments or reports in the Computed Tomography Market in Australia?
To stay informed about further developments, trends, and reports in the Computed Tomography Market in Australia, consider subscribing to industry newsletters, following relevant companies and organizations, or regularly checking reputable industry news sources and publications.
Methodology
Step 1 - Identification of Relevant Samples Size from Population Database


Step 2 - Approaches for Defining Global Market Size (Value, Volume* & Price*)

Note*: In applicable scenarios
Step 3 - Data Sources
Primary Research
- Web Analytics
- Survey Reports
- Research Institute
- Latest Research Reports
- Opinion Leaders
Secondary Research
- Annual Reports
- White Paper
- Latest Press Release
- Industry Association
- Paid Database
- Investor Presentations

Step 4 - Data Triangulation
Involves using different sources of information in order to increase the validity of a study
These sources are likely to be stakeholders in a program - participants, other researchers, program staff, other community members, and so on.
Then we put all data in single framework & apply various statistical tools to find out the dynamic on the market.
During the analysis stage, feedback from the stakeholder groups would be compared to determine areas of agreement as well as areas of divergence


