
Key Insights
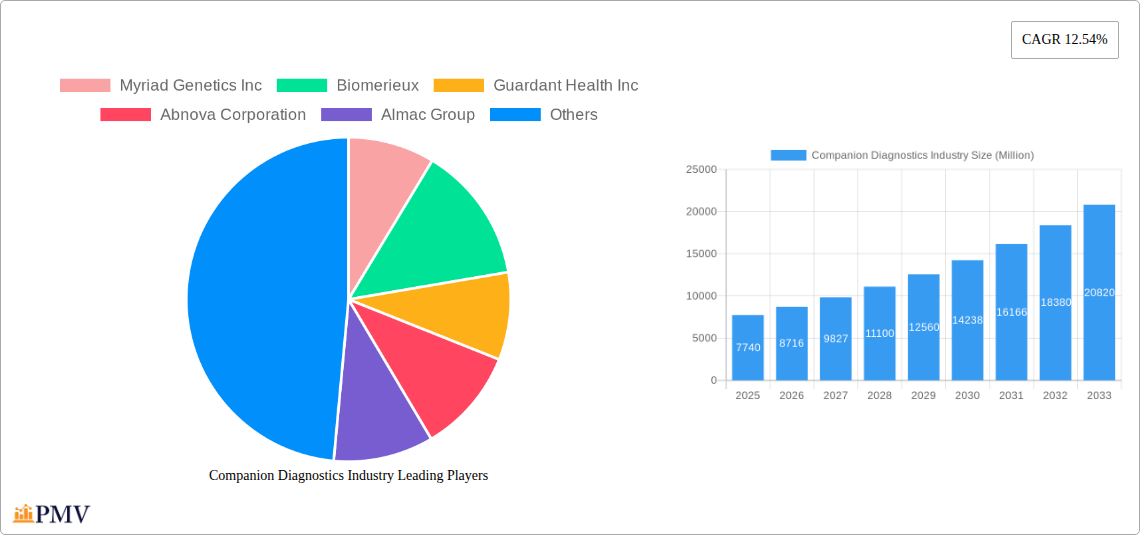
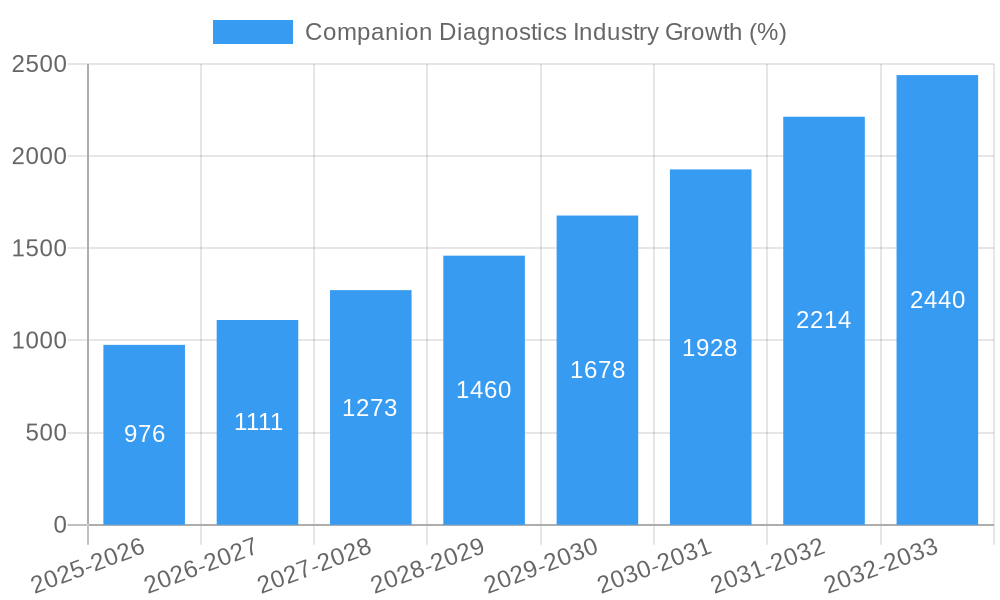
The companion diagnostics market, valued at $7.74 billion in 2025, is experiencing robust growth, projected to expand at a compound annual growth rate (CAGR) of 12.54% from 2025 to 2033. This surge is driven primarily by the increasing prevalence of cancer and other chronic diseases, necessitating more precise and personalized treatment strategies. Technological advancements in areas like next-generation sequencing (NGS), immunohistochemistry (IHC), and polymerase chain reaction (PCR) are fueling innovation, enabling earlier and more accurate diagnoses, and facilitating the development of targeted therapies. The rising adoption of companion diagnostics across various cancer types, including lung, breast, and colorectal cancers, is a key growth driver. Furthermore, increasing government initiatives supporting research and development in personalized medicine contribute to market expansion. However, factors like high costs associated with testing and the complexities involved in regulatory approvals act as market restraints.
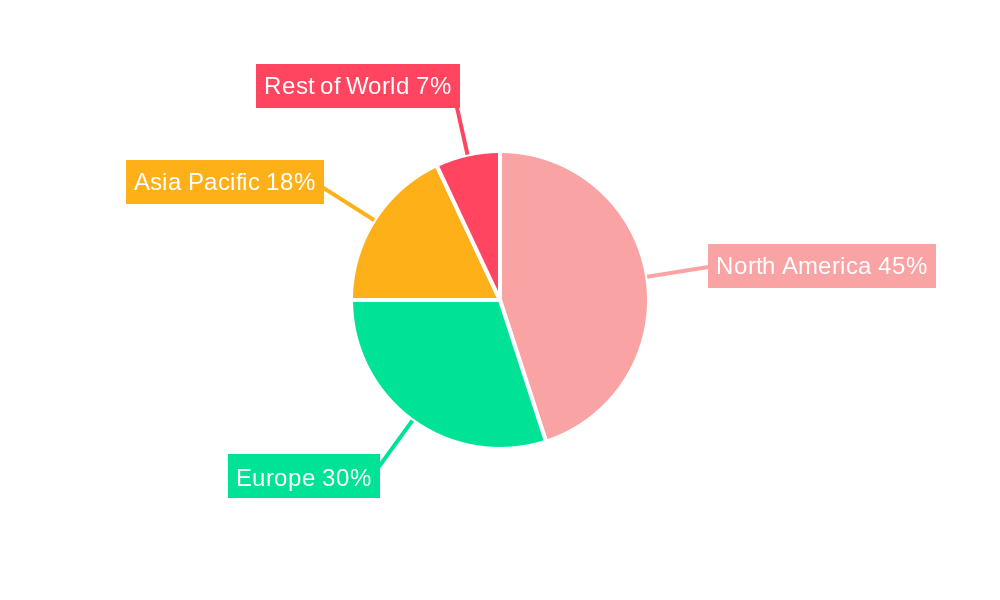
The market segmentation reveals a diversified landscape. Immunohistochemistry (IHC) and PCR currently hold significant market share, but gene sequencing and real-time PCR (RT-PCR) are expected to witness substantial growth due to their enhanced sensitivity and specificity. Geographically, North America is expected to maintain a dominant position due to advanced healthcare infrastructure and high adoption rates of advanced diagnostic technologies. However, Asia Pacific is poised for significant growth driven by rising healthcare expenditure and increasing cancer incidence in emerging economies like India and China. Key players like Myriad Genetics, Biomerieux, Guardant Health, and Thermo Fisher Scientific are actively involved in developing innovative diagnostic solutions and expanding their market presence through strategic partnerships and acquisitions, further shaping the competitive landscape.
Companion Diagnostics Industry Market Report: 2019-2033
This comprehensive report provides a detailed analysis of the Companion Diagnostics industry, covering market size, segmentation, competitive landscape, and future growth projections from 2019 to 2033. The study period encompasses historical data (2019-2024), the base year (2025), the estimated year (2025), and a forecast period (2025-2033). It offers actionable insights for industry stakeholders, including manufacturers, investors, and regulatory bodies. The global market is expected to reach xx Million by 2033, exhibiting a healthy CAGR of xx%.
Companion Diagnostics Industry Market Structure & Competitive Dynamics
The companion diagnostics market is characterized by a moderately concentrated structure with several major players holding significant market share. However, a vibrant ecosystem of smaller companies, particularly in the area of technology development, fosters innovation. Regulatory frameworks, including those from the FDA and EMA, significantly influence market access and product approval, creating both challenges and opportunities. The market experiences ongoing M&A activity, with larger companies acquiring smaller firms to expand their product portfolios and technological capabilities. Substitute products, such as traditional diagnostic methods, exist, but the increasing focus on personalized medicine fuels the demand for companion diagnostics. End-user trends, including the rising prevalence of chronic diseases and the increasing demand for targeted therapies, further drive market growth.
- Market Concentration: The top 5 players hold approximately xx% of the market share in 2025.
- Innovation Ecosystems: Significant investments in R&D and collaborations between diagnostics companies and pharmaceutical firms are driving innovation.
- Regulatory Frameworks: Stringent regulatory requirements for approval increase development costs but ensure product safety and efficacy.
- M&A Activity: Between 2019 and 2024, the total value of M&A deals in the companion diagnostics sector reached approximately xx Million. Examples include (specific deals with values would need to be researched and added here).
- Product Substitutes: Traditional diagnostic methods pose competitive pressure, but companion diagnostics offer superior precision and personalized insights.
- End-User Trends: The increasing prevalence of cancer and other chronic diseases is a major driver of market growth.
Companion Diagnostics Industry Industry Trends & Insights
The companion diagnostics market is experiencing robust growth, driven by several key factors. The rising prevalence of cancer and other chronic diseases necessitates the development of more precise diagnostic tools to guide treatment decisions. Technological advancements, particularly in gene sequencing and AI-powered pathology, are enhancing the accuracy and efficiency of companion diagnostics. Consumer preferences are shifting towards personalized medicine, creating a high demand for targeted therapies guided by companion diagnostics. Competitive dynamics are characterized by ongoing innovation, strategic alliances, and mergers and acquisitions, resulting in an evolving market landscape. The market is expected to witness a significant increase in the adoption of advanced technologies, along with expanding applications across various cancer types and other indications. The CAGR for the forecast period (2025-2033) is estimated to be xx%, with market penetration expected to increase by xx% by 2033.
Dominant Markets & Segments in Companion Diagnostics Industry
The North American region holds the largest market share, driven by high healthcare expenditure, advanced healthcare infrastructure, and strong regulatory support. Within technology segments, Polymerase Chain Reaction (PCR) and Immunohistochemistry (IHC) currently dominate due to their established presence and wide applications. However, Gene Sequencing is expected to experience significant growth due to advancements in technology and its potential for personalized medicine. In terms of indications, Lung Cancer, Breast Cancer, and Colorectal Cancer are the leading segments due to high prevalence rates and ongoing research activities.
Key Drivers:
- North America: High healthcare expenditure, robust research and development, and early adoption of new technologies.
- Europe: Increasing prevalence of cancer, government initiatives promoting personalized medicine.
- Asia Pacific: Rising healthcare spending, growing awareness of cancer, and increasing adoption of advanced diagnostic techniques.
Dominant Segments:
- By Technology: PCR and IHC currently hold the largest market shares but Gene Sequencing is poised for rapid growth.
- By Indication: Lung, breast, and colorectal cancers are currently the dominant segments due to high prevalence and established companion diagnostic applications.
Companion Diagnostics Industry Product Innovations
Recent innovations in companion diagnostics focus on improving accuracy, reducing turnaround time, and expanding applications. Integration of AI and machine learning into image analysis and data interpretation is enhancing diagnostic accuracy and efficiency. Miniaturization and point-of-care testing devices are improving accessibility and reducing costs. Development of novel biomarkers and assays is expanding the scope of companion diagnostics to encompass a broader range of cancers and other diseases. The market is witnessing a transition towards more sensitive and specific tests that enable early disease detection and more personalized treatment strategies.
Report Segmentation & Scope
This report segments the companion diagnostics market by technology (Immunohistochemistry (IHC), Polymerase Chain Reaction (PCR), In-situ Hybridization (ISH), Real-time PCR (RT-PCR), Gene Sequencing, Other Technologies) and by indication (Lung Cancer, Breast Cancer, Colorectal Cancer, Leukemia, Melanoma, Other Indications). Each segment is analyzed in detail, providing market size, growth projections, and competitive dynamics. The report covers various aspects, including technological advancements, regulatory landscape, market trends, competitive analysis, and future growth opportunities. Each segment's growth rate is projected to vary based on technological advancements and clinical needs. For example, Gene Sequencing is predicted to show a higher growth rate than IHC due to its potential for personalized medicine.
Key Drivers of Companion Diagnostics Industry Growth
Several key factors are driving the growth of the companion diagnostics industry. These include the increasing prevalence of chronic diseases, particularly cancer, leading to a greater need for personalized treatment strategies. Advancements in genomics and molecular biology technologies are enabling the development of more sophisticated and accurate diagnostic tests. Government initiatives and funding programs supporting research and development in personalized medicine are fostering innovation. Finally, the increasing adoption of targeted therapies requires reliable companion diagnostics to identify patients most likely to benefit.
Challenges in the Companion Diagnostics Industry Sector
The companion diagnostics industry faces several challenges, including high development costs, stringent regulatory requirements, and the need for skilled professionals. Supply chain disruptions can also affect the availability and affordability of diagnostic tests. Furthermore, the competitive landscape is intense, with established players and emerging companies vying for market share. The reimbursement landscape also presents challenges, as insurers may not always cover the costs of all companion diagnostic tests. These factors can hinder market growth and profitability. The estimated impact of these challenges on market growth is a reduction in the CAGR by approximately xx%.
Leading Players in the Companion Diagnostics Industry Market
- Myriad Genetics Inc
- Biomerieux
- Guardant Health Inc
- Abnova Corporation
- Almac Group
- Thermo Fisher Scientific Inc
- F Hoffmann-La Roche Ltd
- Siemens Healthineers AG
- Agilent Technologies Inc
- Abbott
- Qiagen NV
- Sysmex Corporation
- Illumina Inc
- Biogenex Laboratories Inc
- Danaher Corporation (Beckman Coulter Inc)
Key Developments in Companion Diagnostics Industry Sector
- April 2024: Roche received CE Mark approval for the VENTANA HER2 (4B5) Rabbit Monoclonal Primary Antibody RxDx, expanding treatment options for metastatic breast cancer patients. This development significantly impacts the market by providing a more precise diagnostic tool for HER2-low breast cancer, leading to increased adoption of targeted therapies.
- April 2024: Transcenta Holding Limited and Agilent Technologies collaborated to develop a Claudin18.2 companion diagnostic, supporting the global Phase III trial of Osemitamab. This collaboration highlights the increasing importance of partnerships in the companion diagnostics space and showcases the expansion into new cancer types.
- February 2024: Roche's agreement with PathAI to develop AI-enabled digital pathology algorithms demonstrates the growing integration of artificial intelligence in companion diagnostics, promising increased accuracy and efficiency. This partnership positions Roche as a leader in the innovative use of AI within the field.
Strategic Companion Diagnostics Industry Market Outlook
The companion diagnostics market is poised for continued growth, driven by technological advancements, expanding applications, and the increasing demand for personalized medicine. Strategic opportunities exist for companies focused on developing innovative diagnostic tests, integrating AI and machine learning capabilities, and expanding into emerging markets. The market's future success depends on overcoming regulatory hurdles, managing costs, and fostering collaboration between diagnostic companies and pharmaceutical firms to bring more precise and accessible diagnostic tools to patients. The long-term outlook remains positive, with significant potential for market expansion and the development of transformative diagnostic technologies.
Companion Diagnostics Industry Segmentation
-
1. Technology
- 1.1. Immunohistochemistry (IHC)
- 1.2. Polymerase Chain Reaction (PCR)
- 1.3. In-situ Hybridization (ISH)
- 1.4. Real-time PCR (RT-PCR)
- 1.5. Gene Sequencing
- 1.6. Other Technologies
-
2. Indication
- 2.1. Lung Cancer
- 2.2. Breast Cancer
- 2.3. Colorectal Cancer
- 2.4. Leukemia
- 2.5. Melanoma
- 2.6. Other Indications
Companion Diagnostics Industry Segmentation By Geography
-
1. North America
- 1.1. United States
- 1.2. Canada
- 1.3. Mexico
-
2. Europe
- 2.1. Germany
- 2.2. United Kingdom
- 2.3. France
- 2.4. Italy
- 2.5. Spain
- 2.6. Rest of Europe
-
3. Asia Pacific
- 3.1. China
- 3.2. Japan
- 3.3. India
- 3.4. Australia
- 3.5. South Korea
- 3.6. Rest of Asia Pacific
-
4. Middle East and Africa
- 4.1. GCC
- 4.2. South Africa
- 4.3. Rest of Middle East and Africa
-
5. South America
- 5.1. Brazil
- 5.2. Argentina
- 5.3. Rest of South America
Companion Diagnostics Industry REPORT HIGHLIGHTS
| Aspects | Details |
|---|---|
| Study Period | 2019-2033 |
| Base Year | 2024 |
| Estimated Year | 2025 |
| Forecast Period | 2025-2033 |
| Historical Period | 2019-2024 |
| Growth Rate | CAGR of 12.54% from 2019-2033 |
| Segmentation |
|
Table of Contents
- 1. Introduction
- 1.1. Research Scope
- 1.2. Market Segmentation
- 1.3. Research Methodology
- 1.4. Definitions and Assumptions
- 2. Executive Summary
- 2.1. Introduction
- 3. Market Dynamics
- 3.1. Introduction
- 3.2. Market Drivers
- 3.2.1. Companies Promoting Personalized Medicine and Targeted Therapy as a New Treatment Option; Increasing Cases of Adverse Drug Reactions; Co-development of Drug and Diagnostic Technologies
- 3.3. Market Restrains
- 3.3.1. High Cost of Drug Development and Associated Clinical Trials; Reimbursement Issues Among Many Countries
- 3.4. Market Trends
- 3.4.1. The Lung Cancer Segment is Expected to Witness Significant Growth Over the Forecast Period
- 4. Market Factor Analysis
- 4.1. Porters Five Forces
- 4.2. Supply/Value Chain
- 4.3. PESTEL analysis
- 4.4. Market Entropy
- 4.5. Patent/Trademark Analysis
- 5. Global Companion Diagnostics Industry Analysis, Insights and Forecast, 2019-2031
- 5.1. Market Analysis, Insights and Forecast - by Technology
- 5.1.1. Immunohistochemistry (IHC)
- 5.1.2. Polymerase Chain Reaction (PCR)
- 5.1.3. In-situ Hybridization (ISH)
- 5.1.4. Real-time PCR (RT-PCR)
- 5.1.5. Gene Sequencing
- 5.1.6. Other Technologies
- 5.2. Market Analysis, Insights and Forecast - by Indication
- 5.2.1. Lung Cancer
- 5.2.2. Breast Cancer
- 5.2.3. Colorectal Cancer
- 5.2.4. Leukemia
- 5.2.5. Melanoma
- 5.2.6. Other Indications
- 5.3. Market Analysis, Insights and Forecast - by Region
- 5.3.1. North America
- 5.3.2. Europe
- 5.3.3. Asia Pacific
- 5.3.4. Middle East and Africa
- 5.3.5. South America
- 5.1. Market Analysis, Insights and Forecast - by Technology
- 6. North America Companion Diagnostics Industry Analysis, Insights and Forecast, 2019-2031
- 6.1. Market Analysis, Insights and Forecast - by Technology
- 6.1.1. Immunohistochemistry (IHC)
- 6.1.2. Polymerase Chain Reaction (PCR)
- 6.1.3. In-situ Hybridization (ISH)
- 6.1.4. Real-time PCR (RT-PCR)
- 6.1.5. Gene Sequencing
- 6.1.6. Other Technologies
- 6.2. Market Analysis, Insights and Forecast - by Indication
- 6.2.1. Lung Cancer
- 6.2.2. Breast Cancer
- 6.2.3. Colorectal Cancer
- 6.2.4. Leukemia
- 6.2.5. Melanoma
- 6.2.6. Other Indications
- 6.1. Market Analysis, Insights and Forecast - by Technology
- 7. Europe Companion Diagnostics Industry Analysis, Insights and Forecast, 2019-2031
- 7.1. Market Analysis, Insights and Forecast - by Technology
- 7.1.1. Immunohistochemistry (IHC)
- 7.1.2. Polymerase Chain Reaction (PCR)
- 7.1.3. In-situ Hybridization (ISH)
- 7.1.4. Real-time PCR (RT-PCR)
- 7.1.5. Gene Sequencing
- 7.1.6. Other Technologies
- 7.2. Market Analysis, Insights and Forecast - by Indication
- 7.2.1. Lung Cancer
- 7.2.2. Breast Cancer
- 7.2.3. Colorectal Cancer
- 7.2.4. Leukemia
- 7.2.5. Melanoma
- 7.2.6. Other Indications
- 7.1. Market Analysis, Insights and Forecast - by Technology
- 8. Asia Pacific Companion Diagnostics Industry Analysis, Insights and Forecast, 2019-2031
- 8.1. Market Analysis, Insights and Forecast - by Technology
- 8.1.1. Immunohistochemistry (IHC)
- 8.1.2. Polymerase Chain Reaction (PCR)
- 8.1.3. In-situ Hybridization (ISH)
- 8.1.4. Real-time PCR (RT-PCR)
- 8.1.5. Gene Sequencing
- 8.1.6. Other Technologies
- 8.2. Market Analysis, Insights and Forecast - by Indication
- 8.2.1. Lung Cancer
- 8.2.2. Breast Cancer
- 8.2.3. Colorectal Cancer
- 8.2.4. Leukemia
- 8.2.5. Melanoma
- 8.2.6. Other Indications
- 8.1. Market Analysis, Insights and Forecast - by Technology
- 9. Middle East and Africa Companion Diagnostics Industry Analysis, Insights and Forecast, 2019-2031
- 9.1. Market Analysis, Insights and Forecast - by Technology
- 9.1.1. Immunohistochemistry (IHC)
- 9.1.2. Polymerase Chain Reaction (PCR)
- 9.1.3. In-situ Hybridization (ISH)
- 9.1.4. Real-time PCR (RT-PCR)
- 9.1.5. Gene Sequencing
- 9.1.6. Other Technologies
- 9.2. Market Analysis, Insights and Forecast - by Indication
- 9.2.1. Lung Cancer
- 9.2.2. Breast Cancer
- 9.2.3. Colorectal Cancer
- 9.2.4. Leukemia
- 9.2.5. Melanoma
- 9.2.6. Other Indications
- 9.1. Market Analysis, Insights and Forecast - by Technology
- 10. South America Companion Diagnostics Industry Analysis, Insights and Forecast, 2019-2031
- 10.1. Market Analysis, Insights and Forecast - by Technology
- 10.1.1. Immunohistochemistry (IHC)
- 10.1.2. Polymerase Chain Reaction (PCR)
- 10.1.3. In-situ Hybridization (ISH)
- 10.1.4. Real-time PCR (RT-PCR)
- 10.1.5. Gene Sequencing
- 10.1.6. Other Technologies
- 10.2. Market Analysis, Insights and Forecast - by Indication
- 10.2.1. Lung Cancer
- 10.2.2. Breast Cancer
- 10.2.3. Colorectal Cancer
- 10.2.4. Leukemia
- 10.2.5. Melanoma
- 10.2.6. Other Indications
- 10.1. Market Analysis, Insights and Forecast - by Technology
- 11. North America Companion Diagnostics Industry Analysis, Insights and Forecast, 2019-2031
- 11.1. Market Analysis, Insights and Forecast - By Country/Sub-region
- 11.1.1 United States
- 11.1.2 Canada
- 11.1.3 Mexico
- 12. South America Companion Diagnostics Industry Analysis, Insights and Forecast, 2019-2031
- 12.1. Market Analysis, Insights and Forecast - By Country/Sub-region
- 12.1.1 Brazil
- 12.1.2 Mexico
- 12.1.3 Rest of South America
- 13. Europe Companion Diagnostics Industry Analysis, Insights and Forecast, 2019-2031
- 13.1. Market Analysis, Insights and Forecast - By Country/Sub-region
- 13.1.1 United Kingdom
- 13.1.2 Germany
- 13.1.3 France
- 13.1.4 Italy
- 13.1.5 Spain
- 13.1.6 Russia
- 13.1.7 Rest of Europe
- 14. Asia Pacific Companion Diagnostics Industry Analysis, Insights and Forecast, 2019-2031
- 14.1. Market Analysis, Insights and Forecast - By Country/Sub-region
- 14.1.1 China
- 14.1.2 Japan
- 14.1.3 India
- 14.1.4 South Korea
- 14.1.5 Taiwan
- 14.1.6 Australia
- 14.1.7 Rest of Asia-Pacific
- 15. MEA Companion Diagnostics Industry Analysis, Insights and Forecast, 2019-2031
- 15.1. Market Analysis, Insights and Forecast - By Country/Sub-region
- 15.1.1 Middle East
- 15.1.2 Africa
- 16. Competitive Analysis
- 16.1. Global Market Share Analysis 2024
- 16.2. Company Profiles
- 16.2.1 Myriad Genetics Inc
- 16.2.1.1. Overview
- 16.2.1.2. Products
- 16.2.1.3. SWOT Analysis
- 16.2.1.4. Recent Developments
- 16.2.1.5. Financials (Based on Availability)
- 16.2.2 Biomerieux
- 16.2.2.1. Overview
- 16.2.2.2. Products
- 16.2.2.3. SWOT Analysis
- 16.2.2.4. Recent Developments
- 16.2.2.5. Financials (Based on Availability)
- 16.2.3 Guardant Health Inc
- 16.2.3.1. Overview
- 16.2.3.2. Products
- 16.2.3.3. SWOT Analysis
- 16.2.3.4. Recent Developments
- 16.2.3.5. Financials (Based on Availability)
- 16.2.4 Abnova Corporation
- 16.2.4.1. Overview
- 16.2.4.2. Products
- 16.2.4.3. SWOT Analysis
- 16.2.4.4. Recent Developments
- 16.2.4.5. Financials (Based on Availability)
- 16.2.5 Almac Group
- 16.2.5.1. Overview
- 16.2.5.2. Products
- 16.2.5.3. SWOT Analysis
- 16.2.5.4. Recent Developments
- 16.2.5.5. Financials (Based on Availability)
- 16.2.6 Thermo Fisher Scientific Inc
- 16.2.6.1. Overview
- 16.2.6.2. Products
- 16.2.6.3. SWOT Analysis
- 16.2.6.4. Recent Developments
- 16.2.6.5. Financials (Based on Availability)
- 16.2.7 F Hoffmann-La Roche Ltd
- 16.2.7.1. Overview
- 16.2.7.2. Products
- 16.2.7.3. SWOT Analysis
- 16.2.7.4. Recent Developments
- 16.2.7.5. Financials (Based on Availability)
- 16.2.8 Siemens Healthineers AG
- 16.2.8.1. Overview
- 16.2.8.2. Products
- 16.2.8.3. SWOT Analysis
- 16.2.8.4. Recent Developments
- 16.2.8.5. Financials (Based on Availability)
- 16.2.9 Agilent Technologies Inc
- 16.2.9.1. Overview
- 16.2.9.2. Products
- 16.2.9.3. SWOT Analysis
- 16.2.9.4. Recent Developments
- 16.2.9.5. Financials (Based on Availability)
- 16.2.10 Abbott
- 16.2.10.1. Overview
- 16.2.10.2. Products
- 16.2.10.3. SWOT Analysis
- 16.2.10.4. Recent Developments
- 16.2.10.5. Financials (Based on Availability)
- 16.2.11 Qiagen NV
- 16.2.11.1. Overview
- 16.2.11.2. Products
- 16.2.11.3. SWOT Analysis
- 16.2.11.4. Recent Developments
- 16.2.11.5. Financials (Based on Availability)
- 16.2.12 Sysmex Corporation
- 16.2.12.1. Overview
- 16.2.12.2. Products
- 16.2.12.3. SWOT Analysis
- 16.2.12.4. Recent Developments
- 16.2.12.5. Financials (Based on Availability)
- 16.2.13 Illumina Inc
- 16.2.13.1. Overview
- 16.2.13.2. Products
- 16.2.13.3. SWOT Analysis
- 16.2.13.4. Recent Developments
- 16.2.13.5. Financials (Based on Availability)
- 16.2.14 Biogenex Laboratories Inc *List Not Exhaustive
- 16.2.14.1. Overview
- 16.2.14.2. Products
- 16.2.14.3. SWOT Analysis
- 16.2.14.4. Recent Developments
- 16.2.14.5. Financials (Based on Availability)
- 16.2.15 Danaher Corporation (Beckman Coulter Inc )
- 16.2.15.1. Overview
- 16.2.15.2. Products
- 16.2.15.3. SWOT Analysis
- 16.2.15.4. Recent Developments
- 16.2.15.5. Financials (Based on Availability)
- 16.2.1 Myriad Genetics Inc
List of Figures
- Figure 1: Global Companion Diagnostics Industry Revenue Breakdown (Million, %) by Region 2024 & 2032
- Figure 2: North America Companion Diagnostics Industry Revenue (Million), by Country 2024 & 2032
- Figure 3: North America Companion Diagnostics Industry Revenue Share (%), by Country 2024 & 2032
- Figure 4: South America Companion Diagnostics Industry Revenue (Million), by Country 2024 & 2032
- Figure 5: South America Companion Diagnostics Industry Revenue Share (%), by Country 2024 & 2032
- Figure 6: Europe Companion Diagnostics Industry Revenue (Million), by Country 2024 & 2032
- Figure 7: Europe Companion Diagnostics Industry Revenue Share (%), by Country 2024 & 2032
- Figure 8: Asia Pacific Companion Diagnostics Industry Revenue (Million), by Country 2024 & 2032
- Figure 9: Asia Pacific Companion Diagnostics Industry Revenue Share (%), by Country 2024 & 2032
- Figure 10: MEA Companion Diagnostics Industry Revenue (Million), by Country 2024 & 2032
- Figure 11: MEA Companion Diagnostics Industry Revenue Share (%), by Country 2024 & 2032
- Figure 12: North America Companion Diagnostics Industry Revenue (Million), by Technology 2024 & 2032
- Figure 13: North America Companion Diagnostics Industry Revenue Share (%), by Technology 2024 & 2032
- Figure 14: North America Companion Diagnostics Industry Revenue (Million), by Indication 2024 & 2032
- Figure 15: North America Companion Diagnostics Industry Revenue Share (%), by Indication 2024 & 2032
- Figure 16: North America Companion Diagnostics Industry Revenue (Million), by Country 2024 & 2032
- Figure 17: North America Companion Diagnostics Industry Revenue Share (%), by Country 2024 & 2032
- Figure 18: Europe Companion Diagnostics Industry Revenue (Million), by Technology 2024 & 2032
- Figure 19: Europe Companion Diagnostics Industry Revenue Share (%), by Technology 2024 & 2032
- Figure 20: Europe Companion Diagnostics Industry Revenue (Million), by Indication 2024 & 2032
- Figure 21: Europe Companion Diagnostics Industry Revenue Share (%), by Indication 2024 & 2032
- Figure 22: Europe Companion Diagnostics Industry Revenue (Million), by Country 2024 & 2032
- Figure 23: Europe Companion Diagnostics Industry Revenue Share (%), by Country 2024 & 2032
- Figure 24: Asia Pacific Companion Diagnostics Industry Revenue (Million), by Technology 2024 & 2032
- Figure 25: Asia Pacific Companion Diagnostics Industry Revenue Share (%), by Technology 2024 & 2032
- Figure 26: Asia Pacific Companion Diagnostics Industry Revenue (Million), by Indication 2024 & 2032
- Figure 27: Asia Pacific Companion Diagnostics Industry Revenue Share (%), by Indication 2024 & 2032
- Figure 28: Asia Pacific Companion Diagnostics Industry Revenue (Million), by Country 2024 & 2032
- Figure 29: Asia Pacific Companion Diagnostics Industry Revenue Share (%), by Country 2024 & 2032
- Figure 30: Middle East and Africa Companion Diagnostics Industry Revenue (Million), by Technology 2024 & 2032
- Figure 31: Middle East and Africa Companion Diagnostics Industry Revenue Share (%), by Technology 2024 & 2032
- Figure 32: Middle East and Africa Companion Diagnostics Industry Revenue (Million), by Indication 2024 & 2032
- Figure 33: Middle East and Africa Companion Diagnostics Industry Revenue Share (%), by Indication 2024 & 2032
- Figure 34: Middle East and Africa Companion Diagnostics Industry Revenue (Million), by Country 2024 & 2032
- Figure 35: Middle East and Africa Companion Diagnostics Industry Revenue Share (%), by Country 2024 & 2032
- Figure 36: South America Companion Diagnostics Industry Revenue (Million), by Technology 2024 & 2032
- Figure 37: South America Companion Diagnostics Industry Revenue Share (%), by Technology 2024 & 2032
- Figure 38: South America Companion Diagnostics Industry Revenue (Million), by Indication 2024 & 2032
- Figure 39: South America Companion Diagnostics Industry Revenue Share (%), by Indication 2024 & 2032
- Figure 40: South America Companion Diagnostics Industry Revenue (Million), by Country 2024 & 2032
- Figure 41: South America Companion Diagnostics Industry Revenue Share (%), by Country 2024 & 2032
List of Tables
- Table 1: Global Companion Diagnostics Industry Revenue Million Forecast, by Region 2019 & 2032
- Table 2: Global Companion Diagnostics Industry Revenue Million Forecast, by Technology 2019 & 2032
- Table 3: Global Companion Diagnostics Industry Revenue Million Forecast, by Indication 2019 & 2032
- Table 4: Global Companion Diagnostics Industry Revenue Million Forecast, by Region 2019 & 2032
- Table 5: Global Companion Diagnostics Industry Revenue Million Forecast, by Country 2019 & 2032
- Table 6: United States Companion Diagnostics Industry Revenue (Million) Forecast, by Application 2019 & 2032
- Table 7: Canada Companion Diagnostics Industry Revenue (Million) Forecast, by Application 2019 & 2032
- Table 8: Mexico Companion Diagnostics Industry Revenue (Million) Forecast, by Application 2019 & 2032
- Table 9: Global Companion Diagnostics Industry Revenue Million Forecast, by Country 2019 & 2032
- Table 10: Brazil Companion Diagnostics Industry Revenue (Million) Forecast, by Application 2019 & 2032
- Table 11: Mexico Companion Diagnostics Industry Revenue (Million) Forecast, by Application 2019 & 2032
- Table 12: Rest of South America Companion Diagnostics Industry Revenue (Million) Forecast, by Application 2019 & 2032
- Table 13: Global Companion Diagnostics Industry Revenue Million Forecast, by Country 2019 & 2032
- Table 14: United Kingdom Companion Diagnostics Industry Revenue (Million) Forecast, by Application 2019 & 2032
- Table 15: Germany Companion Diagnostics Industry Revenue (Million) Forecast, by Application 2019 & 2032
- Table 16: France Companion Diagnostics Industry Revenue (Million) Forecast, by Application 2019 & 2032
- Table 17: Italy Companion Diagnostics Industry Revenue (Million) Forecast, by Application 2019 & 2032
- Table 18: Spain Companion Diagnostics Industry Revenue (Million) Forecast, by Application 2019 & 2032
- Table 19: Russia Companion Diagnostics Industry Revenue (Million) Forecast, by Application 2019 & 2032
- Table 20: Rest of Europe Companion Diagnostics Industry Revenue (Million) Forecast, by Application 2019 & 2032
- Table 21: Global Companion Diagnostics Industry Revenue Million Forecast, by Country 2019 & 2032
- Table 22: China Companion Diagnostics Industry Revenue (Million) Forecast, by Application 2019 & 2032
- Table 23: Japan Companion Diagnostics Industry Revenue (Million) Forecast, by Application 2019 & 2032
- Table 24: India Companion Diagnostics Industry Revenue (Million) Forecast, by Application 2019 & 2032
- Table 25: South Korea Companion Diagnostics Industry Revenue (Million) Forecast, by Application 2019 & 2032
- Table 26: Taiwan Companion Diagnostics Industry Revenue (Million) Forecast, by Application 2019 & 2032
- Table 27: Australia Companion Diagnostics Industry Revenue (Million) Forecast, by Application 2019 & 2032
- Table 28: Rest of Asia-Pacific Companion Diagnostics Industry Revenue (Million) Forecast, by Application 2019 & 2032
- Table 29: Global Companion Diagnostics Industry Revenue Million Forecast, by Country 2019 & 2032
- Table 30: Middle East Companion Diagnostics Industry Revenue (Million) Forecast, by Application 2019 & 2032
- Table 31: Africa Companion Diagnostics Industry Revenue (Million) Forecast, by Application 2019 & 2032
- Table 32: Global Companion Diagnostics Industry Revenue Million Forecast, by Technology 2019 & 2032
- Table 33: Global Companion Diagnostics Industry Revenue Million Forecast, by Indication 2019 & 2032
- Table 34: Global Companion Diagnostics Industry Revenue Million Forecast, by Country 2019 & 2032
- Table 35: United States Companion Diagnostics Industry Revenue (Million) Forecast, by Application 2019 & 2032
- Table 36: Canada Companion Diagnostics Industry Revenue (Million) Forecast, by Application 2019 & 2032
- Table 37: Mexico Companion Diagnostics Industry Revenue (Million) Forecast, by Application 2019 & 2032
- Table 38: Global Companion Diagnostics Industry Revenue Million Forecast, by Technology 2019 & 2032
- Table 39: Global Companion Diagnostics Industry Revenue Million Forecast, by Indication 2019 & 2032
- Table 40: Global Companion Diagnostics Industry Revenue Million Forecast, by Country 2019 & 2032
- Table 41: Germany Companion Diagnostics Industry Revenue (Million) Forecast, by Application 2019 & 2032
- Table 42: United Kingdom Companion Diagnostics Industry Revenue (Million) Forecast, by Application 2019 & 2032
- Table 43: France Companion Diagnostics Industry Revenue (Million) Forecast, by Application 2019 & 2032
- Table 44: Italy Companion Diagnostics Industry Revenue (Million) Forecast, by Application 2019 & 2032
- Table 45: Spain Companion Diagnostics Industry Revenue (Million) Forecast, by Application 2019 & 2032
- Table 46: Rest of Europe Companion Diagnostics Industry Revenue (Million) Forecast, by Application 2019 & 2032
- Table 47: Global Companion Diagnostics Industry Revenue Million Forecast, by Technology 2019 & 2032
- Table 48: Global Companion Diagnostics Industry Revenue Million Forecast, by Indication 2019 & 2032
- Table 49: Global Companion Diagnostics Industry Revenue Million Forecast, by Country 2019 & 2032
- Table 50: China Companion Diagnostics Industry Revenue (Million) Forecast, by Application 2019 & 2032
- Table 51: Japan Companion Diagnostics Industry Revenue (Million) Forecast, by Application 2019 & 2032
- Table 52: India Companion Diagnostics Industry Revenue (Million) Forecast, by Application 2019 & 2032
- Table 53: Australia Companion Diagnostics Industry Revenue (Million) Forecast, by Application 2019 & 2032
- Table 54: South Korea Companion Diagnostics Industry Revenue (Million) Forecast, by Application 2019 & 2032
- Table 55: Rest of Asia Pacific Companion Diagnostics Industry Revenue (Million) Forecast, by Application 2019 & 2032
- Table 56: Global Companion Diagnostics Industry Revenue Million Forecast, by Technology 2019 & 2032
- Table 57: Global Companion Diagnostics Industry Revenue Million Forecast, by Indication 2019 & 2032
- Table 58: Global Companion Diagnostics Industry Revenue Million Forecast, by Country 2019 & 2032
- Table 59: GCC Companion Diagnostics Industry Revenue (Million) Forecast, by Application 2019 & 2032
- Table 60: South Africa Companion Diagnostics Industry Revenue (Million) Forecast, by Application 2019 & 2032
- Table 61: Rest of Middle East and Africa Companion Diagnostics Industry Revenue (Million) Forecast, by Application 2019 & 2032
- Table 62: Global Companion Diagnostics Industry Revenue Million Forecast, by Technology 2019 & 2032
- Table 63: Global Companion Diagnostics Industry Revenue Million Forecast, by Indication 2019 & 2032
- Table 64: Global Companion Diagnostics Industry Revenue Million Forecast, by Country 2019 & 2032
- Table 65: Brazil Companion Diagnostics Industry Revenue (Million) Forecast, by Application 2019 & 2032
- Table 66: Argentina Companion Diagnostics Industry Revenue (Million) Forecast, by Application 2019 & 2032
- Table 67: Rest of South America Companion Diagnostics Industry Revenue (Million) Forecast, by Application 2019 & 2032
Frequently Asked Questions
1. What is the projected Compound Annual Growth Rate (CAGR) of the Companion Diagnostics Industry?
The projected CAGR is approximately 12.54%.
2. Which companies are prominent players in the Companion Diagnostics Industry?
Key companies in the market include Myriad Genetics Inc, Biomerieux, Guardant Health Inc, Abnova Corporation, Almac Group, Thermo Fisher Scientific Inc, F Hoffmann-La Roche Ltd, Siemens Healthineers AG, Agilent Technologies Inc, Abbott, Qiagen NV, Sysmex Corporation, Illumina Inc, Biogenex Laboratories Inc *List Not Exhaustive, Danaher Corporation (Beckman Coulter Inc ).
3. What are the main segments of the Companion Diagnostics Industry?
The market segments include Technology, Indication.
4. Can you provide details about the market size?
The market size is estimated to be USD 7.74 Million as of 2022.
5. What are some drivers contributing to market growth?
Companies Promoting Personalized Medicine and Targeted Therapy as a New Treatment Option; Increasing Cases of Adverse Drug Reactions; Co-development of Drug and Diagnostic Technologies.
6. What are the notable trends driving market growth?
The Lung Cancer Segment is Expected to Witness Significant Growth Over the Forecast Period.
7. Are there any restraints impacting market growth?
High Cost of Drug Development and Associated Clinical Trials; Reimbursement Issues Among Many Countries.
8. Can you provide examples of recent developments in the market?
April 2024: Roche received approval of the CE Mark for the VENTANA HER2 (4B5) Rabbit Monoclonal Primary Antibody RxDx to identify metastatic breast cancer patients with low HER2 expression who can be given ENHERTU (trastuzumab deruxtecan) as a targeted treatment.
9. What pricing options are available for accessing the report?
Pricing options include single-user, multi-user, and enterprise licenses priced at USD 4750, USD 5250, and USD 8750 respectively.
10. Is the market size provided in terms of value or volume?
The market size is provided in terms of value, measured in Million.
11. Are there any specific market keywords associated with the report?
Yes, the market keyword associated with the report is "Companion Diagnostics Industry," which aids in identifying and referencing the specific market segment covered.
12. How do I determine which pricing option suits my needs best?
The pricing options vary based on user requirements and access needs. Individual users may opt for single-user licenses, while businesses requiring broader access may choose multi-user or enterprise licenses for cost-effective access to the report.
13. Are there any additional resources or data provided in the Companion Diagnostics Industry report?
While the report offers comprehensive insights, it's advisable to review the specific contents or supplementary materials provided to ascertain if additional resources or data are available.
14. How can I stay updated on further developments or reports in the Companion Diagnostics Industry?
To stay informed about further developments, trends, and reports in the Companion Diagnostics Industry, consider subscribing to industry newsletters, following relevant companies and organizations, or regularly checking reputable industry news sources and publications.
Methodology
Step 1 - Identification of Relevant Samples Size from Population Database


Step 2 - Approaches for Defining Global Market Size (Value, Volume* & Price*)

Note*: In applicable scenarios
Step 3 - Data Sources
Primary Research
- Web Analytics
- Survey Reports
- Research Institute
- Latest Research Reports
- Opinion Leaders
Secondary Research
- Annual Reports
- White Paper
- Latest Press Release
- Industry Association
- Paid Database
- Investor Presentations

Step 4 - Data Triangulation
Involves using different sources of information in order to increase the validity of a study
These sources are likely to be stakeholders in a program - participants, other researchers, program staff, other community members, and so on.
Then we put all data in single framework & apply various statistical tools to find out the dynamic on the market.
During the analysis stage, feedback from the stakeholder groups would be compared to determine areas of agreement as well as areas of divergence


