
Key Insights
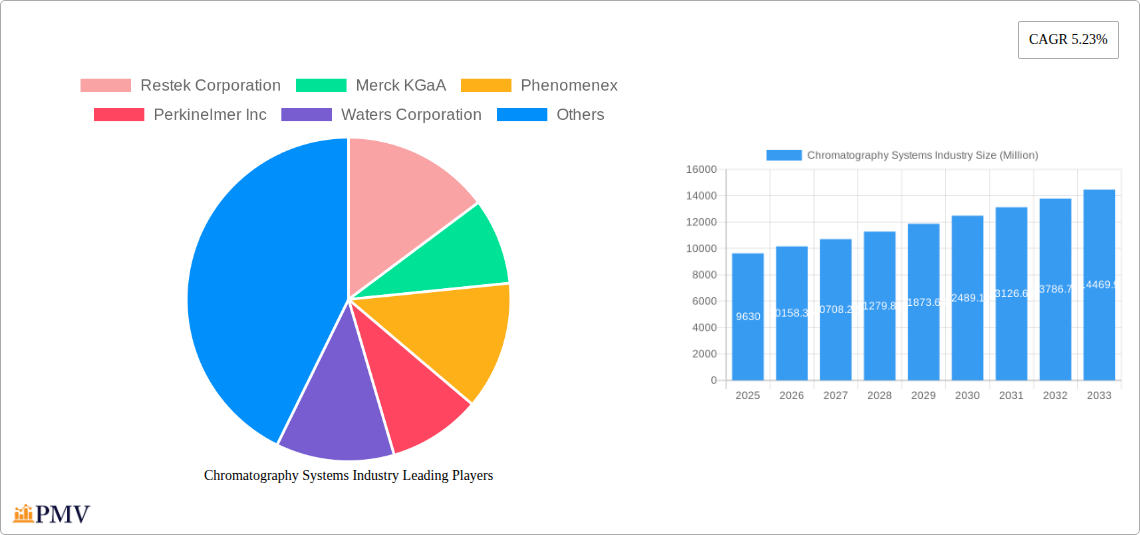
The Chromatography Systems market, valued at $9.63 billion in 2025, is projected to experience robust growth, driven by a Compound Annual Growth Rate (CAGR) of 5.23% from 2025 to 2033. This expansion is fueled by several key factors. The increasing demand for advanced analytical techniques in pharmaceutical research and development is a primary driver, as chromatography plays a crucial role in drug discovery, quality control, and impurity analysis. Furthermore, the growing prevalence of chronic diseases globally is stimulating the need for sophisticated diagnostic tools, further boosting the market for chromatography systems in clinical research and diagnostics. Stringent environmental regulations are also contributing to market growth, necessitating accurate and reliable environmental testing methodologies where chromatography plays a pivotal role. Technological advancements, such as the development of faster, more efficient, and miniaturized chromatography systems, are enhancing analytical capabilities and broadening application areas. The segment encompassing consumables consistently demonstrates high demand due to the continuous requirement of replacement columns, solvents, and other materials for ongoing chromatographic analyses.
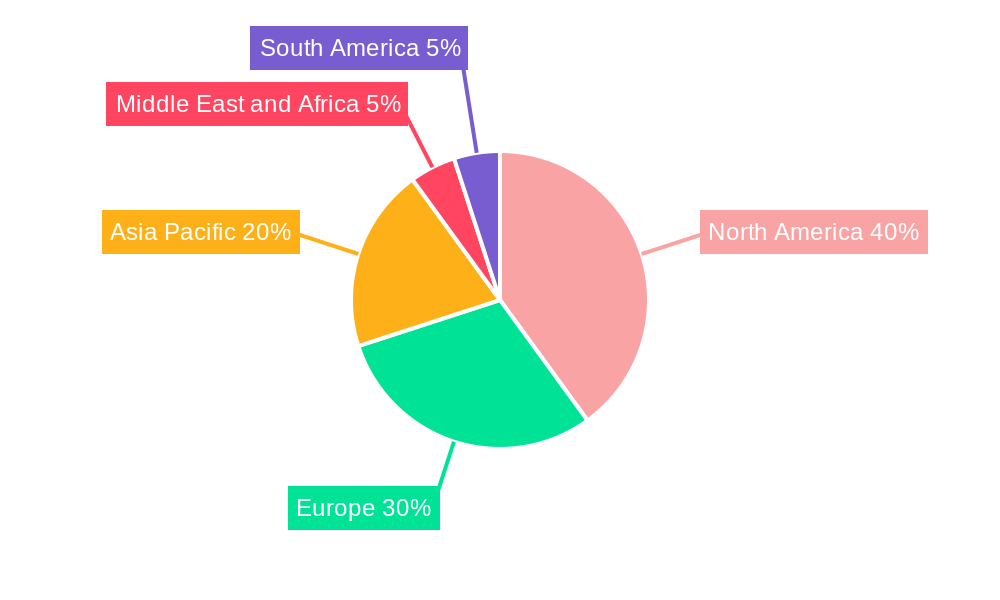
The market's geographical landscape reveals North America as a significant revenue contributor, benefiting from a strong presence of pharmaceutical and biotechnology companies along with robust research infrastructure. However, the Asia-Pacific region is anticipated to demonstrate substantial growth, driven by increasing healthcare spending and expanding research activities in countries like China and India. Competitive dynamics are shaped by the presence of both established industry giants and specialized niche players. Major companies such as Thermo Fisher Scientific, Agilent Technologies, and Waters Corporation are leading the market, offering comprehensive portfolios of chromatography systems and associated services. Nevertheless, smaller companies focused on innovative technologies and specialized applications are emerging and contributing to market diversification. While some challenges exist, such as the high cost of advanced systems and the need for skilled technicians, the overall market outlook remains positive, reflecting a significant expansion potential over the forecast period.
Chromatography Systems Industry: A Comprehensive Market Report (2019-2033)
This in-depth report provides a comprehensive analysis of the Chromatography Systems industry, offering invaluable insights for stakeholders seeking to understand market dynamics, competitive landscapes, and future growth trajectories. Covering the period from 2019 to 2033, with a focus on 2025, this report is an essential resource for strategic decision-making. The global Chromatography Systems market is projected to reach xx Million by 2033, exhibiting a CAGR of xx% during the forecast period (2025-2033).
Chromatography Systems Industry Market Structure & Competitive Dynamics
The Chromatography Systems market is characterized by a moderately concentrated structure, with key players like Waters Corporation, Thermo Fisher Scientific, Agilent Technologies, Shimadzu Corporation, and Merck KGaA holding significant market share. The combined market share of the top five players is estimated at xx%. The industry witnesses continuous innovation, driven by advancements in separation techniques, detection technologies, and software integration. Regulatory frameworks, particularly those concerning pharmaceutical and environmental testing, heavily influence market dynamics. Product substitutes, such as electrophoresis and mass spectrometry, exist but often lack the versatility and sensitivity of chromatography. End-user trends show a shift towards high-throughput, automated systems and a growing demand for specialized applications in areas like proteomics and metabolomics. M&A activity has been moderate, with deals primarily focused on expanding product portfolios and geographical reach. Recent M&A deal values totaled approximately xx Million in the past five years.
- Market Concentration: High, with top 5 players holding xx% market share.
- Innovation: Focused on automation, high-throughput, and specialized applications.
- Regulatory Landscape: Significant impact from pharmaceutical and environmental regulations.
- Substitutes: Electrophoresis, mass spectrometry, offering limited competition.
- End-User Trends: Demand for automation, specialized applications, and data analytics.
- M&A Activity: Moderate, with deals valued at approximately xx Million in recent years.
Chromatography Systems Industry Trends & Insights
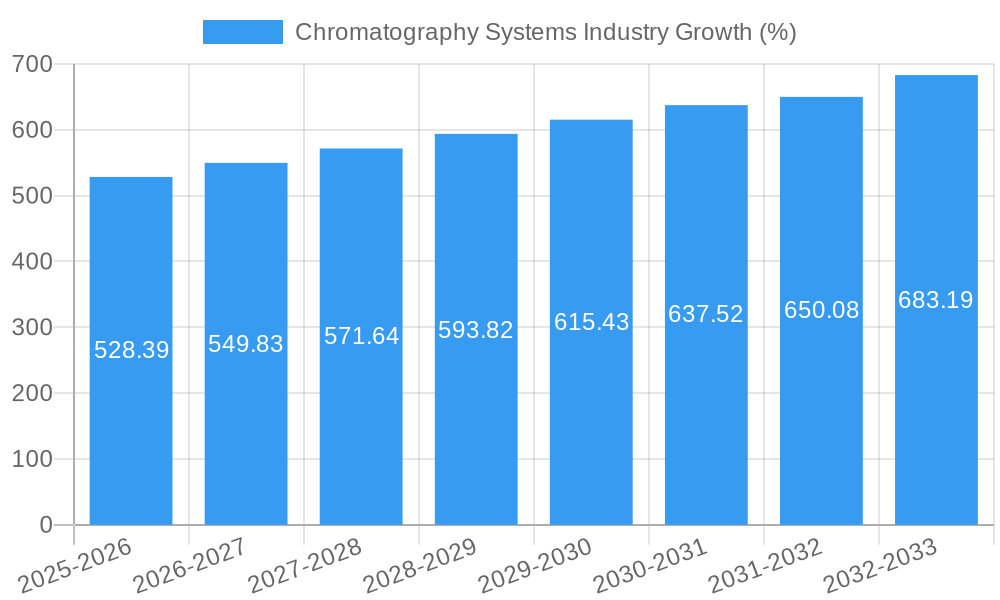
The Chromatography Systems market is experiencing robust growth, driven by several factors. The increasing demand for sophisticated analytical techniques in pharmaceutical development, environmental monitoring, and food safety testing is a primary driver. Technological advancements, such as the integration of mass spectrometry and improved detection sensitivity, are enhancing the capabilities of chromatography systems, leading to higher market penetration. Consumer preferences are increasingly leaning towards integrated solutions, user-friendly interfaces, and enhanced data analysis capabilities. Competitive dynamics are marked by continuous innovation, strategic partnerships, and geographic expansion. The market exhibits a strong growth trajectory, with a projected CAGR of xx% during the forecast period (2025-2033). Market penetration in emerging economies is anticipated to increase significantly, driven by rising disposable incomes and improving healthcare infrastructure.
Dominant Markets & Segments in Chromatography Systems Industry
The pharmaceutical industry represents the largest application segment, accounting for xx% of the market in 2025. North America and Europe dominate the market in terms of revenue, driven by robust research and development activities, stringent regulatory compliance, and a high concentration of pharmaceutical and clinical research organizations.
Key Drivers for Dominant Segments:
- Pharmaceutical Firms: Stringent regulatory requirements, high R&D spending.
- Clinical Research Organizations (CROs): Growing outsourcing trends, increasing clinical trials.
- Environmental Testing: Rising environmental awareness, stringent regulations.
- North America & Europe: High R&D investments, advanced healthcare infrastructure.
Dominance Analysis:
North America and Europe maintain their leading positions due to advanced research infrastructure, high disposable incomes, stringent regulatory environments and the strong presence of key players and end-users. However, the Asia-Pacific region is exhibiting the fastest growth rate, driven by expanding economies and increasing investments in healthcare and environmental monitoring.
- Thin Layer Chromatography (TLC) Systems: Consumables segment is larger due to recurring purchases.
- Other Chromatography Systems: Accessories market growth is linked to the adoption of advanced systems.
- Application: Pharmaceutical firms dominate due to stringent quality control needs.
Chromatography Systems Industry Product Innovations
Recent innovations have focused on miniaturization, increased throughput, improved sensitivity, and enhanced data analysis capabilities. The integration of advanced detection technologies, such as mass spectrometry and advanced software for data processing and interpretation, are transforming the field. This has led to the development of sophisticated systems tailored for specific applications, addressing market needs for improved efficiency and accuracy.
Report Segmentation & Scope
This report segments the Chromatography Systems market based on several factors:
By Device: High-Performance Liquid Chromatography (HPLC), Gas Chromatography (GC), Thin Layer Chromatography (TLC), and other chromatography systems. Growth projections vary significantly across these segments, with HPLC systems maintaining market dominance.
By Application: Pharmaceutical, environmental testing, clinical research, agriculture, food & beverage, and others. The pharmaceutical sector represents the most significant segment.
By Consumables & Accessories: This segment encompasses columns, detectors, solvents, and other accessories. Recurring revenue from consumables drives consistent market growth.
Key Drivers of Chromatography Systems Industry Growth
The industry's growth is driven by several factors:
- Technological advancements: Higher sensitivity detectors, automation and miniaturization.
- Stringent regulatory frameworks: Driving demand for quality control and testing.
- Rising healthcare spending: Increased investments in research & development.
Challenges in the Chromatography Systems Industry Sector
Several challenges hinder market growth:
- High initial investment costs: Restricting adoption in smaller organizations.
- Specialized expertise required: Limiting accessibility for certain users.
- Intense competition: Driving pricing pressure and necessitating innovation.
Leading Players in the Chromatography Systems Industry Market
- Restek Corporation
- Merck KGaA
- Phenomenex
- Perkinelmer Inc
- Waters Corporation
- Cytiva
- Sartorius AG
- Bio-Rad Laboratories
- Gilson Inc
- Thermo Fisher Scientific
- Agilent Technologies
- Shimadzu Corporation
Key Developments in Chromatography Systems Industry Sector
- 2022 Q4: Waters Corporation launched a new HPLC system with enhanced capabilities.
- 2023 Q1: Agilent Technologies announced a strategic partnership to expand its market reach.
- 2023 Q2: Merck KGaA invested xx Million in R&D for improved chromatography columns.
Strategic Chromatography Systems Industry Market Outlook
The Chromatography Systems market is poised for continued expansion, fueled by technological innovations, rising healthcare spending, and stricter regulatory requirements. Strategic opportunities lie in developing specialized systems for niche applications, expanding into emerging markets, and leveraging data analytics to enhance customer experience. Further consolidation through M&A activity is also expected.
Chromatography Systems Industry Segmentation
-
1. Devices
-
1.1. By Chromatography Systems
- 1.1.1. Gas Chromatography Systems
- 1.1.2. Liquid Chromatography Systems
- 1.1.3. Fluid Chromatography Systems
- 1.1.4. Thin Layer Chromatography Systems
-
1.2. By Consumables
- 1.2.1. Columns
- 1.2.2. Solvents/Reagents/Adsorbents
- 1.2.3. Syringes/Needles
- 1.2.4. Others
-
1.3. By Accessories
- 1.3.1. Column Accessories
- 1.3.2. Auto-Sampler Accessories
- 1.3.3. Pumps
- 1.3.4. Other Accessories
-
1.1. By Chromatography Systems
-
2. Application
- 2.1. Agriculture
- 2.2. Pharmaceutical Firms
- 2.3. Clinical Research Organizations
- 2.4. Environmental Testing
Chromatography Systems Industry Segmentation By Geography
-
1. North America
- 1.1. United States
- 1.2. Canada
- 1.3. Mexico
-
2. Europe
- 2.1. Germany
- 2.2. United Kingdom
- 2.3. France
- 2.4. Italy
- 2.5. Spain
- 2.6. Rest of Europe
-
3. Asia Pacific
- 3.1. China
- 3.2. Japan
- 3.3. India
- 3.4. Australia
- 3.5. South Korea
- 3.6. Rest of Asia Pacific
-
4. Middle East and Africa
- 4.1. GCC
- 4.2. South Africa
- 4.3. Rest of Middle East and Africa
-
5. South America
- 5.1. Brazil
- 5.2. Argentina
- 5.3. Rest of South America
Chromatography Systems Industry REPORT HIGHLIGHTS
| Aspects | Details |
|---|---|
| Study Period | 2019-2033 |
| Base Year | 2024 |
| Estimated Year | 2025 |
| Forecast Period | 2025-2033 |
| Historical Period | 2019-2024 |
| Growth Rate | CAGR of 5.23% from 2019-2033 |
| Segmentation |
|
Table of Contents
- 1. Introduction
- 1.1. Research Scope
- 1.2. Market Segmentation
- 1.3. Research Methodology
- 1.4. Definitions and Assumptions
- 2. Executive Summary
- 2.1. Introduction
- 3. Market Dynamics
- 3.1. Introduction
- 3.2. Market Drivers
- 3.2.1. Chromatography Tests in Drug Approval Process; Advancements in Chromatography Equipment; Growing Food Safety Concerns
- 3.3. Market Restrains
- 3.3.1. High Equipment Costs; Lack of Skilled Personnel for Equipment Handling
- 3.4. Market Trends
- 3.4.1. Liquid Chromatography Systems are Expected to Dominate the Chromatography Instrumentation Market
- 4. Market Factor Analysis
- 4.1. Porters Five Forces
- 4.2. Supply/Value Chain
- 4.3. PESTEL analysis
- 4.4. Market Entropy
- 4.5. Patent/Trademark Analysis
- 5. Global Chromatography Systems Industry Analysis, Insights and Forecast, 2019-2031
- 5.1. Market Analysis, Insights and Forecast - by Devices
- 5.1.1. By Chromatography Systems
- 5.1.1.1. Gas Chromatography Systems
- 5.1.1.2. Liquid Chromatography Systems
- 5.1.1.3. Fluid Chromatography Systems
- 5.1.1.4. Thin Layer Chromatography Systems
- 5.1.2. By Consumables
- 5.1.2.1. Columns
- 5.1.2.2. Solvents/Reagents/Adsorbents
- 5.1.2.3. Syringes/Needles
- 5.1.2.4. Others
- 5.1.3. By Accessories
- 5.1.3.1. Column Accessories
- 5.1.3.2. Auto-Sampler Accessories
- 5.1.3.3. Pumps
- 5.1.3.4. Other Accessories
- 5.1.1. By Chromatography Systems
- 5.2. Market Analysis, Insights and Forecast - by Application
- 5.2.1. Agriculture
- 5.2.2. Pharmaceutical Firms
- 5.2.3. Clinical Research Organizations
- 5.2.4. Environmental Testing
- 5.3. Market Analysis, Insights and Forecast - by Region
- 5.3.1. North America
- 5.3.2. Europe
- 5.3.3. Asia Pacific
- 5.3.4. Middle East and Africa
- 5.3.5. South America
- 5.1. Market Analysis, Insights and Forecast - by Devices
- 6. North America Chromatography Systems Industry Analysis, Insights and Forecast, 2019-2031
- 6.1. Market Analysis, Insights and Forecast - by Devices
- 6.1.1. By Chromatography Systems
- 6.1.1.1. Gas Chromatography Systems
- 6.1.1.2. Liquid Chromatography Systems
- 6.1.1.3. Fluid Chromatography Systems
- 6.1.1.4. Thin Layer Chromatography Systems
- 6.1.2. By Consumables
- 6.1.2.1. Columns
- 6.1.2.2. Solvents/Reagents/Adsorbents
- 6.1.2.3. Syringes/Needles
- 6.1.2.4. Others
- 6.1.3. By Accessories
- 6.1.3.1. Column Accessories
- 6.1.3.2. Auto-Sampler Accessories
- 6.1.3.3. Pumps
- 6.1.3.4. Other Accessories
- 6.1.1. By Chromatography Systems
- 6.2. Market Analysis, Insights and Forecast - by Application
- 6.2.1. Agriculture
- 6.2.2. Pharmaceutical Firms
- 6.2.3. Clinical Research Organizations
- 6.2.4. Environmental Testing
- 6.1. Market Analysis, Insights and Forecast - by Devices
- 7. Europe Chromatography Systems Industry Analysis, Insights and Forecast, 2019-2031
- 7.1. Market Analysis, Insights and Forecast - by Devices
- 7.1.1. By Chromatography Systems
- 7.1.1.1. Gas Chromatography Systems
- 7.1.1.2. Liquid Chromatography Systems
- 7.1.1.3. Fluid Chromatography Systems
- 7.1.1.4. Thin Layer Chromatography Systems
- 7.1.2. By Consumables
- 7.1.2.1. Columns
- 7.1.2.2. Solvents/Reagents/Adsorbents
- 7.1.2.3. Syringes/Needles
- 7.1.2.4. Others
- 7.1.3. By Accessories
- 7.1.3.1. Column Accessories
- 7.1.3.2. Auto-Sampler Accessories
- 7.1.3.3. Pumps
- 7.1.3.4. Other Accessories
- 7.1.1. By Chromatography Systems
- 7.2. Market Analysis, Insights and Forecast - by Application
- 7.2.1. Agriculture
- 7.2.2. Pharmaceutical Firms
- 7.2.3. Clinical Research Organizations
- 7.2.4. Environmental Testing
- 7.1. Market Analysis, Insights and Forecast - by Devices
- 8. Asia Pacific Chromatography Systems Industry Analysis, Insights and Forecast, 2019-2031
- 8.1. Market Analysis, Insights and Forecast - by Devices
- 8.1.1. By Chromatography Systems
- 8.1.1.1. Gas Chromatography Systems
- 8.1.1.2. Liquid Chromatography Systems
- 8.1.1.3. Fluid Chromatography Systems
- 8.1.1.4. Thin Layer Chromatography Systems
- 8.1.2. By Consumables
- 8.1.2.1. Columns
- 8.1.2.2. Solvents/Reagents/Adsorbents
- 8.1.2.3. Syringes/Needles
- 8.1.2.4. Others
- 8.1.3. By Accessories
- 8.1.3.1. Column Accessories
- 8.1.3.2. Auto-Sampler Accessories
- 8.1.3.3. Pumps
- 8.1.3.4. Other Accessories
- 8.1.1. By Chromatography Systems
- 8.2. Market Analysis, Insights and Forecast - by Application
- 8.2.1. Agriculture
- 8.2.2. Pharmaceutical Firms
- 8.2.3. Clinical Research Organizations
- 8.2.4. Environmental Testing
- 8.1. Market Analysis, Insights and Forecast - by Devices
- 9. Middle East and Africa Chromatography Systems Industry Analysis, Insights and Forecast, 2019-2031
- 9.1. Market Analysis, Insights and Forecast - by Devices
- 9.1.1. By Chromatography Systems
- 9.1.1.1. Gas Chromatography Systems
- 9.1.1.2. Liquid Chromatography Systems
- 9.1.1.3. Fluid Chromatography Systems
- 9.1.1.4. Thin Layer Chromatography Systems
- 9.1.2. By Consumables
- 9.1.2.1. Columns
- 9.1.2.2. Solvents/Reagents/Adsorbents
- 9.1.2.3. Syringes/Needles
- 9.1.2.4. Others
- 9.1.3. By Accessories
- 9.1.3.1. Column Accessories
- 9.1.3.2. Auto-Sampler Accessories
- 9.1.3.3. Pumps
- 9.1.3.4. Other Accessories
- 9.1.1. By Chromatography Systems
- 9.2. Market Analysis, Insights and Forecast - by Application
- 9.2.1. Agriculture
- 9.2.2. Pharmaceutical Firms
- 9.2.3. Clinical Research Organizations
- 9.2.4. Environmental Testing
- 9.1. Market Analysis, Insights and Forecast - by Devices
- 10. South America Chromatography Systems Industry Analysis, Insights and Forecast, 2019-2031
- 10.1. Market Analysis, Insights and Forecast - by Devices
- 10.1.1. By Chromatography Systems
- 10.1.1.1. Gas Chromatography Systems
- 10.1.1.2. Liquid Chromatography Systems
- 10.1.1.3. Fluid Chromatography Systems
- 10.1.1.4. Thin Layer Chromatography Systems
- 10.1.2. By Consumables
- 10.1.2.1. Columns
- 10.1.2.2. Solvents/Reagents/Adsorbents
- 10.1.2.3. Syringes/Needles
- 10.1.2.4. Others
- 10.1.3. By Accessories
- 10.1.3.1. Column Accessories
- 10.1.3.2. Auto-Sampler Accessories
- 10.1.3.3. Pumps
- 10.1.3.4. Other Accessories
- 10.1.1. By Chromatography Systems
- 10.2. Market Analysis, Insights and Forecast - by Application
- 10.2.1. Agriculture
- 10.2.2. Pharmaceutical Firms
- 10.2.3. Clinical Research Organizations
- 10.2.4. Environmental Testing
- 10.1. Market Analysis, Insights and Forecast - by Devices
- 11. North America Chromatography Systems Industry Analysis, Insights and Forecast, 2019-2031
- 11.1. Market Analysis, Insights and Forecast - By Country/Sub-region
- 11.1.1 United States
- 11.1.2 Canada
- 11.1.3 Mexico
- 12. Europe Chromatography Systems Industry Analysis, Insights and Forecast, 2019-2031
- 12.1. Market Analysis, Insights and Forecast - By Country/Sub-region
- 12.1.1 Germany
- 12.1.2 United Kingdom
- 12.1.3 France
- 12.1.4 Italy
- 12.1.5 Spain
- 12.1.6 Rest of Europe
- 13. Asia Pacific Chromatography Systems Industry Analysis, Insights and Forecast, 2019-2031
- 13.1. Market Analysis, Insights and Forecast - By Country/Sub-region
- 13.1.1 China
- 13.1.2 Japan
- 13.1.3 India
- 13.1.4 Australia
- 13.1.5 South Korea
- 13.1.6 Rest of Asia Pacific
- 14. Middle East and Africa Chromatography Systems Industry Analysis, Insights and Forecast, 2019-2031
- 14.1. Market Analysis, Insights and Forecast - By Country/Sub-region
- 14.1.1 GCC
- 14.1.2 South Africa
- 14.1.3 Rest of Middle East and Africa
- 15. South America Chromatography Systems Industry Analysis, Insights and Forecast, 2019-2031
- 15.1. Market Analysis, Insights and Forecast - By Country/Sub-region
- 15.1.1 Brazil
- 15.1.2 Argentina
- 15.1.3 Rest of South America
- 16. Competitive Analysis
- 16.1. Global Market Share Analysis 2024
- 16.2. Company Profiles
- 16.2.1 Restek Corporation
- 16.2.1.1. Overview
- 16.2.1.2. Products
- 16.2.1.3. SWOT Analysis
- 16.2.1.4. Recent Developments
- 16.2.1.5. Financials (Based on Availability)
- 16.2.2 Merck KGaA
- 16.2.2.1. Overview
- 16.2.2.2. Products
- 16.2.2.3. SWOT Analysis
- 16.2.2.4. Recent Developments
- 16.2.2.5. Financials (Based on Availability)
- 16.2.3 Phenomenex
- 16.2.3.1. Overview
- 16.2.3.2. Products
- 16.2.3.3. SWOT Analysis
- 16.2.3.4. Recent Developments
- 16.2.3.5. Financials (Based on Availability)
- 16.2.4 Perkinelmer Inc
- 16.2.4.1. Overview
- 16.2.4.2. Products
- 16.2.4.3. SWOT Analysis
- 16.2.4.4. Recent Developments
- 16.2.4.5. Financials (Based on Availability)
- 16.2.5 Waters Corporation
- 16.2.5.1. Overview
- 16.2.5.2. Products
- 16.2.5.3. SWOT Analysis
- 16.2.5.4. Recent Developments
- 16.2.5.5. Financials (Based on Availability)
- 16.2.6 Cytiva
- 16.2.6.1. Overview
- 16.2.6.2. Products
- 16.2.6.3. SWOT Analysis
- 16.2.6.4. Recent Developments
- 16.2.6.5. Financials (Based on Availability)
- 16.2.7 Sartorius AG
- 16.2.7.1. Overview
- 16.2.7.2. Products
- 16.2.7.3. SWOT Analysis
- 16.2.7.4. Recent Developments
- 16.2.7.5. Financials (Based on Availability)
- 16.2.8 Bio-Rad Laboratories
- 16.2.8.1. Overview
- 16.2.8.2. Products
- 16.2.8.3. SWOT Analysis
- 16.2.8.4. Recent Developments
- 16.2.8.5. Financials (Based on Availability)
- 16.2.9 Gilson Inc
- 16.2.9.1. Overview
- 16.2.9.2. Products
- 16.2.9.3. SWOT Analysis
- 16.2.9.4. Recent Developments
- 16.2.9.5. Financials (Based on Availability)
- 16.2.10 Thermo Fisher Scientific
- 16.2.10.1. Overview
- 16.2.10.2. Products
- 16.2.10.3. SWOT Analysis
- 16.2.10.4. Recent Developments
- 16.2.10.5. Financials (Based on Availability)
- 16.2.11 Agilent Technologies
- 16.2.11.1. Overview
- 16.2.11.2. Products
- 16.2.11.3. SWOT Analysis
- 16.2.11.4. Recent Developments
- 16.2.11.5. Financials (Based on Availability)
- 16.2.12 Shimadzu Corporation
- 16.2.12.1. Overview
- 16.2.12.2. Products
- 16.2.12.3. SWOT Analysis
- 16.2.12.4. Recent Developments
- 16.2.12.5. Financials (Based on Availability)
- 16.2.1 Restek Corporation
List of Figures
- Figure 1: Global Chromatography Systems Industry Revenue Breakdown (Million, %) by Region 2024 & 2032
- Figure 2: Global Chromatography Systems Industry Volume Breakdown (K Unit, %) by Region 2024 & 2032
- Figure 3: North America Chromatography Systems Industry Revenue (Million), by Country 2024 & 2032
- Figure 4: North America Chromatography Systems Industry Volume (K Unit), by Country 2024 & 2032
- Figure 5: North America Chromatography Systems Industry Revenue Share (%), by Country 2024 & 2032
- Figure 6: North America Chromatography Systems Industry Volume Share (%), by Country 2024 & 2032
- Figure 7: Europe Chromatography Systems Industry Revenue (Million), by Country 2024 & 2032
- Figure 8: Europe Chromatography Systems Industry Volume (K Unit), by Country 2024 & 2032
- Figure 9: Europe Chromatography Systems Industry Revenue Share (%), by Country 2024 & 2032
- Figure 10: Europe Chromatography Systems Industry Volume Share (%), by Country 2024 & 2032
- Figure 11: Asia Pacific Chromatography Systems Industry Revenue (Million), by Country 2024 & 2032
- Figure 12: Asia Pacific Chromatography Systems Industry Volume (K Unit), by Country 2024 & 2032
- Figure 13: Asia Pacific Chromatography Systems Industry Revenue Share (%), by Country 2024 & 2032
- Figure 14: Asia Pacific Chromatography Systems Industry Volume Share (%), by Country 2024 & 2032
- Figure 15: Middle East and Africa Chromatography Systems Industry Revenue (Million), by Country 2024 & 2032
- Figure 16: Middle East and Africa Chromatography Systems Industry Volume (K Unit), by Country 2024 & 2032
- Figure 17: Middle East and Africa Chromatography Systems Industry Revenue Share (%), by Country 2024 & 2032
- Figure 18: Middle East and Africa Chromatography Systems Industry Volume Share (%), by Country 2024 & 2032
- Figure 19: South America Chromatography Systems Industry Revenue (Million), by Country 2024 & 2032
- Figure 20: South America Chromatography Systems Industry Volume (K Unit), by Country 2024 & 2032
- Figure 21: South America Chromatography Systems Industry Revenue Share (%), by Country 2024 & 2032
- Figure 22: South America Chromatography Systems Industry Volume Share (%), by Country 2024 & 2032
- Figure 23: North America Chromatography Systems Industry Revenue (Million), by Devices 2024 & 2032
- Figure 24: North America Chromatography Systems Industry Volume (K Unit), by Devices 2024 & 2032
- Figure 25: North America Chromatography Systems Industry Revenue Share (%), by Devices 2024 & 2032
- Figure 26: North America Chromatography Systems Industry Volume Share (%), by Devices 2024 & 2032
- Figure 27: North America Chromatography Systems Industry Revenue (Million), by Application 2024 & 2032
- Figure 28: North America Chromatography Systems Industry Volume (K Unit), by Application 2024 & 2032
- Figure 29: North America Chromatography Systems Industry Revenue Share (%), by Application 2024 & 2032
- Figure 30: North America Chromatography Systems Industry Volume Share (%), by Application 2024 & 2032
- Figure 31: North America Chromatography Systems Industry Revenue (Million), by Country 2024 & 2032
- Figure 32: North America Chromatography Systems Industry Volume (K Unit), by Country 2024 & 2032
- Figure 33: North America Chromatography Systems Industry Revenue Share (%), by Country 2024 & 2032
- Figure 34: North America Chromatography Systems Industry Volume Share (%), by Country 2024 & 2032
- Figure 35: Europe Chromatography Systems Industry Revenue (Million), by Devices 2024 & 2032
- Figure 36: Europe Chromatography Systems Industry Volume (K Unit), by Devices 2024 & 2032
- Figure 37: Europe Chromatography Systems Industry Revenue Share (%), by Devices 2024 & 2032
- Figure 38: Europe Chromatography Systems Industry Volume Share (%), by Devices 2024 & 2032
- Figure 39: Europe Chromatography Systems Industry Revenue (Million), by Application 2024 & 2032
- Figure 40: Europe Chromatography Systems Industry Volume (K Unit), by Application 2024 & 2032
- Figure 41: Europe Chromatography Systems Industry Revenue Share (%), by Application 2024 & 2032
- Figure 42: Europe Chromatography Systems Industry Volume Share (%), by Application 2024 & 2032
- Figure 43: Europe Chromatography Systems Industry Revenue (Million), by Country 2024 & 2032
- Figure 44: Europe Chromatography Systems Industry Volume (K Unit), by Country 2024 & 2032
- Figure 45: Europe Chromatography Systems Industry Revenue Share (%), by Country 2024 & 2032
- Figure 46: Europe Chromatography Systems Industry Volume Share (%), by Country 2024 & 2032
- Figure 47: Asia Pacific Chromatography Systems Industry Revenue (Million), by Devices 2024 & 2032
- Figure 48: Asia Pacific Chromatography Systems Industry Volume (K Unit), by Devices 2024 & 2032
- Figure 49: Asia Pacific Chromatography Systems Industry Revenue Share (%), by Devices 2024 & 2032
- Figure 50: Asia Pacific Chromatography Systems Industry Volume Share (%), by Devices 2024 & 2032
- Figure 51: Asia Pacific Chromatography Systems Industry Revenue (Million), by Application 2024 & 2032
- Figure 52: Asia Pacific Chromatography Systems Industry Volume (K Unit), by Application 2024 & 2032
- Figure 53: Asia Pacific Chromatography Systems Industry Revenue Share (%), by Application 2024 & 2032
- Figure 54: Asia Pacific Chromatography Systems Industry Volume Share (%), by Application 2024 & 2032
- Figure 55: Asia Pacific Chromatography Systems Industry Revenue (Million), by Country 2024 & 2032
- Figure 56: Asia Pacific Chromatography Systems Industry Volume (K Unit), by Country 2024 & 2032
- Figure 57: Asia Pacific Chromatography Systems Industry Revenue Share (%), by Country 2024 & 2032
- Figure 58: Asia Pacific Chromatography Systems Industry Volume Share (%), by Country 2024 & 2032
- Figure 59: Middle East and Africa Chromatography Systems Industry Revenue (Million), by Devices 2024 & 2032
- Figure 60: Middle East and Africa Chromatography Systems Industry Volume (K Unit), by Devices 2024 & 2032
- Figure 61: Middle East and Africa Chromatography Systems Industry Revenue Share (%), by Devices 2024 & 2032
- Figure 62: Middle East and Africa Chromatography Systems Industry Volume Share (%), by Devices 2024 & 2032
- Figure 63: Middle East and Africa Chromatography Systems Industry Revenue (Million), by Application 2024 & 2032
- Figure 64: Middle East and Africa Chromatography Systems Industry Volume (K Unit), by Application 2024 & 2032
- Figure 65: Middle East and Africa Chromatography Systems Industry Revenue Share (%), by Application 2024 & 2032
- Figure 66: Middle East and Africa Chromatography Systems Industry Volume Share (%), by Application 2024 & 2032
- Figure 67: Middle East and Africa Chromatography Systems Industry Revenue (Million), by Country 2024 & 2032
- Figure 68: Middle East and Africa Chromatography Systems Industry Volume (K Unit), by Country 2024 & 2032
- Figure 69: Middle East and Africa Chromatography Systems Industry Revenue Share (%), by Country 2024 & 2032
- Figure 70: Middle East and Africa Chromatography Systems Industry Volume Share (%), by Country 2024 & 2032
- Figure 71: South America Chromatography Systems Industry Revenue (Million), by Devices 2024 & 2032
- Figure 72: South America Chromatography Systems Industry Volume (K Unit), by Devices 2024 & 2032
- Figure 73: South America Chromatography Systems Industry Revenue Share (%), by Devices 2024 & 2032
- Figure 74: South America Chromatography Systems Industry Volume Share (%), by Devices 2024 & 2032
- Figure 75: South America Chromatography Systems Industry Revenue (Million), by Application 2024 & 2032
- Figure 76: South America Chromatography Systems Industry Volume (K Unit), by Application 2024 & 2032
- Figure 77: South America Chromatography Systems Industry Revenue Share (%), by Application 2024 & 2032
- Figure 78: South America Chromatography Systems Industry Volume Share (%), by Application 2024 & 2032
- Figure 79: South America Chromatography Systems Industry Revenue (Million), by Country 2024 & 2032
- Figure 80: South America Chromatography Systems Industry Volume (K Unit), by Country 2024 & 2032
- Figure 81: South America Chromatography Systems Industry Revenue Share (%), by Country 2024 & 2032
- Figure 82: South America Chromatography Systems Industry Volume Share (%), by Country 2024 & 2032
List of Tables
- Table 1: Global Chromatography Systems Industry Revenue Million Forecast, by Region 2019 & 2032
- Table 2: Global Chromatography Systems Industry Volume K Unit Forecast, by Region 2019 & 2032
- Table 3: Global Chromatography Systems Industry Revenue Million Forecast, by Devices 2019 & 2032
- Table 4: Global Chromatography Systems Industry Volume K Unit Forecast, by Devices 2019 & 2032
- Table 5: Global Chromatography Systems Industry Revenue Million Forecast, by Application 2019 & 2032
- Table 6: Global Chromatography Systems Industry Volume K Unit Forecast, by Application 2019 & 2032
- Table 7: Global Chromatography Systems Industry Revenue Million Forecast, by Region 2019 & 2032
- Table 8: Global Chromatography Systems Industry Volume K Unit Forecast, by Region 2019 & 2032
- Table 9: Global Chromatography Systems Industry Revenue Million Forecast, by Country 2019 & 2032
- Table 10: Global Chromatography Systems Industry Volume K Unit Forecast, by Country 2019 & 2032
- Table 11: United States Chromatography Systems Industry Revenue (Million) Forecast, by Application 2019 & 2032
- Table 12: United States Chromatography Systems Industry Volume (K Unit) Forecast, by Application 2019 & 2032
- Table 13: Canada Chromatography Systems Industry Revenue (Million) Forecast, by Application 2019 & 2032
- Table 14: Canada Chromatography Systems Industry Volume (K Unit) Forecast, by Application 2019 & 2032
- Table 15: Mexico Chromatography Systems Industry Revenue (Million) Forecast, by Application 2019 & 2032
- Table 16: Mexico Chromatography Systems Industry Volume (K Unit) Forecast, by Application 2019 & 2032
- Table 17: Global Chromatography Systems Industry Revenue Million Forecast, by Country 2019 & 2032
- Table 18: Global Chromatography Systems Industry Volume K Unit Forecast, by Country 2019 & 2032
- Table 19: Germany Chromatography Systems Industry Revenue (Million) Forecast, by Application 2019 & 2032
- Table 20: Germany Chromatography Systems Industry Volume (K Unit) Forecast, by Application 2019 & 2032
- Table 21: United Kingdom Chromatography Systems Industry Revenue (Million) Forecast, by Application 2019 & 2032
- Table 22: United Kingdom Chromatography Systems Industry Volume (K Unit) Forecast, by Application 2019 & 2032
- Table 23: France Chromatography Systems Industry Revenue (Million) Forecast, by Application 2019 & 2032
- Table 24: France Chromatography Systems Industry Volume (K Unit) Forecast, by Application 2019 & 2032
- Table 25: Italy Chromatography Systems Industry Revenue (Million) Forecast, by Application 2019 & 2032
- Table 26: Italy Chromatography Systems Industry Volume (K Unit) Forecast, by Application 2019 & 2032
- Table 27: Spain Chromatography Systems Industry Revenue (Million) Forecast, by Application 2019 & 2032
- Table 28: Spain Chromatography Systems Industry Volume (K Unit) Forecast, by Application 2019 & 2032
- Table 29: Rest of Europe Chromatography Systems Industry Revenue (Million) Forecast, by Application 2019 & 2032
- Table 30: Rest of Europe Chromatography Systems Industry Volume (K Unit) Forecast, by Application 2019 & 2032
- Table 31: Global Chromatography Systems Industry Revenue Million Forecast, by Country 2019 & 2032
- Table 32: Global Chromatography Systems Industry Volume K Unit Forecast, by Country 2019 & 2032
- Table 33: China Chromatography Systems Industry Revenue (Million) Forecast, by Application 2019 & 2032
- Table 34: China Chromatography Systems Industry Volume (K Unit) Forecast, by Application 2019 & 2032
- Table 35: Japan Chromatography Systems Industry Revenue (Million) Forecast, by Application 2019 & 2032
- Table 36: Japan Chromatography Systems Industry Volume (K Unit) Forecast, by Application 2019 & 2032
- Table 37: India Chromatography Systems Industry Revenue (Million) Forecast, by Application 2019 & 2032
- Table 38: India Chromatography Systems Industry Volume (K Unit) Forecast, by Application 2019 & 2032
- Table 39: Australia Chromatography Systems Industry Revenue (Million) Forecast, by Application 2019 & 2032
- Table 40: Australia Chromatography Systems Industry Volume (K Unit) Forecast, by Application 2019 & 2032
- Table 41: South Korea Chromatography Systems Industry Revenue (Million) Forecast, by Application 2019 & 2032
- Table 42: South Korea Chromatography Systems Industry Volume (K Unit) Forecast, by Application 2019 & 2032
- Table 43: Rest of Asia Pacific Chromatography Systems Industry Revenue (Million) Forecast, by Application 2019 & 2032
- Table 44: Rest of Asia Pacific Chromatography Systems Industry Volume (K Unit) Forecast, by Application 2019 & 2032
- Table 45: Global Chromatography Systems Industry Revenue Million Forecast, by Country 2019 & 2032
- Table 46: Global Chromatography Systems Industry Volume K Unit Forecast, by Country 2019 & 2032
- Table 47: GCC Chromatography Systems Industry Revenue (Million) Forecast, by Application 2019 & 2032
- Table 48: GCC Chromatography Systems Industry Volume (K Unit) Forecast, by Application 2019 & 2032
- Table 49: South Africa Chromatography Systems Industry Revenue (Million) Forecast, by Application 2019 & 2032
- Table 50: South Africa Chromatography Systems Industry Volume (K Unit) Forecast, by Application 2019 & 2032
- Table 51: Rest of Middle East and Africa Chromatography Systems Industry Revenue (Million) Forecast, by Application 2019 & 2032
- Table 52: Rest of Middle East and Africa Chromatography Systems Industry Volume (K Unit) Forecast, by Application 2019 & 2032
- Table 53: Global Chromatography Systems Industry Revenue Million Forecast, by Country 2019 & 2032
- Table 54: Global Chromatography Systems Industry Volume K Unit Forecast, by Country 2019 & 2032
- Table 55: Brazil Chromatography Systems Industry Revenue (Million) Forecast, by Application 2019 & 2032
- Table 56: Brazil Chromatography Systems Industry Volume (K Unit) Forecast, by Application 2019 & 2032
- Table 57: Argentina Chromatography Systems Industry Revenue (Million) Forecast, by Application 2019 & 2032
- Table 58: Argentina Chromatography Systems Industry Volume (K Unit) Forecast, by Application 2019 & 2032
- Table 59: Rest of South America Chromatography Systems Industry Revenue (Million) Forecast, by Application 2019 & 2032
- Table 60: Rest of South America Chromatography Systems Industry Volume (K Unit) Forecast, by Application 2019 & 2032
- Table 61: Global Chromatography Systems Industry Revenue Million Forecast, by Devices 2019 & 2032
- Table 62: Global Chromatography Systems Industry Volume K Unit Forecast, by Devices 2019 & 2032
- Table 63: Global Chromatography Systems Industry Revenue Million Forecast, by Application 2019 & 2032
- Table 64: Global Chromatography Systems Industry Volume K Unit Forecast, by Application 2019 & 2032
- Table 65: Global Chromatography Systems Industry Revenue Million Forecast, by Country 2019 & 2032
- Table 66: Global Chromatography Systems Industry Volume K Unit Forecast, by Country 2019 & 2032
- Table 67: United States Chromatography Systems Industry Revenue (Million) Forecast, by Application 2019 & 2032
- Table 68: United States Chromatography Systems Industry Volume (K Unit) Forecast, by Application 2019 & 2032
- Table 69: Canada Chromatography Systems Industry Revenue (Million) Forecast, by Application 2019 & 2032
- Table 70: Canada Chromatography Systems Industry Volume (K Unit) Forecast, by Application 2019 & 2032
- Table 71: Mexico Chromatography Systems Industry Revenue (Million) Forecast, by Application 2019 & 2032
- Table 72: Mexico Chromatography Systems Industry Volume (K Unit) Forecast, by Application 2019 & 2032
- Table 73: Global Chromatography Systems Industry Revenue Million Forecast, by Devices 2019 & 2032
- Table 74: Global Chromatography Systems Industry Volume K Unit Forecast, by Devices 2019 & 2032
- Table 75: Global Chromatography Systems Industry Revenue Million Forecast, by Application 2019 & 2032
- Table 76: Global Chromatography Systems Industry Volume K Unit Forecast, by Application 2019 & 2032
- Table 77: Global Chromatography Systems Industry Revenue Million Forecast, by Country 2019 & 2032
- Table 78: Global Chromatography Systems Industry Volume K Unit Forecast, by Country 2019 & 2032
- Table 79: Germany Chromatography Systems Industry Revenue (Million) Forecast, by Application 2019 & 2032
- Table 80: Germany Chromatography Systems Industry Volume (K Unit) Forecast, by Application 2019 & 2032
- Table 81: United Kingdom Chromatography Systems Industry Revenue (Million) Forecast, by Application 2019 & 2032
- Table 82: United Kingdom Chromatography Systems Industry Volume (K Unit) Forecast, by Application 2019 & 2032
- Table 83: France Chromatography Systems Industry Revenue (Million) Forecast, by Application 2019 & 2032
- Table 84: France Chromatography Systems Industry Volume (K Unit) Forecast, by Application 2019 & 2032
- Table 85: Italy Chromatography Systems Industry Revenue (Million) Forecast, by Application 2019 & 2032
- Table 86: Italy Chromatography Systems Industry Volume (K Unit) Forecast, by Application 2019 & 2032
- Table 87: Spain Chromatography Systems Industry Revenue (Million) Forecast, by Application 2019 & 2032
- Table 88: Spain Chromatography Systems Industry Volume (K Unit) Forecast, by Application 2019 & 2032
- Table 89: Rest of Europe Chromatography Systems Industry Revenue (Million) Forecast, by Application 2019 & 2032
- Table 90: Rest of Europe Chromatography Systems Industry Volume (K Unit) Forecast, by Application 2019 & 2032
- Table 91: Global Chromatography Systems Industry Revenue Million Forecast, by Devices 2019 & 2032
- Table 92: Global Chromatography Systems Industry Volume K Unit Forecast, by Devices 2019 & 2032
- Table 93: Global Chromatography Systems Industry Revenue Million Forecast, by Application 2019 & 2032
- Table 94: Global Chromatography Systems Industry Volume K Unit Forecast, by Application 2019 & 2032
- Table 95: Global Chromatography Systems Industry Revenue Million Forecast, by Country 2019 & 2032
- Table 96: Global Chromatography Systems Industry Volume K Unit Forecast, by Country 2019 & 2032
- Table 97: China Chromatography Systems Industry Revenue (Million) Forecast, by Application 2019 & 2032
- Table 98: China Chromatography Systems Industry Volume (K Unit) Forecast, by Application 2019 & 2032
- Table 99: Japan Chromatography Systems Industry Revenue (Million) Forecast, by Application 2019 & 2032
- Table 100: Japan Chromatography Systems Industry Volume (K Unit) Forecast, by Application 2019 & 2032
- Table 101: India Chromatography Systems Industry Revenue (Million) Forecast, by Application 2019 & 2032
- Table 102: India Chromatography Systems Industry Volume (K Unit) Forecast, by Application 2019 & 2032
- Table 103: Australia Chromatography Systems Industry Revenue (Million) Forecast, by Application 2019 & 2032
- Table 104: Australia Chromatography Systems Industry Volume (K Unit) Forecast, by Application 2019 & 2032
- Table 105: South Korea Chromatography Systems Industry Revenue (Million) Forecast, by Application 2019 & 2032
- Table 106: South Korea Chromatography Systems Industry Volume (K Unit) Forecast, by Application 2019 & 2032
- Table 107: Rest of Asia Pacific Chromatography Systems Industry Revenue (Million) Forecast, by Application 2019 & 2032
- Table 108: Rest of Asia Pacific Chromatography Systems Industry Volume (K Unit) Forecast, by Application 2019 & 2032
- Table 109: Global Chromatography Systems Industry Revenue Million Forecast, by Devices 2019 & 2032
- Table 110: Global Chromatography Systems Industry Volume K Unit Forecast, by Devices 2019 & 2032
- Table 111: Global Chromatography Systems Industry Revenue Million Forecast, by Application 2019 & 2032
- Table 112: Global Chromatography Systems Industry Volume K Unit Forecast, by Application 2019 & 2032
- Table 113: Global Chromatography Systems Industry Revenue Million Forecast, by Country 2019 & 2032
- Table 114: Global Chromatography Systems Industry Volume K Unit Forecast, by Country 2019 & 2032
- Table 115: GCC Chromatography Systems Industry Revenue (Million) Forecast, by Application 2019 & 2032
- Table 116: GCC Chromatography Systems Industry Volume (K Unit) Forecast, by Application 2019 & 2032
- Table 117: South Africa Chromatography Systems Industry Revenue (Million) Forecast, by Application 2019 & 2032
- Table 118: South Africa Chromatography Systems Industry Volume (K Unit) Forecast, by Application 2019 & 2032
- Table 119: Rest of Middle East and Africa Chromatography Systems Industry Revenue (Million) Forecast, by Application 2019 & 2032
- Table 120: Rest of Middle East and Africa Chromatography Systems Industry Volume (K Unit) Forecast, by Application 2019 & 2032
- Table 121: Global Chromatography Systems Industry Revenue Million Forecast, by Devices 2019 & 2032
- Table 122: Global Chromatography Systems Industry Volume K Unit Forecast, by Devices 2019 & 2032
- Table 123: Global Chromatography Systems Industry Revenue Million Forecast, by Application 2019 & 2032
- Table 124: Global Chromatography Systems Industry Volume K Unit Forecast, by Application 2019 & 2032
- Table 125: Global Chromatography Systems Industry Revenue Million Forecast, by Country 2019 & 2032
- Table 126: Global Chromatography Systems Industry Volume K Unit Forecast, by Country 2019 & 2032
- Table 127: Brazil Chromatography Systems Industry Revenue (Million) Forecast, by Application 2019 & 2032
- Table 128: Brazil Chromatography Systems Industry Volume (K Unit) Forecast, by Application 2019 & 2032
- Table 129: Argentina Chromatography Systems Industry Revenue (Million) Forecast, by Application 2019 & 2032
- Table 130: Argentina Chromatography Systems Industry Volume (K Unit) Forecast, by Application 2019 & 2032
- Table 131: Rest of South America Chromatography Systems Industry Revenue (Million) Forecast, by Application 2019 & 2032
- Table 132: Rest of South America Chromatography Systems Industry Volume (K Unit) Forecast, by Application 2019 & 2032
Frequently Asked Questions
1. What is the projected Compound Annual Growth Rate (CAGR) of the Chromatography Systems Industry?
The projected CAGR is approximately 5.23%.
2. Which companies are prominent players in the Chromatography Systems Industry?
Key companies in the market include Restek Corporation, Merck KGaA, Phenomenex, Perkinelmer Inc, Waters Corporation, Cytiva, Sartorius AG, Bio-Rad Laboratories, Gilson Inc, Thermo Fisher Scientific, Agilent Technologies, Shimadzu Corporation.
3. What are the main segments of the Chromatography Systems Industry?
The market segments include Devices, Application.
4. Can you provide details about the market size?
The market size is estimated to be USD 9.63 Million as of 2022.
5. What are some drivers contributing to market growth?
Chromatography Tests in Drug Approval Process; Advancements in Chromatography Equipment; Growing Food Safety Concerns.
6. What are the notable trends driving market growth?
Liquid Chromatography Systems are Expected to Dominate the Chromatography Instrumentation Market.
7. Are there any restraints impacting market growth?
High Equipment Costs; Lack of Skilled Personnel for Equipment Handling.
8. Can you provide examples of recent developments in the market?
N/A
9. What pricing options are available for accessing the report?
Pricing options include single-user, multi-user, and enterprise licenses priced at USD 4750, USD 5250, and USD 8750 respectively.
10. Is the market size provided in terms of value or volume?
The market size is provided in terms of value, measured in Million and volume, measured in K Unit.
11. Are there any specific market keywords associated with the report?
Yes, the market keyword associated with the report is "Chromatography Systems Industry," which aids in identifying and referencing the specific market segment covered.
12. How do I determine which pricing option suits my needs best?
The pricing options vary based on user requirements and access needs. Individual users may opt for single-user licenses, while businesses requiring broader access may choose multi-user or enterprise licenses for cost-effective access to the report.
13. Are there any additional resources or data provided in the Chromatography Systems Industry report?
While the report offers comprehensive insights, it's advisable to review the specific contents or supplementary materials provided to ascertain if additional resources or data are available.
14. How can I stay updated on further developments or reports in the Chromatography Systems Industry?
To stay informed about further developments, trends, and reports in the Chromatography Systems Industry, consider subscribing to industry newsletters, following relevant companies and organizations, or regularly checking reputable industry news sources and publications.
Methodology
Step 1 - Identification of Relevant Samples Size from Population Database


Step 2 - Approaches for Defining Global Market Size (Value, Volume* & Price*)

Note*: In applicable scenarios
Step 3 - Data Sources
Primary Research
- Web Analytics
- Survey Reports
- Research Institute
- Latest Research Reports
- Opinion Leaders
Secondary Research
- Annual Reports
- White Paper
- Latest Press Release
- Industry Association
- Paid Database
- Investor Presentations

Step 4 - Data Triangulation
Involves using different sources of information in order to increase the validity of a study
These sources are likely to be stakeholders in a program - participants, other researchers, program staff, other community members, and so on.
Then we put all data in single framework & apply various statistical tools to find out the dynamic on the market.
During the analysis stage, feedback from the stakeholder groups would be compared to determine areas of agreement as well as areas of divergence


