
Key Insights
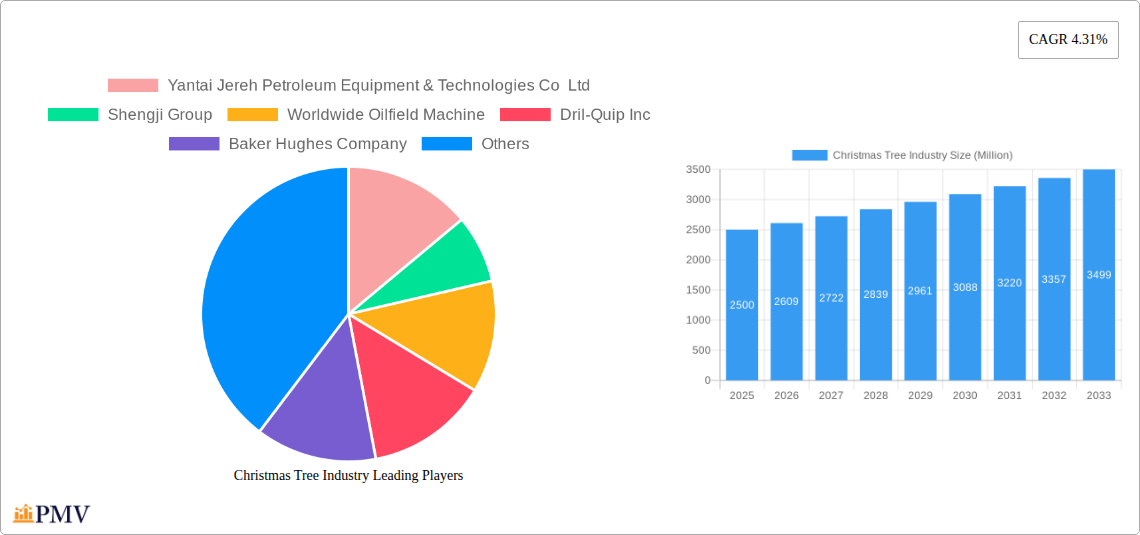
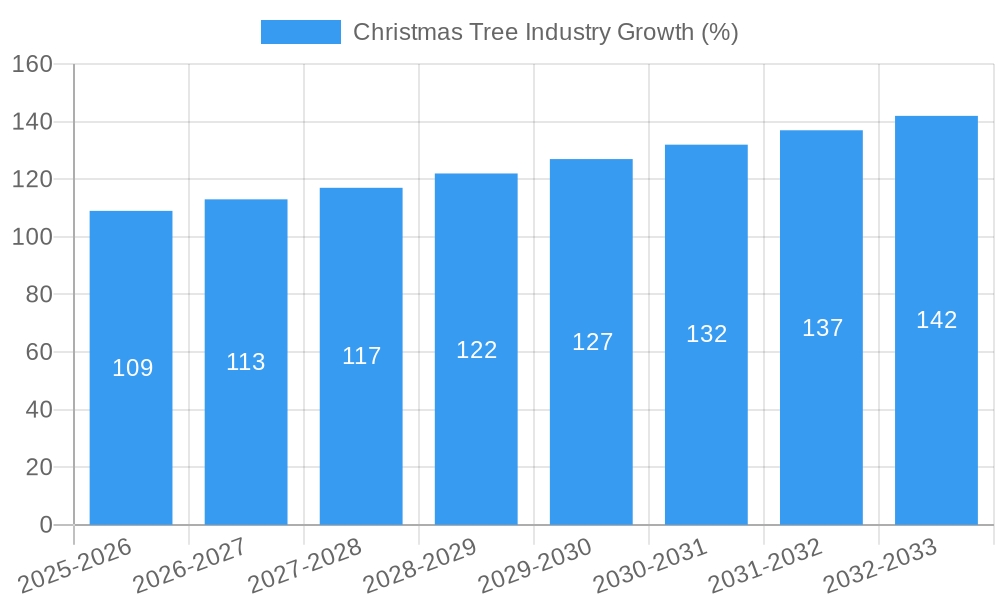
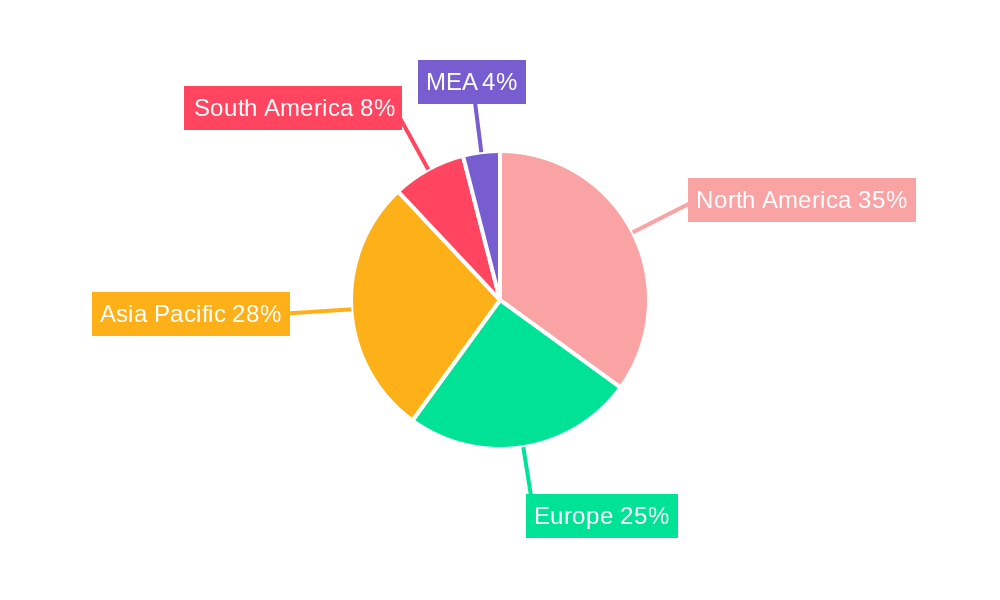
The global Christmas tree market, valued at approximately $XX million in 2025, is projected to experience steady growth, exhibiting a compound annual growth rate (CAGR) of 4.31% from 2025 to 2033. This growth is driven by the increasing demand for oil and gas extraction, particularly in offshore and challenging environments where robust and reliable Christmas trees are crucial. Technological advancements, such as the development of advanced materials and automation in manufacturing, are contributing to improved efficiency and reduced operational costs, further fueling market expansion. The market is segmented by type (horizontal and vertical trees) and location of deployment (onshore and offshore), with the offshore segment expected to witness significant growth due to the exploration of deeper water reserves. Key players like Yantai Jereh, Shengji Group, Dril-Quip, Baker Hughes, Aker Solutions, Schlumberger, and TechnipFMC are actively engaged in innovation and strategic partnerships to maintain their market share. However, factors such as fluctuating oil and gas prices and stringent regulatory compliance requirements could potentially restrain market growth. Regional variations in growth are anticipated, with North America and the Asia-Pacific region expected to lead the market, driven by substantial oil and gas exploration and production activities.
The market's future trajectory is influenced by several factors. Governmental policies promoting sustainable energy practices might influence the pace of growth, creating both opportunities and challenges. The increasing adoption of digital technologies in oil and gas operations presents significant opportunities for improving the efficiency and reliability of Christmas trees. This includes incorporating smart sensors and predictive maintenance techniques to optimize performance and minimize downtime. The expansion of exploration activities into deeper waters and more challenging environments will continue to fuel demand for advanced Christmas tree technologies capable of handling higher pressures and temperatures. Competition among major players will remain intense, with companies focusing on developing innovative products, improving operational efficiency, and expanding their global presence to gain a competitive edge. Furthermore, strategic mergers and acquisitions could reshape the market landscape in the coming years.
Christmas Tree Industry Market Report: 2019-2033
This comprehensive report provides an in-depth analysis of the global Christmas tree industry, offering invaluable insights for businesses, investors, and industry stakeholders. Covering the period from 2019 to 2033, with a base year of 2025 and a forecast period spanning 2025-2033, this report meticulously examines market trends, competitive dynamics, and future growth potential. The total market size is projected to reach xx Million by 2033, exhibiting a CAGR of xx% during the forecast period.
Christmas Tree Industry Market Structure & Competitive Dynamics
The global Christmas tree market is characterized by a moderately concentrated structure, with a few major players holding significant market share. Key players such as Schlumberger Limited, TechnipFMC PLC, Baker Hughes Company, and Aker Solutions dominate the landscape, often engaging in mergers and acquisitions (M&A) to expand their market reach and technological capabilities. The total M&A deal value in the sector from 2019-2024 is estimated at xx Million. Innovation plays a critical role, with companies continuously developing advanced subsea Christmas trees and improving efficiency in both onshore and offshore deployments. Regulatory frameworks, particularly concerning environmental compliance and safety standards, heavily influence operations. Product substitutes, though limited, exist in niche applications. End-user trends, primarily driven by the oil and gas industry’s exploration and production activities, dictate market demand.
- Market Concentration: High, with top 5 players holding approximately xx% market share.
- Innovation Ecosystems: Active, driven by R&D investments in subsea technology and automation.
- Regulatory Frameworks: Stringent, focusing on safety and environmental protection.
- Product Substitutes: Limited, but emerging technologies may pose a future challenge.
- End-User Trends: Aligned with global energy demand and exploration activities.
- M&A Activities: Significant, with xx Million in deals from 2019-2024, indicating consolidation.
Christmas Tree Industry Industry Trends & Insights
The Christmas tree industry is experiencing robust growth, fueled by increasing global energy demand and ongoing exploration and production activities in both onshore and offshore oil and gas fields. Technological advancements, such as the development of advanced subsea Christmas trees and automation systems, are enhancing efficiency and operational safety. Market penetration of these advanced technologies is steadily increasing, expected to reach xx% by 2033. Furthermore, the industry is witnessing a shift towards sustainable practices and stricter environmental regulations, driving innovation in environmentally friendly solutions. Competitive dynamics remain intense, with major players constantly vying for market share through technological innovation, strategic partnerships, and M&A activities. The market is expected to witness a CAGR of xx% over the forecast period.
Dominant Markets & Segments in Christmas Tree Industry
The offshore segment currently dominates the Christmas tree market, driven by significant exploration and production activities in deepwater regions. This dominance is expected to continue throughout the forecast period. Geographically, regions with substantial oil and gas reserves, such as the Middle East, North America, and Asia-Pacific, represent major markets.
- By Type:
- Horizontal Trees: Growing steadily due to the increase in horizontal drilling.
- Vertical Trees: Remaining a significant market segment, particularly in established fields.
- By Location of Deployment:
- Offshore: Dominant segment driven by deepwater exploration and production. Key drivers include technological advancements in subsea systems, increasing demand for offshore oil and gas, and significant investments in deepwater projects.
- Onshore: Steady growth driven by onshore drilling and production activities, although significantly smaller than the offshore segment.
Christmas Tree Industry Product Innovations
Recent product innovations focus on enhancing operational efficiency, safety, and environmental performance. Subsea Christmas trees are becoming increasingly sophisticated, incorporating advanced automation, remote control capabilities, and enhanced reliability features. Manufacturers are also developing lighter, more compact designs to reduce installation costs and improve operational flexibility. These innovations are crucial in responding to the challenges posed by increasingly complex and demanding operational environments.
Report Segmentation & Scope
This report segments the Christmas tree market by type (Horizontal Tree, Vertical Tree) and by location of deployment (Onshore, Offshore). Each segment is analyzed in detail, providing insights into market size, growth projections, and competitive dynamics. The report considers both historical data (2019-2024) and future projections (2025-2033).
Key Drivers of Christmas Tree Industry Growth
Several key factors drive the growth of the Christmas tree industry. These include the rising global demand for oil and gas, ongoing exploration and production activities in both onshore and offshore fields, technological advancements leading to more efficient and reliable systems, and increasing investments in deepwater projects. Government policies supporting energy exploration and production also play a significant role.
Challenges in the Christmas Tree Industry Sector
The Christmas tree industry faces challenges such as fluctuating oil and gas prices, stringent environmental regulations impacting operational costs, and the need for continuous technological innovation to maintain competitiveness. Supply chain disruptions can also significantly impact manufacturing and delivery timelines. These factors contribute to market volatility and create opportunities for companies that can adapt effectively.
Leading Players in the Christmas Tree Industry Market
- Yantai Jereh Petroleum Equipment & Technologies Co Ltd
- Shengji Group
- Worldwide Oilfield Machine
- Dril-Quip Inc
- Baker Hughes Company
- Aker Solutions
- INTERA Ltd
- Schlumberger Limited
- TechnipFMC PLC
Key Developments in Christmas Tree Industry Sector
- July 2022: CNOOC launched its first self-developed subsea Christmas tree system in the Bohai Sea, showcasing significant technological advancement and potential market disruption. The system's compact design and high daily output demonstrate improvements in efficiency and performance.
- March 2022: Woodside's contract with DOF Subsea Australia for subsea Xmas tree retrieval highlights the growing importance of decommissioning services in the market, representing a new revenue stream and potential for specialized service providers.
Strategic Christmas Tree Industry Market Outlook
The Christmas tree industry is poised for continued growth, driven by persistent energy demand, ongoing exploration and production activities, and technological innovations. Companies focused on advanced subsea systems, automation, and environmentally friendly solutions are expected to experience significant success. Strategic partnerships and M&A activity will likely remain key drivers of consolidation and expansion in the coming years.
Christmas Tree Industry Segmentation
-
1. Type
- 1.1. Horizontal Tree
- 1.2. Vertical Tree
-
2. Location of Deployment
- 2.1. Onshore
- 2.2. Offshore
Christmas Tree Industry Segmentation By Geography
- 1. North America
- 2. Europe
- 3. South America
- 4. Asia Pacific
- 5. Middle East and Africa
Christmas Tree Industry REPORT HIGHLIGHTS
| Aspects | Details |
|---|---|
| Study Period | 2019-2033 |
| Base Year | 2024 |
| Estimated Year | 2025 |
| Forecast Period | 2025-2033 |
| Historical Period | 2019-2024 |
| Growth Rate | CAGR of 4.31% from 2019-2033 |
| Segmentation |
|
Table of Contents
- 1. Introduction
- 1.1. Research Scope
- 1.2. Market Segmentation
- 1.3. Research Methodology
- 1.4. Definitions and Assumptions
- 2. Executive Summary
- 2.1. Introduction
- 3. Market Dynamics
- 3.1. Introduction
- 3.2. Market Drivers
- 3.2.1. 4.; Increasing Investments in Offshore Wind Power Projects4.; Supportive Government Policies
- 3.3. Market Restrains
- 3.3.1. 4.; Increasing Adopting of Alternative Clean Energy Sources (Ex
- 3.4. Market Trends
- 3.4.1. The Onshore Sector is Expected to Dominate the Market
- 4. Market Factor Analysis
- 4.1. Porters Five Forces
- 4.2. Supply/Value Chain
- 4.3. PESTEL analysis
- 4.4. Market Entropy
- 4.5. Patent/Trademark Analysis
- 5. Global Christmas Tree Industry Analysis, Insights and Forecast, 2019-2031
- 5.1. Market Analysis, Insights and Forecast - by Type
- 5.1.1. Horizontal Tree
- 5.1.2. Vertical Tree
- 5.2. Market Analysis, Insights and Forecast - by Location of Deployment
- 5.2.1. Onshore
- 5.2.2. Offshore
- 5.3. Market Analysis, Insights and Forecast - by Region
- 5.3.1. North America
- 5.3.2. Europe
- 5.3.3. South America
- 5.3.4. Asia Pacific
- 5.3.5. Middle East and Africa
- 5.1. Market Analysis, Insights and Forecast - by Type
- 6. North America Christmas Tree Industry Analysis, Insights and Forecast, 2019-2031
- 6.1. Market Analysis, Insights and Forecast - by Type
- 6.1.1. Horizontal Tree
- 6.1.2. Vertical Tree
- 6.2. Market Analysis, Insights and Forecast - by Location of Deployment
- 6.2.1. Onshore
- 6.2.2. Offshore
- 6.1. Market Analysis, Insights and Forecast - by Type
- 7. Europe Christmas Tree Industry Analysis, Insights and Forecast, 2019-2031
- 7.1. Market Analysis, Insights and Forecast - by Type
- 7.1.1. Horizontal Tree
- 7.1.2. Vertical Tree
- 7.2. Market Analysis, Insights and Forecast - by Location of Deployment
- 7.2.1. Onshore
- 7.2.2. Offshore
- 7.1. Market Analysis, Insights and Forecast - by Type
- 8. South America Christmas Tree Industry Analysis, Insights and Forecast, 2019-2031
- 8.1. Market Analysis, Insights and Forecast - by Type
- 8.1.1. Horizontal Tree
- 8.1.2. Vertical Tree
- 8.2. Market Analysis, Insights and Forecast - by Location of Deployment
- 8.2.1. Onshore
- 8.2.2. Offshore
- 8.1. Market Analysis, Insights and Forecast - by Type
- 9. Asia Pacific Christmas Tree Industry Analysis, Insights and Forecast, 2019-2031
- 9.1. Market Analysis, Insights and Forecast - by Type
- 9.1.1. Horizontal Tree
- 9.1.2. Vertical Tree
- 9.2. Market Analysis, Insights and Forecast - by Location of Deployment
- 9.2.1. Onshore
- 9.2.2. Offshore
- 9.1. Market Analysis, Insights and Forecast - by Type
- 10. Middle East and Africa Christmas Tree Industry Analysis, Insights and Forecast, 2019-2031
- 10.1. Market Analysis, Insights and Forecast - by Type
- 10.1.1. Horizontal Tree
- 10.1.2. Vertical Tree
- 10.2. Market Analysis, Insights and Forecast - by Location of Deployment
- 10.2.1. Onshore
- 10.2.2. Offshore
- 10.1. Market Analysis, Insights and Forecast - by Type
- 11. North America Christmas Tree Industry Analysis, Insights and Forecast, 2019-2031
- 11.1. Market Analysis, Insights and Forecast - By Country/Sub-region
- 11.1.1 United States
- 11.1.2 Canada
- 11.1.3 Mexico
- 12. Europe Christmas Tree Industry Analysis, Insights and Forecast, 2019-2031
- 12.1. Market Analysis, Insights and Forecast - By Country/Sub-region
- 12.1.1 Germany
- 12.1.2 United Kingdom
- 12.1.3 France
- 12.1.4 Spain
- 12.1.5 Italy
- 12.1.6 Spain
- 12.1.7 Belgium
- 12.1.8 Netherland
- 12.1.9 Nordics
- 12.1.10 Rest of Europe
- 13. Asia Pacific Christmas Tree Industry Analysis, Insights and Forecast, 2019-2031
- 13.1. Market Analysis, Insights and Forecast - By Country/Sub-region
- 13.1.1 China
- 13.1.2 Japan
- 13.1.3 India
- 13.1.4 South Korea
- 13.1.5 Southeast Asia
- 13.1.6 Australia
- 13.1.7 Indonesia
- 13.1.8 Phillipes
- 13.1.9 Singapore
- 13.1.10 Thailandc
- 13.1.11 Rest of Asia Pacific
- 14. South America Christmas Tree Industry Analysis, Insights and Forecast, 2019-2031
- 14.1. Market Analysis, Insights and Forecast - By Country/Sub-region
- 14.1.1 Brazil
- 14.1.2 Argentina
- 14.1.3 Peru
- 14.1.4 Chile
- 14.1.5 Colombia
- 14.1.6 Ecuador
- 14.1.7 Venezuela
- 14.1.8 Rest of South America
- 15. North America Christmas Tree Industry Analysis, Insights and Forecast, 2019-2031
- 15.1. Market Analysis, Insights and Forecast - By Country/Sub-region
- 15.1.1 United States
- 15.1.2 Canada
- 15.1.3 Mexico
- 16. MEA Christmas Tree Industry Analysis, Insights and Forecast, 2019-2031
- 16.1. Market Analysis, Insights and Forecast - By Country/Sub-region
- 16.1.1 United Arab Emirates
- 16.1.2 Saudi Arabia
- 16.1.3 South Africa
- 16.1.4 Rest of Middle East and Africa
- 17. Competitive Analysis
- 17.1. Global Market Share Analysis 2024
- 17.2. Company Profiles
- 17.2.1 Yantai Jereh Petroleum Equipment & Technologies Co Ltd
- 17.2.1.1. Overview
- 17.2.1.2. Products
- 17.2.1.3. SWOT Analysis
- 17.2.1.4. Recent Developments
- 17.2.1.5. Financials (Based on Availability)
- 17.2.2 Shengji Group
- 17.2.2.1. Overview
- 17.2.2.2. Products
- 17.2.2.3. SWOT Analysis
- 17.2.2.4. Recent Developments
- 17.2.2.5. Financials (Based on Availability)
- 17.2.3 Worldwide Oilfield Machine
- 17.2.3.1. Overview
- 17.2.3.2. Products
- 17.2.3.3. SWOT Analysis
- 17.2.3.4. Recent Developments
- 17.2.3.5. Financials (Based on Availability)
- 17.2.4 Dril-Quip Inc
- 17.2.4.1. Overview
- 17.2.4.2. Products
- 17.2.4.3. SWOT Analysis
- 17.2.4.4. Recent Developments
- 17.2.4.5. Financials (Based on Availability)
- 17.2.5 Baker Hughes Company
- 17.2.5.1. Overview
- 17.2.5.2. Products
- 17.2.5.3. SWOT Analysis
- 17.2.5.4. Recent Developments
- 17.2.5.5. Financials (Based on Availability)
- 17.2.6 Aker Solutions
- 17.2.6.1. Overview
- 17.2.6.2. Products
- 17.2.6.3. SWOT Analysis
- 17.2.6.4. Recent Developments
- 17.2.6.5. Financials (Based on Availability)
- 17.2.7 INTERA Ltd*List Not Exhaustive
- 17.2.7.1. Overview
- 17.2.7.2. Products
- 17.2.7.3. SWOT Analysis
- 17.2.7.4. Recent Developments
- 17.2.7.5. Financials (Based on Availability)
- 17.2.8 Schlumberger Limited
- 17.2.8.1. Overview
- 17.2.8.2. Products
- 17.2.8.3. SWOT Analysis
- 17.2.8.4. Recent Developments
- 17.2.8.5. Financials (Based on Availability)
- 17.2.9 TechnipFMC PLC
- 17.2.9.1. Overview
- 17.2.9.2. Products
- 17.2.9.3. SWOT Analysis
- 17.2.9.4. Recent Developments
- 17.2.9.5. Financials (Based on Availability)
- 17.2.1 Yantai Jereh Petroleum Equipment & Technologies Co Ltd
List of Figures
- Figure 1: Global Christmas Tree Industry Revenue Breakdown (Million, %) by Region 2024 & 2032
- Figure 2: Global Christmas Tree Industry Volume Breakdown (K Units, %) by Region 2024 & 2032
- Figure 3: North America Christmas Tree Industry Revenue (Million), by Country 2024 & 2032
- Figure 4: North America Christmas Tree Industry Volume (K Units), by Country 2024 & 2032
- Figure 5: North America Christmas Tree Industry Revenue Share (%), by Country 2024 & 2032
- Figure 6: North America Christmas Tree Industry Volume Share (%), by Country 2024 & 2032
- Figure 7: Europe Christmas Tree Industry Revenue (Million), by Country 2024 & 2032
- Figure 8: Europe Christmas Tree Industry Volume (K Units), by Country 2024 & 2032
- Figure 9: Europe Christmas Tree Industry Revenue Share (%), by Country 2024 & 2032
- Figure 10: Europe Christmas Tree Industry Volume Share (%), by Country 2024 & 2032
- Figure 11: Asia Pacific Christmas Tree Industry Revenue (Million), by Country 2024 & 2032
- Figure 12: Asia Pacific Christmas Tree Industry Volume (K Units), by Country 2024 & 2032
- Figure 13: Asia Pacific Christmas Tree Industry Revenue Share (%), by Country 2024 & 2032
- Figure 14: Asia Pacific Christmas Tree Industry Volume Share (%), by Country 2024 & 2032
- Figure 15: South America Christmas Tree Industry Revenue (Million), by Country 2024 & 2032
- Figure 16: South America Christmas Tree Industry Volume (K Units), by Country 2024 & 2032
- Figure 17: South America Christmas Tree Industry Revenue Share (%), by Country 2024 & 2032
- Figure 18: South America Christmas Tree Industry Volume Share (%), by Country 2024 & 2032
- Figure 19: North America Christmas Tree Industry Revenue (Million), by Country 2024 & 2032
- Figure 20: North America Christmas Tree Industry Volume (K Units), by Country 2024 & 2032
- Figure 21: North America Christmas Tree Industry Revenue Share (%), by Country 2024 & 2032
- Figure 22: North America Christmas Tree Industry Volume Share (%), by Country 2024 & 2032
- Figure 23: MEA Christmas Tree Industry Revenue (Million), by Country 2024 & 2032
- Figure 24: MEA Christmas Tree Industry Volume (K Units), by Country 2024 & 2032
- Figure 25: MEA Christmas Tree Industry Revenue Share (%), by Country 2024 & 2032
- Figure 26: MEA Christmas Tree Industry Volume Share (%), by Country 2024 & 2032
- Figure 27: North America Christmas Tree Industry Revenue (Million), by Type 2024 & 2032
- Figure 28: North America Christmas Tree Industry Volume (K Units), by Type 2024 & 2032
- Figure 29: North America Christmas Tree Industry Revenue Share (%), by Type 2024 & 2032
- Figure 30: North America Christmas Tree Industry Volume Share (%), by Type 2024 & 2032
- Figure 31: North America Christmas Tree Industry Revenue (Million), by Location of Deployment 2024 & 2032
- Figure 32: North America Christmas Tree Industry Volume (K Units), by Location of Deployment 2024 & 2032
- Figure 33: North America Christmas Tree Industry Revenue Share (%), by Location of Deployment 2024 & 2032
- Figure 34: North America Christmas Tree Industry Volume Share (%), by Location of Deployment 2024 & 2032
- Figure 35: North America Christmas Tree Industry Revenue (Million), by Country 2024 & 2032
- Figure 36: North America Christmas Tree Industry Volume (K Units), by Country 2024 & 2032
- Figure 37: North America Christmas Tree Industry Revenue Share (%), by Country 2024 & 2032
- Figure 38: North America Christmas Tree Industry Volume Share (%), by Country 2024 & 2032
- Figure 39: Europe Christmas Tree Industry Revenue (Million), by Type 2024 & 2032
- Figure 40: Europe Christmas Tree Industry Volume (K Units), by Type 2024 & 2032
- Figure 41: Europe Christmas Tree Industry Revenue Share (%), by Type 2024 & 2032
- Figure 42: Europe Christmas Tree Industry Volume Share (%), by Type 2024 & 2032
- Figure 43: Europe Christmas Tree Industry Revenue (Million), by Location of Deployment 2024 & 2032
- Figure 44: Europe Christmas Tree Industry Volume (K Units), by Location of Deployment 2024 & 2032
- Figure 45: Europe Christmas Tree Industry Revenue Share (%), by Location of Deployment 2024 & 2032
- Figure 46: Europe Christmas Tree Industry Volume Share (%), by Location of Deployment 2024 & 2032
- Figure 47: Europe Christmas Tree Industry Revenue (Million), by Country 2024 & 2032
- Figure 48: Europe Christmas Tree Industry Volume (K Units), by Country 2024 & 2032
- Figure 49: Europe Christmas Tree Industry Revenue Share (%), by Country 2024 & 2032
- Figure 50: Europe Christmas Tree Industry Volume Share (%), by Country 2024 & 2032
- Figure 51: South America Christmas Tree Industry Revenue (Million), by Type 2024 & 2032
- Figure 52: South America Christmas Tree Industry Volume (K Units), by Type 2024 & 2032
- Figure 53: South America Christmas Tree Industry Revenue Share (%), by Type 2024 & 2032
- Figure 54: South America Christmas Tree Industry Volume Share (%), by Type 2024 & 2032
- Figure 55: South America Christmas Tree Industry Revenue (Million), by Location of Deployment 2024 & 2032
- Figure 56: South America Christmas Tree Industry Volume (K Units), by Location of Deployment 2024 & 2032
- Figure 57: South America Christmas Tree Industry Revenue Share (%), by Location of Deployment 2024 & 2032
- Figure 58: South America Christmas Tree Industry Volume Share (%), by Location of Deployment 2024 & 2032
- Figure 59: South America Christmas Tree Industry Revenue (Million), by Country 2024 & 2032
- Figure 60: South America Christmas Tree Industry Volume (K Units), by Country 2024 & 2032
- Figure 61: South America Christmas Tree Industry Revenue Share (%), by Country 2024 & 2032
- Figure 62: South America Christmas Tree Industry Volume Share (%), by Country 2024 & 2032
- Figure 63: Asia Pacific Christmas Tree Industry Revenue (Million), by Type 2024 & 2032
- Figure 64: Asia Pacific Christmas Tree Industry Volume (K Units), by Type 2024 & 2032
- Figure 65: Asia Pacific Christmas Tree Industry Revenue Share (%), by Type 2024 & 2032
- Figure 66: Asia Pacific Christmas Tree Industry Volume Share (%), by Type 2024 & 2032
- Figure 67: Asia Pacific Christmas Tree Industry Revenue (Million), by Location of Deployment 2024 & 2032
- Figure 68: Asia Pacific Christmas Tree Industry Volume (K Units), by Location of Deployment 2024 & 2032
- Figure 69: Asia Pacific Christmas Tree Industry Revenue Share (%), by Location of Deployment 2024 & 2032
- Figure 70: Asia Pacific Christmas Tree Industry Volume Share (%), by Location of Deployment 2024 & 2032
- Figure 71: Asia Pacific Christmas Tree Industry Revenue (Million), by Country 2024 & 2032
- Figure 72: Asia Pacific Christmas Tree Industry Volume (K Units), by Country 2024 & 2032
- Figure 73: Asia Pacific Christmas Tree Industry Revenue Share (%), by Country 2024 & 2032
- Figure 74: Asia Pacific Christmas Tree Industry Volume Share (%), by Country 2024 & 2032
- Figure 75: Middle East and Africa Christmas Tree Industry Revenue (Million), by Type 2024 & 2032
- Figure 76: Middle East and Africa Christmas Tree Industry Volume (K Units), by Type 2024 & 2032
- Figure 77: Middle East and Africa Christmas Tree Industry Revenue Share (%), by Type 2024 & 2032
- Figure 78: Middle East and Africa Christmas Tree Industry Volume Share (%), by Type 2024 & 2032
- Figure 79: Middle East and Africa Christmas Tree Industry Revenue (Million), by Location of Deployment 2024 & 2032
- Figure 80: Middle East and Africa Christmas Tree Industry Volume (K Units), by Location of Deployment 2024 & 2032
- Figure 81: Middle East and Africa Christmas Tree Industry Revenue Share (%), by Location of Deployment 2024 & 2032
- Figure 82: Middle East and Africa Christmas Tree Industry Volume Share (%), by Location of Deployment 2024 & 2032
- Figure 83: Middle East and Africa Christmas Tree Industry Revenue (Million), by Country 2024 & 2032
- Figure 84: Middle East and Africa Christmas Tree Industry Volume (K Units), by Country 2024 & 2032
- Figure 85: Middle East and Africa Christmas Tree Industry Revenue Share (%), by Country 2024 & 2032
- Figure 86: Middle East and Africa Christmas Tree Industry Volume Share (%), by Country 2024 & 2032
List of Tables
- Table 1: Global Christmas Tree Industry Revenue Million Forecast, by Region 2019 & 2032
- Table 2: Global Christmas Tree Industry Volume K Units Forecast, by Region 2019 & 2032
- Table 3: Global Christmas Tree Industry Revenue Million Forecast, by Type 2019 & 2032
- Table 4: Global Christmas Tree Industry Volume K Units Forecast, by Type 2019 & 2032
- Table 5: Global Christmas Tree Industry Revenue Million Forecast, by Location of Deployment 2019 & 2032
- Table 6: Global Christmas Tree Industry Volume K Units Forecast, by Location of Deployment 2019 & 2032
- Table 7: Global Christmas Tree Industry Revenue Million Forecast, by Region 2019 & 2032
- Table 8: Global Christmas Tree Industry Volume K Units Forecast, by Region 2019 & 2032
- Table 9: Global Christmas Tree Industry Revenue Million Forecast, by Country 2019 & 2032
- Table 10: Global Christmas Tree Industry Volume K Units Forecast, by Country 2019 & 2032
- Table 11: United States Christmas Tree Industry Revenue (Million) Forecast, by Application 2019 & 2032
- Table 12: United States Christmas Tree Industry Volume (K Units) Forecast, by Application 2019 & 2032
- Table 13: Canada Christmas Tree Industry Revenue (Million) Forecast, by Application 2019 & 2032
- Table 14: Canada Christmas Tree Industry Volume (K Units) Forecast, by Application 2019 & 2032
- Table 15: Mexico Christmas Tree Industry Revenue (Million) Forecast, by Application 2019 & 2032
- Table 16: Mexico Christmas Tree Industry Volume (K Units) Forecast, by Application 2019 & 2032
- Table 17: Global Christmas Tree Industry Revenue Million Forecast, by Country 2019 & 2032
- Table 18: Global Christmas Tree Industry Volume K Units Forecast, by Country 2019 & 2032
- Table 19: Germany Christmas Tree Industry Revenue (Million) Forecast, by Application 2019 & 2032
- Table 20: Germany Christmas Tree Industry Volume (K Units) Forecast, by Application 2019 & 2032
- Table 21: United Kingdom Christmas Tree Industry Revenue (Million) Forecast, by Application 2019 & 2032
- Table 22: United Kingdom Christmas Tree Industry Volume (K Units) Forecast, by Application 2019 & 2032
- Table 23: France Christmas Tree Industry Revenue (Million) Forecast, by Application 2019 & 2032
- Table 24: France Christmas Tree Industry Volume (K Units) Forecast, by Application 2019 & 2032
- Table 25: Spain Christmas Tree Industry Revenue (Million) Forecast, by Application 2019 & 2032
- Table 26: Spain Christmas Tree Industry Volume (K Units) Forecast, by Application 2019 & 2032
- Table 27: Italy Christmas Tree Industry Revenue (Million) Forecast, by Application 2019 & 2032
- Table 28: Italy Christmas Tree Industry Volume (K Units) Forecast, by Application 2019 & 2032
- Table 29: Spain Christmas Tree Industry Revenue (Million) Forecast, by Application 2019 & 2032
- Table 30: Spain Christmas Tree Industry Volume (K Units) Forecast, by Application 2019 & 2032
- Table 31: Belgium Christmas Tree Industry Revenue (Million) Forecast, by Application 2019 & 2032
- Table 32: Belgium Christmas Tree Industry Volume (K Units) Forecast, by Application 2019 & 2032
- Table 33: Netherland Christmas Tree Industry Revenue (Million) Forecast, by Application 2019 & 2032
- Table 34: Netherland Christmas Tree Industry Volume (K Units) Forecast, by Application 2019 & 2032
- Table 35: Nordics Christmas Tree Industry Revenue (Million) Forecast, by Application 2019 & 2032
- Table 36: Nordics Christmas Tree Industry Volume (K Units) Forecast, by Application 2019 & 2032
- Table 37: Rest of Europe Christmas Tree Industry Revenue (Million) Forecast, by Application 2019 & 2032
- Table 38: Rest of Europe Christmas Tree Industry Volume (K Units) Forecast, by Application 2019 & 2032
- Table 39: Global Christmas Tree Industry Revenue Million Forecast, by Country 2019 & 2032
- Table 40: Global Christmas Tree Industry Volume K Units Forecast, by Country 2019 & 2032
- Table 41: China Christmas Tree Industry Revenue (Million) Forecast, by Application 2019 & 2032
- Table 42: China Christmas Tree Industry Volume (K Units) Forecast, by Application 2019 & 2032
- Table 43: Japan Christmas Tree Industry Revenue (Million) Forecast, by Application 2019 & 2032
- Table 44: Japan Christmas Tree Industry Volume (K Units) Forecast, by Application 2019 & 2032
- Table 45: India Christmas Tree Industry Revenue (Million) Forecast, by Application 2019 & 2032
- Table 46: India Christmas Tree Industry Volume (K Units) Forecast, by Application 2019 & 2032
- Table 47: South Korea Christmas Tree Industry Revenue (Million) Forecast, by Application 2019 & 2032
- Table 48: South Korea Christmas Tree Industry Volume (K Units) Forecast, by Application 2019 & 2032
- Table 49: Southeast Asia Christmas Tree Industry Revenue (Million) Forecast, by Application 2019 & 2032
- Table 50: Southeast Asia Christmas Tree Industry Volume (K Units) Forecast, by Application 2019 & 2032
- Table 51: Australia Christmas Tree Industry Revenue (Million) Forecast, by Application 2019 & 2032
- Table 52: Australia Christmas Tree Industry Volume (K Units) Forecast, by Application 2019 & 2032
- Table 53: Indonesia Christmas Tree Industry Revenue (Million) Forecast, by Application 2019 & 2032
- Table 54: Indonesia Christmas Tree Industry Volume (K Units) Forecast, by Application 2019 & 2032
- Table 55: Phillipes Christmas Tree Industry Revenue (Million) Forecast, by Application 2019 & 2032
- Table 56: Phillipes Christmas Tree Industry Volume (K Units) Forecast, by Application 2019 & 2032
- Table 57: Singapore Christmas Tree Industry Revenue (Million) Forecast, by Application 2019 & 2032
- Table 58: Singapore Christmas Tree Industry Volume (K Units) Forecast, by Application 2019 & 2032
- Table 59: Thailandc Christmas Tree Industry Revenue (Million) Forecast, by Application 2019 & 2032
- Table 60: Thailandc Christmas Tree Industry Volume (K Units) Forecast, by Application 2019 & 2032
- Table 61: Rest of Asia Pacific Christmas Tree Industry Revenue (Million) Forecast, by Application 2019 & 2032
- Table 62: Rest of Asia Pacific Christmas Tree Industry Volume (K Units) Forecast, by Application 2019 & 2032
- Table 63: Global Christmas Tree Industry Revenue Million Forecast, by Country 2019 & 2032
- Table 64: Global Christmas Tree Industry Volume K Units Forecast, by Country 2019 & 2032
- Table 65: Brazil Christmas Tree Industry Revenue (Million) Forecast, by Application 2019 & 2032
- Table 66: Brazil Christmas Tree Industry Volume (K Units) Forecast, by Application 2019 & 2032
- Table 67: Argentina Christmas Tree Industry Revenue (Million) Forecast, by Application 2019 & 2032
- Table 68: Argentina Christmas Tree Industry Volume (K Units) Forecast, by Application 2019 & 2032
- Table 69: Peru Christmas Tree Industry Revenue (Million) Forecast, by Application 2019 & 2032
- Table 70: Peru Christmas Tree Industry Volume (K Units) Forecast, by Application 2019 & 2032
- Table 71: Chile Christmas Tree Industry Revenue (Million) Forecast, by Application 2019 & 2032
- Table 72: Chile Christmas Tree Industry Volume (K Units) Forecast, by Application 2019 & 2032
- Table 73: Colombia Christmas Tree Industry Revenue (Million) Forecast, by Application 2019 & 2032
- Table 74: Colombia Christmas Tree Industry Volume (K Units) Forecast, by Application 2019 & 2032
- Table 75: Ecuador Christmas Tree Industry Revenue (Million) Forecast, by Application 2019 & 2032
- Table 76: Ecuador Christmas Tree Industry Volume (K Units) Forecast, by Application 2019 & 2032
- Table 77: Venezuela Christmas Tree Industry Revenue (Million) Forecast, by Application 2019 & 2032
- Table 78: Venezuela Christmas Tree Industry Volume (K Units) Forecast, by Application 2019 & 2032
- Table 79: Rest of South America Christmas Tree Industry Revenue (Million) Forecast, by Application 2019 & 2032
- Table 80: Rest of South America Christmas Tree Industry Volume (K Units) Forecast, by Application 2019 & 2032
- Table 81: Global Christmas Tree Industry Revenue Million Forecast, by Country 2019 & 2032
- Table 82: Global Christmas Tree Industry Volume K Units Forecast, by Country 2019 & 2032
- Table 83: United States Christmas Tree Industry Revenue (Million) Forecast, by Application 2019 & 2032
- Table 84: United States Christmas Tree Industry Volume (K Units) Forecast, by Application 2019 & 2032
- Table 85: Canada Christmas Tree Industry Revenue (Million) Forecast, by Application 2019 & 2032
- Table 86: Canada Christmas Tree Industry Volume (K Units) Forecast, by Application 2019 & 2032
- Table 87: Mexico Christmas Tree Industry Revenue (Million) Forecast, by Application 2019 & 2032
- Table 88: Mexico Christmas Tree Industry Volume (K Units) Forecast, by Application 2019 & 2032
- Table 89: Global Christmas Tree Industry Revenue Million Forecast, by Country 2019 & 2032
- Table 90: Global Christmas Tree Industry Volume K Units Forecast, by Country 2019 & 2032
- Table 91: United Arab Emirates Christmas Tree Industry Revenue (Million) Forecast, by Application 2019 & 2032
- Table 92: United Arab Emirates Christmas Tree Industry Volume (K Units) Forecast, by Application 2019 & 2032
- Table 93: Saudi Arabia Christmas Tree Industry Revenue (Million) Forecast, by Application 2019 & 2032
- Table 94: Saudi Arabia Christmas Tree Industry Volume (K Units) Forecast, by Application 2019 & 2032
- Table 95: South Africa Christmas Tree Industry Revenue (Million) Forecast, by Application 2019 & 2032
- Table 96: South Africa Christmas Tree Industry Volume (K Units) Forecast, by Application 2019 & 2032
- Table 97: Rest of Middle East and Africa Christmas Tree Industry Revenue (Million) Forecast, by Application 2019 & 2032
- Table 98: Rest of Middle East and Africa Christmas Tree Industry Volume (K Units) Forecast, by Application 2019 & 2032
- Table 99: Global Christmas Tree Industry Revenue Million Forecast, by Type 2019 & 2032
- Table 100: Global Christmas Tree Industry Volume K Units Forecast, by Type 2019 & 2032
- Table 101: Global Christmas Tree Industry Revenue Million Forecast, by Location of Deployment 2019 & 2032
- Table 102: Global Christmas Tree Industry Volume K Units Forecast, by Location of Deployment 2019 & 2032
- Table 103: Global Christmas Tree Industry Revenue Million Forecast, by Country 2019 & 2032
- Table 104: Global Christmas Tree Industry Volume K Units Forecast, by Country 2019 & 2032
- Table 105: Global Christmas Tree Industry Revenue Million Forecast, by Type 2019 & 2032
- Table 106: Global Christmas Tree Industry Volume K Units Forecast, by Type 2019 & 2032
- Table 107: Global Christmas Tree Industry Revenue Million Forecast, by Location of Deployment 2019 & 2032
- Table 108: Global Christmas Tree Industry Volume K Units Forecast, by Location of Deployment 2019 & 2032
- Table 109: Global Christmas Tree Industry Revenue Million Forecast, by Country 2019 & 2032
- Table 110: Global Christmas Tree Industry Volume K Units Forecast, by Country 2019 & 2032
- Table 111: Global Christmas Tree Industry Revenue Million Forecast, by Type 2019 & 2032
- Table 112: Global Christmas Tree Industry Volume K Units Forecast, by Type 2019 & 2032
- Table 113: Global Christmas Tree Industry Revenue Million Forecast, by Location of Deployment 2019 & 2032
- Table 114: Global Christmas Tree Industry Volume K Units Forecast, by Location of Deployment 2019 & 2032
- Table 115: Global Christmas Tree Industry Revenue Million Forecast, by Country 2019 & 2032
- Table 116: Global Christmas Tree Industry Volume K Units Forecast, by Country 2019 & 2032
- Table 117: Global Christmas Tree Industry Revenue Million Forecast, by Type 2019 & 2032
- Table 118: Global Christmas Tree Industry Volume K Units Forecast, by Type 2019 & 2032
- Table 119: Global Christmas Tree Industry Revenue Million Forecast, by Location of Deployment 2019 & 2032
- Table 120: Global Christmas Tree Industry Volume K Units Forecast, by Location of Deployment 2019 & 2032
- Table 121: Global Christmas Tree Industry Revenue Million Forecast, by Country 2019 & 2032
- Table 122: Global Christmas Tree Industry Volume K Units Forecast, by Country 2019 & 2032
- Table 123: Global Christmas Tree Industry Revenue Million Forecast, by Type 2019 & 2032
- Table 124: Global Christmas Tree Industry Volume K Units Forecast, by Type 2019 & 2032
- Table 125: Global Christmas Tree Industry Revenue Million Forecast, by Location of Deployment 2019 & 2032
- Table 126: Global Christmas Tree Industry Volume K Units Forecast, by Location of Deployment 2019 & 2032
- Table 127: Global Christmas Tree Industry Revenue Million Forecast, by Country 2019 & 2032
- Table 128: Global Christmas Tree Industry Volume K Units Forecast, by Country 2019 & 2032
Frequently Asked Questions
1. What is the projected Compound Annual Growth Rate (CAGR) of the Christmas Tree Industry?
The projected CAGR is approximately 4.31%.
2. Which companies are prominent players in the Christmas Tree Industry?
Key companies in the market include Yantai Jereh Petroleum Equipment & Technologies Co Ltd, Shengji Group, Worldwide Oilfield Machine, Dril-Quip Inc, Baker Hughes Company, Aker Solutions, INTERA Ltd*List Not Exhaustive, Schlumberger Limited, TechnipFMC PLC.
3. What are the main segments of the Christmas Tree Industry?
The market segments include Type, Location of Deployment.
4. Can you provide details about the market size?
The market size is estimated to be USD XX Million as of 2022.
5. What are some drivers contributing to market growth?
4.; Increasing Investments in Offshore Wind Power Projects4.; Supportive Government Policies.
6. What are the notable trends driving market growth?
The Onshore Sector is Expected to Dominate the Market.
7. Are there any restraints impacting market growth?
4.; Increasing Adopting of Alternative Clean Energy Sources (Ex: Solar. Hydro).
8. Can you provide examples of recent developments in the market?
July 2022: China National Offshore Oil Corporation (CNOOC) launched its first self-developed subsea Christmas tree (Xmas) system in the Bohai Sea. The subsea Xmas oil and gas extraction system was installed in the Jinzhou 31-1 gas field in the Bohai Sea with a daily trial output of 310,000 cubic meters, able to meet the gas usage needs of 1,500 households for an entire year. The system was designed in a compact structure, weighing 24.8 tons. It is suitable for use in shallow water and has an expected operating life of 15 years.
9. What pricing options are available for accessing the report?
Pricing options include single-user, multi-user, and enterprise licenses priced at USD 4750, USD 5250, and USD 8750 respectively.
10. Is the market size provided in terms of value or volume?
The market size is provided in terms of value, measured in Million and volume, measured in K Units.
11. Are there any specific market keywords associated with the report?
Yes, the market keyword associated with the report is "Christmas Tree Industry," which aids in identifying and referencing the specific market segment covered.
12. How do I determine which pricing option suits my needs best?
The pricing options vary based on user requirements and access needs. Individual users may opt for single-user licenses, while businesses requiring broader access may choose multi-user or enterprise licenses for cost-effective access to the report.
13. Are there any additional resources or data provided in the Christmas Tree Industry report?
While the report offers comprehensive insights, it's advisable to review the specific contents or supplementary materials provided to ascertain if additional resources or data are available.
14. How can I stay updated on further developments or reports in the Christmas Tree Industry?
To stay informed about further developments, trends, and reports in the Christmas Tree Industry, consider subscribing to industry newsletters, following relevant companies and organizations, or regularly checking reputable industry news sources and publications.
Methodology
Step 1 - Identification of Relevant Samples Size from Population Database


Step 2 - Approaches for Defining Global Market Size (Value, Volume* & Price*)

Note*: In applicable scenarios
Step 3 - Data Sources
Primary Research
- Web Analytics
- Survey Reports
- Research Institute
- Latest Research Reports
- Opinion Leaders
Secondary Research
- Annual Reports
- White Paper
- Latest Press Release
- Industry Association
- Paid Database
- Investor Presentations

Step 4 - Data Triangulation
Involves using different sources of information in order to increase the validity of a study
These sources are likely to be stakeholders in a program - participants, other researchers, program staff, other community members, and so on.
Then we put all data in single framework & apply various statistical tools to find out the dynamic on the market.
During the analysis stage, feedback from the stakeholder groups would be compared to determine areas of agreement as well as areas of divergence


